
Amorphous NiO electrocatalyst overcoated ZnO nanorod photoanodes for enhanced photoelectrochemical performance†
Yanchao
Mao
a,
Yongguang
Cheng
ad,
Junqiao
Wang
a,
Hao
Yang
b,
Mingyang
Li
b,
Jian
Chen
c,
Mingju
Chao
a,
Yexiang
Tong
b and
Erjun
Liang
*a
aMOE Laboratory of Materials Physics, School of Physical Science and Engineering, Zhengzhou University, Zhengzhou 450052, China. E-mail: ejliang@zzu.edu.cn
bSchool of Chemistry and Chemical Engineering, Sun Yat-sen University, Guangzhou 510275, China
cInstrumental Analysis and Research Centre, Sun Yat-sen University, Guangzhou 510275, China
dCollege of Science, Henan Institute of Engineering, China
First published on 21st October 2015
Abstract
Developing high-performance photoanodes is essential for practical applications of photoelectrochemical (PEC) water splitting. In this work, we demonstrated that introducing amorphous NiO electrocatalysts onto the surface of ZnO nanorod (NR) photoanodes can largely improve their PEC performance. The NiO/ZnO core–shell NR arrays were obtained by two step electrodepositions and annealing. The amorphous NiO nanosheet electrocatalyst shell on a single crystalline ZnO NR semiconductor core formed a composite photoanode configuration for PEC water splitting. The NiO/ZnO photoanode yielded a remarkable 260 mV cathodic shift in the onset potential for water oxidation compared to the bare ZnO photoanode. And the highest PEC efficiency of the NiO/ZnO photoanode was found to be 1.81%, which is 30 times higher than that of the ZnO photoanode (0.06%). This research demonstrates that introducing amorphous NiO electrocatalysts can largely improve the PEC performance of ZnO photoanodes.
Introduction
As an effective solar energy conversion technique, photoelectrochemical (PEC) water splitting has attracted great attention because it offers the capability of harvesting solar energy to generate hydrogen.1 A series of metal oxides e.g. α-Fe2O3,2 TiO2,3 and ZnO4 have been applied as photoanodes for PEC water splitting. Nevertheless, there are still numerous challenges in the development of high-performance photoanodes. A complete PEC water splitting process includes light absorption, generating electron–hole pairs, charge transport, and catalysis for water redox reactions. Therefore, an ideal photoanode should possess an appropriate band structure, good light harvesting ability, a low recombination rate of electron–hole pairs, good conductivity, and high catalytic activity for water redox reactions. So far, there has not been a single material reported having all these merits of an ideal photoanode. For instance, α-Fe2O3 is a promising photoanode material due to its appropriate band structure for ultilizing visible light and high theoretical solar-to-hydrogen conversion efficiency of 15%.5 However, the reported conversion efficiencies of α-Fe2O3 photoanodes are considerably lower than the theoretical value owing to several limiting factors such as a low absorption coefficient, insulator-like conductivity, and poor oxygen evolution reaction kinetics.6 TiO2 has also been extensively studied as a PEC photoanode because it has excellent stability and good catalytic properties, and appropriate valence and conduction band edges beyond the oxidation and reduction potential of water respectively.7 Nevertheless, its low conductivity and wide bandgap that cannot harvest visible light remain as obstacles for achieving a high conversion efficiency. ZnO has a similar band structure to TiO2,8 and the typical electron mobility of ZnO is 10–100 times higher than that of TiO2,9 which make ZnO a very promising candidate for PEC water splitting. However, owing to the high recombination rate of electron–hole pairs and poor catalytic activity for the water oxidation reaction,10 the reported PEC efficiency of the ZnO photoanode is still much lower than TiO2.Recently, considerable research efforts have been devoted to introducing electrocatalysts onto the surface of the photoanode, which could promote the surface oxygen evolution reaction of photoanodes. For example, Co–Pi electrocatalysts have been used to improve the PEC performance of α-Fe2O3,11 WO3,12 and BiVO4.13 Meanwhile, a series of Ni-based electrocatalysts e.g. nickel borates,14 nickel hydroxides,15 nickel oxides,16,17 and nickel cobaltite18 exhibited excellent catalytic performance for the water oxidation reaction. Nickel hydroxide19 and nickel oxide20 electrocatalysts have also been shown to improve the PEC performance of photoanodes. In addition, superior electrocatalytic activity in the water oxidation reaction was demonstrated from amorphous electrocatalytic materials compared to their crystalline phase, including Fe2O3,21 CoOx,21 and RuO2.22 It is because these amorphous electrocatalysts have larger density of active surface unsaturated sites and a higher degree of atomic structural flexibility than their crystalline phase.21,22 To date, many composite photoanodes e.g. ZnFe2O4/ZnO,23,24 CdTe/ZnO,25,26 CdSe/ZnO,27 CdSe/CdS/ZnO,28 Pt/ZnO,29 g-C3N4/ZnO,30 g-C3N4/Pt/ZnO,31 BiOI/ZnO,32,33 Ni(OH)2/ZnO,19 CoNi double hydroxide/ZnO,34etc. have been developed to improve the PEC performance of ZnO. In this work, we introduced amorphous NiO electrocatalysts onto the surface of the conventional ZnO photoanode to overcome its limitations and improve the PEC performance. The amorphous NiO/single crystalline ZnO core–shell nanorod (NR) array photoanode exhibited a remarkable cathodic shift in onset potential for water oxidation and a significant enhancement of PEC efficiency compared to the bare ZnO photoanode. This research demonstrated that introducing amorphous NiO electrocatalysts can advantageously impact the PEC performance of the conventional ZnO photoanode.
Experimental section
Fabrication of NiO/ZnO core–shell NR arrays
All reagents in this study were of analytical grade. Electrodeposition experiments were performed in a conventional three-electrode cell. A graphite rod and a saturated calomel electrode (SCE) was used as a counter electrode and a reference electrode, respectively. The working electrode was the F-doped SnO2 coated glass (FTO) with a sheet resistance of 14 Ω sq−1. The FTO glass was ultrasonically cleaned in deionized (DI) water, then ethanol, and it was finally washed by DI water again before electrodeposition. The ZnO NR arrays were synthesized through cathodic electrodeposition in a solution containing 0.02 M Zn(NO3)2 + 0.01 M CH3COONH4 + 0.01 M (CH2)6N4 under a current density of 0.5 mA cm−2 for 1 h at 90 °C. The secondary electrodeposition was carried out on the as-synthesized ZnO NR arrays in a solution of 0.01 M NiCl2 + 0.02 M NH4NO3 at 1 mA cm−2 for 3 min at 70 °C. After the two-step electrodeposition, the sample was rinsed in DI water, and then was dried in air at room temperature before annealing. The as-deposited samples were further annealed in air at 300 °C for 2 h with a heating rate of 1 °C min−1. The NiO/ZnO core–shell NR arrays were thus obtained after annealing. The bare NiO was obtained by the same cathodic electrdeposition in the solution of 0.01 M NiCl2 + 0.02 M NH4NO3 and the subsequent annealing process.Characterization
The surface morphology of the samples was observed through a scanning electron microscope (SEM, LEO 1530). The structure of the samples was investigated by using a transmission electron microscope (TEM, JEM2010-HR). For the TEM measurement, the prepared samples were mechanically scratched and ground into powders. The scratched specimens were mixed with ethanol, and then were collected with a carbon-coated copper grid. The X-ray powder diffraction (XRD) patterns of the samples were recorded on a diffractometer equipped with Cu Kα (λ = 1.541 Å) radiation (Bruker D8 ADVANCE). X-ray photoelectron spectroscopy (XPS) characterization was carried out on an ESCA Lab 250 (Thermo VG), using 200 W Al Ka radiation and the analysis chamber pressure was ∼7.5 × 10⁻⁶ Pa. The distance between the sample and the X-ray gun was ∼1 cm and the pass energy constant was 20 eV for the high resolution scans. The spectra were energy referenced to the C 1s peak of adventitious carbon at 284.8 eV. The diffuse reflectance spectra (DRS) were recorded on a Varian Cary 5000 spectrophotometer.PEC experiments
PEC experiments were carried out on a CHI 660d electrochemical workstation (CHI Instruments) in a typical three-electrode PEC cell with a quartz window to facilitate the illumination of the photoelectrode surface. A Pt foil was used as a counter electrode, and an Ag/AgCl electrode was used as a reference electrode. The prepared NiO/ZnO NR arrays on the FTO substrate acted as the working electrode. The bare ZnO NR arrays were annealed under the same condition and also served as photoanodes for comparison measurements. The electrolyte was a 0.5 M Na2SO4 aqueous solution (pH = 6.62). A 500 W Xe lamp (PLS-LAX500, Perfectlight) with a water IR filter was used as the illumination source. The illumination intensity at the photoelectrode position was 100 mW cm−2. All PEC experiments were performed at room temperature in air.Results and discussion
The NiO/ZnO core–shell NR arrays were obtained by two step electrodepositions and annealing, as schematically shown in Fig. 1. The ZnO NR arrays were first grown on FTO substrates via cathodic electrodeposition. The morphology of the ZnO NR arrays is shown in Fig. 2a. The dense and quasi-aligned ZnO NRs were grown vertically on the substrate. A closer view in Fig. 2b shows that the ZnO NRs have a smooth surface and slightly tempered tips. Subsequently, NiO nanosheets were coated onto the ZnO NR arrays after the secondary electrodeposition and annealing. The morphology of NiO coating is shown in Fig. 2c, it can be clearly seen that ZnO NRs were uniformly covered with a rough layer of NiO. As shown in a closer view in Fig. 2d, the ZnO NR was coated by a layer of tiny sheet-like NiO nanostructures. These NiO nanosheets covering the entire ZnO body make the NiO/ZnO core–shell NR possess a rough and wrinkled surface feature. | ||
| Fig. 1 Schematic procedure for fabricating NiO/ZnO core–shell NR arrays on the FTO substrate. | ||
 | ||
| Fig. 2 (a and b) Low- and high-magnification SEM images of ZnO NR arrays, respectively. (c and d) Low- and high-magnification SEM images of as-prepared NiO/ZnO core–shell NR arrays, respectively. | ||
Fig. 3a shows the XRD pattern of as-prepared core–shell NRs. All the diffraction peaks can be indexed to hexagonal wurtzite ZnO (JCPDS 36-1451) and FTO substrates. It is worth noting that there is no peak assigned to Ni-based components of the product, which indicates that the Ni-based component of the shell layer is amorphous. In order to further verify the chemical composition of the amorphous coating products, XPS characterization was carried out. As shown in Fig. 3b, Zn, O, and Ni signals can be clearly observed in the XPS survey spectrum. KLL and LMM peaks are the Auger spectra related to the electrons of neighboring K, L, and M atomic shells, respectively. Additionally, Si and Cl peaks were also detected, which were originated from the XPS testing substrate and the adsorbed electrolyte in electrodeposition process, respectively. Fig. 3c shows the Zn 2p spectrum, and the Zn 2p3/2 peak centered at 1021.9 eV corresponds to Zn2+ in ZnO,35 which is consistent with the XRD results. The Ni 2p spectrum is illustrated in Fig. 3d. Two Ni satellite peaks are located at the higher binding energy sides of the double Ni 2p peaks. The entire peak shape and the Ni 2p3/2 peak value (853.9 eV) indicated that it is the signature peak of Ni2+ in NiO.36 The TEM results revealed that the core–shell NR consists of a single crystalline ZnO core and an amorphous NiO shell (Fig. S1, ESI†), which is consistent with the XRD and XPS results. The amorphous NiO nanosheet electrocatalyst shell on the single crystalline ZnO NR semiconductor core forms a promising composite photoanode configuration that may lead to a significant improvement of the PEC performance.
 | ||
| Fig. 3 (a) XRD patterns of the NiO/ZnO core–shell NR arrays. The XPS spectrum of (b) survey scan, (c) Zn 2p, and (d) Ni 2p for the NiO/ZnO core–shell NR arrays. | ||
The current–voltage (J–V) curves were measured to characterize the PEC performance of the NiO/ZnO core–shell NR and bare ZnO NR photoanodes. The solar-to-hydrogen conversion efficiencies (η) were calculated from these J–V curves under illumination. The detailed calculation process and PEC performance parameters (Table S1) are shown in the ESI.† In the dark scans, the NiO/ZnO photoanode exhibited obvious higher dark current density from 0.65 to 1.6 V compared to the bare ZnO photoanode (inset of Fig. 4a). Because ZnO NR arrays only act as conductive substrates in the NiO/ZnO photoelectrode in dark scan, the high dark current density of the NiO/ZnO photoanode evidenced the electrocatalytic activity of NiO electrocatalysts. Upon illumination, the NiO/ZnO photoanode exhibited an obvious PEC photocurrent enhancement relative to the bare ZnO photoanode (Fig. 4a). The enhancement of photocurrent was also obtained below the thermodynamic potential for O2 evolution  , which is 1.23 V vs. the reversible hydrogen electrode (RHE). The photocurrent value at 1.23 V vs. RHE is 1.87 mA cm−2 for the NiO/ZnO photoanode and 0.04 mA cm−2 for the ZnO photoanode (inset of Fig. 4a), respectively. The NiO/ZnO photoanode also yielded a 260 mV cathodic shift in the onset potential for water oxidation compared to the ZnO photoanode. The remarkable cathodic shift evidences the effective electrocatalytic activity of the NiO catalyst in the oxygen evolution reaction.37 This cathodic shift of onset potential is also a competitive value compared to the Ga2O3/α-Fe2O3 photoanode (>100 mV),38 the Co–Pi/BiV0.98Mo0.02O4 photoanode (∼150 mV),13 the Co–Pi/WO3 photoanode (170 mV),12 the CoCp2/O3/α-Fe2O3 photoanode (200 mV),39 the Co–Pi/ZnO photoanode (230 mV),10 and the Co–Pi/α-Fe2O3 photoanode (∼100–230 mV).11,40,41 The photocurrent stability measurements of the NiO/ZnO and ZnO photoanodes were also performed as shown in Fig. S2 (ESI†). The NiO/ZnO photoanode exhibited an improved stability compared to the bare ZnO photoanode. As to the PEC efficiency (shown in Fig. 4b), the NiO/ZnO photoanode achieved the highest efficiency of 1.81%, and it is 30 times enhancement compared to the bare ZnO photoanode (0.06%). This efficiency value is higher than the recently reported values of other ZnO based photoanodes, e.g. undoped ZnO NRs (0.02–0.08%),42,43 C-doped ZnO (0.18%),44 Zn0.96Cu0.04O (0.21%),45 N-doped ZnO (0.1–0.31%),9,42,43 Si/ZnO heterostructure (0.38%),46 Ni(OH)2/ZnO (0.43%),19 carbon nanotube modified ZnO (0.65%),47 CuO/ZnO heterostructure (0.71%),48 and Ag decorated ZnO (0.81%).49 These PEC measurement results demonstrate that the NiO electrocatalysts can largely improve the PEC performance of the conventional ZnO photoanode.
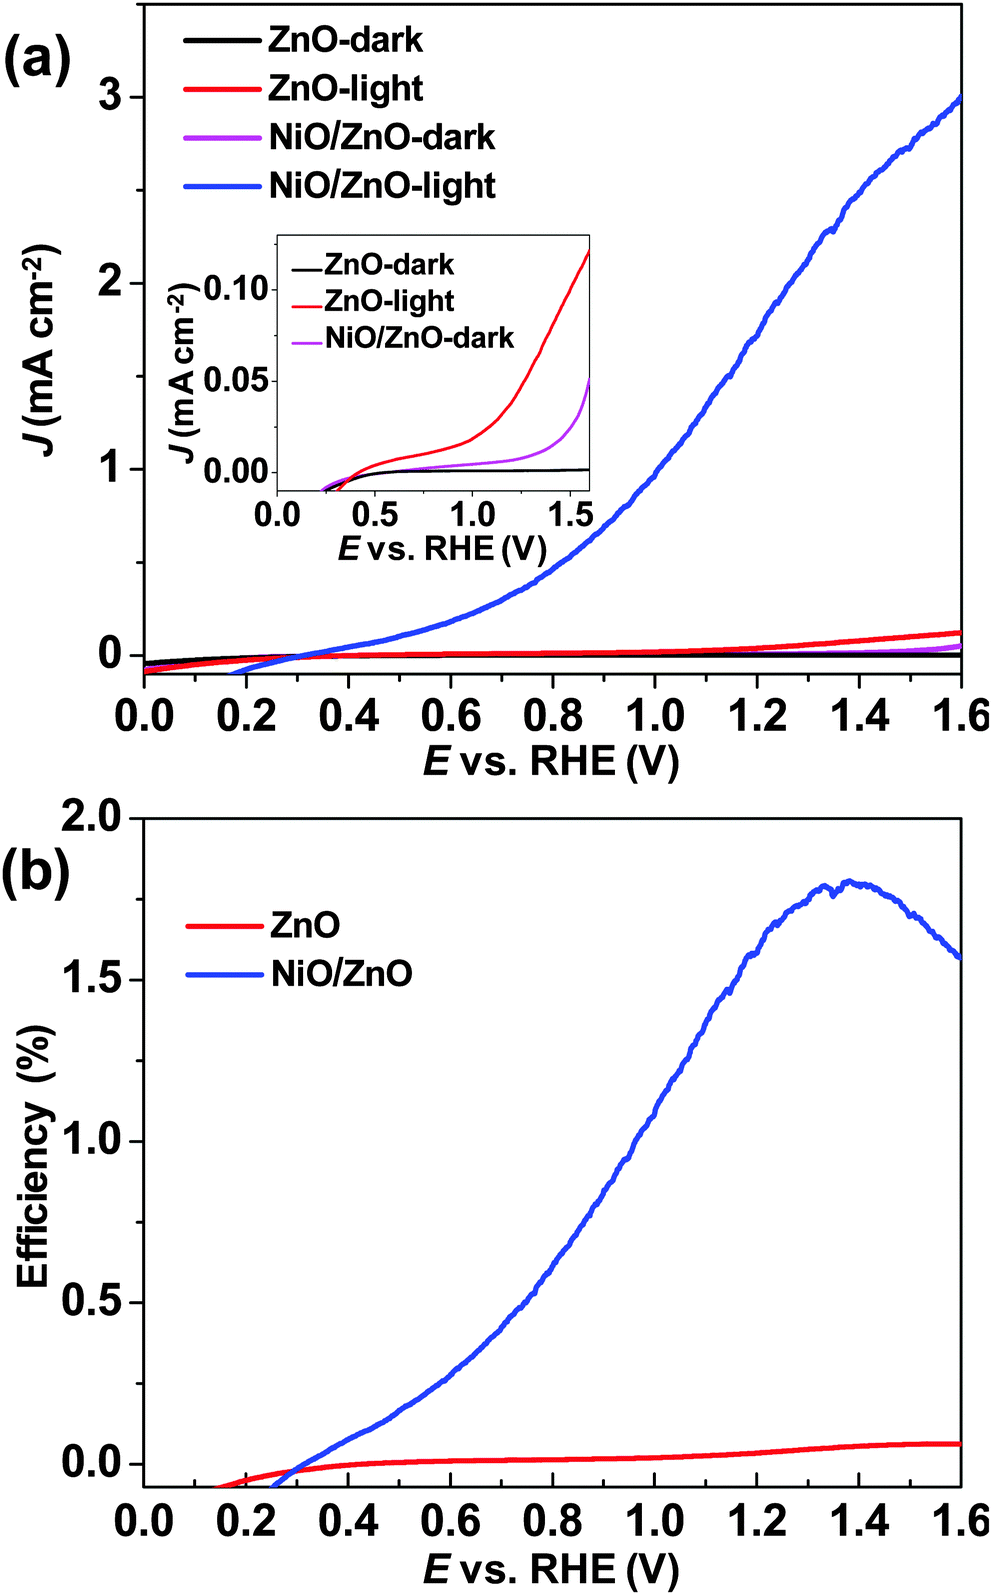 | ||
| Fig. 4 (a) J–V curves of bare ZnO NR and NiO/ZnO core–shell NR photoanodes. Inset shows the magnified dark scans of ZnO and NiO/ZnO photoanodes, and the magnified photocurrent of the ZnO photoanode. (b) The calculated conversion efficiencies as a function of the applied bias for ZnO and NiO/ZnO photoanodes. | ||
The band alignment and the enhancement mechanism of the NiO/ZnO photoanode are schematically shown in Fig. 5. The DRS results of bare ZnO, NiO/ZnO, and bare NiO are shown in Fig. S3a (ESI†). The band gap (Eg) values of NiO and ZnO were determined to be 3.5 and 3.2 eV, respectively (Fig. S3b, ESI†). Upon light irradiation, the initial electron–hole pairs can be generated in a ZnO semiconductor by absorbing photons with energy higher than its band gap. In the case of an n-type photoanode, photogenerated electrons in the conduction band (CB) of ZnO move toward the counter electrode for the reduction of water. The excited holes in the valance band (VB) of ZnO transfer to the outer NiO catalyst layer. The holes are then captured by NiO and oxidize its NiII to higher valence NiIII/NiIV. The higher valence NiIII/NiIV drives the water oxidation reaction, which will be reduced back to NiII.50,51 Introducing the NiII/NiIII/NiIV redox processes can effectively reduce the energy barrier of the water oxidation reaction, which is evidenced by the cathodic shift of onset potential in Fig. 4a. Additionally, the amorphous NiO can provide a large density of active unsaturated sites on the surface to facilitate the hole trapping, and then the direct surface recombination of electron–hole pairs is suppressed. Thus, the PEC performance of the conventional ZnO photoanode is significantly improved by introducing NiO electrocatalysts onto its surface.
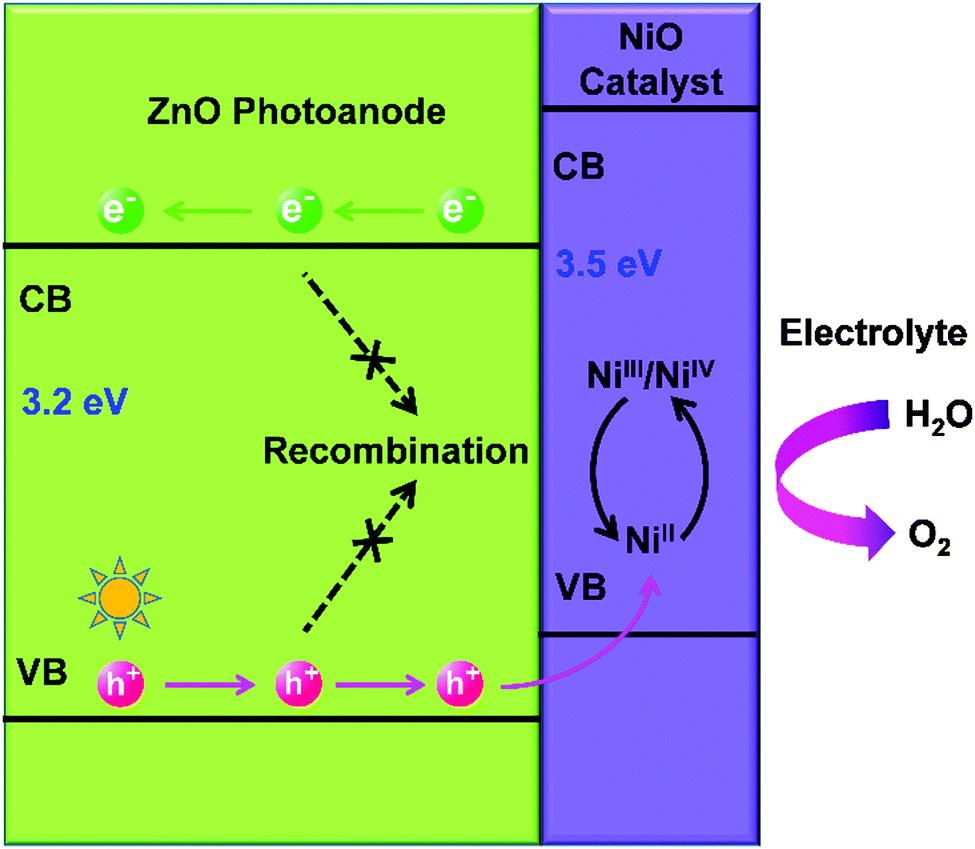 | ||
| Fig. 5 The band alignment and schematic PEC kinetic processes of the NiO/ZnO photoanode. | ||
Conclusions
In summary, we successfully demonstrated an amorphous NiO/single crystalline ZnO core–shell NR array photoanode for PEC water splitting. The single crystalline ZnO NR core served as a photon absorber and a rapid charge transporter, whilst the amorphous NiO shell acted as an electrocatalyst to promote the surface oxygen evolution reaction. A remarkable 260 mV cathodic shift in the onset potential for water oxidation was obtained from the NiO/ZnO photoanode compared to the bare ZnO photoanode. The PEC efficiency of the NiO/ZnO photoanode was found to be 1.81%, which is 30 fold enhancement than that was produced by the ZnO photoanode (0.06%). This efficiency value is also much higher than that of the Ni(OH)2/ZnO photoanode (0.43%).19 This work demonstrated that introducing amorphous NiO electrocatalysts can effectively improve the PEC performance of conventional ZnO photoanodes. It provides a promising solution to develop a high-performance PEC photoanode.Acknowledgements
E. L. thanks the financial support of the NSFC (No. 11104252, No. 11574276) and the Education Commission of China (No. 20114101110003) and the fund for Science & Technology innovation team of Zhengzhou (No. 112PCXTD337). Y. T. thanks the financial support of the NSFC (No. 21476271). Y. M. thanks the financial support of the NSFC (No. 51503185). J. W. thanks the financial support of the NSFC (No. 11504333).Notes and references
- T. W. Kim and K. S. Choi, Science, 2014, 343, 990–994 CrossRef CAS PubMed.
- F. Le Formal, E. Pastor, S. D. Tilley, C. A. Mesa, S. R. Pendlebury, M. Grätzel and J. R. Durrant, J. Am. Chem. Soc., 2015, 137, 6629–6637 CrossRef CAS PubMed.
- P. Gao, H. Ma, J. Yang, D. Wu, Y. Zhang, B. Du, D. Fan and Q. Wei, New J. Chem., 2015, 39, 1483–1487 RSC.
- Y. Su, K. Xiao, Z. Liao, Y. Zhong, N. Li, Y. Chen and Z. Liu, Int. J. Hydrogen Energy, 2013, 38, 15019–15026 CrossRef CAS.
- S. D. Tilley, M. Cornuz, K. Sivula and M. Grätzel, Angew. Chem., Int. Ed., 2010, 49, 6405–6408 CrossRef CAS PubMed.
- M. P. Dare-Edwards, J. B. Goodenough, A. Hamnett and P. R. Trevellick, J. Chem. Soc., Faraday Trans., 1983, 79, 2027–2041 RSC.
- M. Gratzel, Nature, 2001, 414, 338–344 CrossRef CAS PubMed.
- J. Shi, M. B. Starr, H. Xiang, Y. Hara, M. A. Anderson, J. Seo, Z. Ma and X. Wang, Nano Lett., 2011, 11, 5587–5593 CrossRef CAS PubMed.
- X. Y. Yang, A. Wolcott, G. M. Wang, A. Sobo, R. C. Fitzmorris, F. Qian, J. Z. Zhang and Y. Li, Nano Lett., 2009, 9, 2331–2336 CrossRef CAS PubMed.
- E. M. P. Steinmiller and K. S. Choi, Proc. Natl. Acad. Sci. U. S. A., 2009, 106, 20633–20636 CrossRef CAS PubMed.
- M. Barroso, A. J. Cowan, S. R. Pendlebury, M. Gratzel, D. R. Klug and J. R. Durrant, J. Am. Chem. Soc., 2011, 133, 14868–14871 CrossRef CAS PubMed.
- J. A. Seabold and K. S. Choi, Chem. Mater., 2011, 23, 1105–1112 CrossRef CAS.
- S. K. Pilli, T. E. Furtak, L. D. Brown, T. G. Deutsch, J. A. Turner and A. M. Herring, Energy Environ. Sci., 2011, 4, 5028–5034 CAS.
- M. Dinca, Y. Surendranath and D. G. Nocera, Proc. Natl. Acad. Sci. U. S. A., 2010, 107, 10337–10341 CrossRef CAS PubMed.
- X. Wang, H. Luo, H. Yang, P. J. Sebastian and S. A. Gamboa, Int. J. Hydrogen Energy, 2004, 29, 967–972 CrossRef CAS.
- B. S. Yeo and A. T. Bell, J. Phys. Chem. C, 2012, 116, 8394–8400 CAS.
- Y. Z. Su, Q. Z. Xu, G. F. Chen, H. Cheng, N. Li and Z. Q. Liu, Electrochim. Acta, 2015, 174, 1216–1224 CrossRef CAS.
- H. Cheng, Y. Z. Su, P. Y. Kuang, G. F. Chen and Z. Q. Liu, J. Mater. Chem. A, 2015, 3, 19314–19321 CAS.
- Y. Mao, H. Yang, J. Chen, J. Chen, Y. Tong and X. Wang, Nano Energy, 2014, 6, 10–18 CrossRef CAS.
- K. Sun, N. Park, Z. L. Sun, J. G. Zhou, J. Wang, X. L. Pang, S. H. Shen, S. Y. Noh, Y. Jing, S. H. Jin, P. K. L. Yu and D. L. Wang, Energy Environ. Sci., 2012, 5, 7872–7877 CAS.
- R. D. L. Smith, M. S. Prevot, R. D. Fagan, Z. P. Zhang, P. A. Sedach, M. K. J. Siu, S. Trudel and C. P. Berlinguette, Science, 2013, 340, 60–63 CrossRef CAS PubMed.
- E. Tsuji, A. Imanishi, K. Fukui and Y. Nakato, Electrochim. Acta, 2011, 56, 2009–2016 CrossRef CAS.
- Y. Bu, Z. Chen and W. Li, Dalton Trans., 2013, 42, 16272–16275 RSC.
- D. D. Qin and C. L. Tao, RSC Adv., 2014, 4, 16968–16972 RSC.
- H. M. Chen, C. K. Chen, Y. C. Chang, C. W. Tsai, R. S. Liu, S. F. Hu, W. S. Chang and K. H. Chen, Angew. Chem., Int. Ed., 2010, 49, 5966–5969 CrossRef CAS PubMed.
- Z. Q. Liu, X. H. Xie, Q. Z. Xu, S. H. Guo, N. Li, Y. B. Chen and Y. Z. Su, Electrochim. Acta, 2013, 98, 268–273 CrossRef CAS.
- J. Miao, H. B. Yang, S. Y. Khoo and B. Liu, Nanoscale, 2013, 5, 11118–11124 RSC.
- P. Y. Kuang, Y. Z. Su, K. Xiao, Z. Q. Liu, N. Li, H. J. Wang and J. Zhang, ACS Appl. Mater. Interfaces, 2015, 7, 16387–16394 CAS.
- Y. K. Hsu, S. Y. Fu, M. H. Chen, Y. C. Chen and Y. G. Lin, Electrochim. Acta, 2014, 120, 1–5 CrossRef CAS.
- P. Y. Kuang, Y. Z. Su, G. F. Chen, Z. Luo, S. Y. Xing, N. Li and Z. Q. Liu, Appl. Surf. Sci., 2015 DOI:10.1016/j.apsusc.2015.08.066.
- J. Xiao, X. Zhang and Y. Li, Int. J. Hydrogen Energy, 2015, 40, 9080–9087 CrossRef CAS.
- J. Jiang, X. Zhang, P. Sun and L. Zhang, J. Phys. Chem. C, 2011, 115, 20555–20564 CAS.
- P. Kuang, J. Ran, Z. Liu, H. Wang, N. Li, Y. Su, Y. Jin and S. Qiao, Chem. – Eur. J., 2015, 21, 1–10 CrossRef.
- M. Shao, F. Ning, M. Wei, D. G. Evans and X. Duan, Adv. Funct. Mater., 2014, 24, 580–586 CrossRef CAS.
- L. L. Sun, G. Wei, Y. H. Song, Z. G. Liu, L. Wang and Z. Li, Mater. Lett., 2006, 60, 1291–1295 CrossRef CAS.
- N. S. McIntyre, T. C. Chan and C. Chen, Oxid. Met., 1990, 33, 457–479 CrossRef CAS.
- D. K. Zhong, J. Sun, H. Inumaru and D. R. Gamelin, J. Am. Chem. Soc., 2009, 131, 6086–6087 CrossRef CAS PubMed.
- M. Barroso, C. A. Mesa, S. R. Pendlebury, A. J. Cowan, T. Hisatomi, K. Sivula, M. Gratzel, D. R. Klug and J. R. Durrant, Proc. Natl. Acad. Sci. U. S. A., 2012, 109, 15640–15645 CrossRef CAS PubMed.
- S. C. Riha, B. M. Klahr, E. C. Tyo, S. Seifert, S. Vajda, M. J. Pellin, T. W. Hamann and A. B. F. Martinson, ACS Nano, 2013, 7, 2396–2405 CrossRef CAS PubMed.
- D. K. Zhong, M. Cornuz, K. Sivula, M. Graetzel and D. R. Gamelin, Energy Environ. Sci., 2011, 4, 1759–1764 CAS.
- B. Klahr, S. Gimenez, F. Fabregat-Santiago, J. Bisquert and T. W. Hamann, J. Am. Chem. Soc., 2012, 134, 16693–16700 CrossRef CAS PubMed.
- Y. C. Qiu, K. Y. Yan, H. Deng and S. H. Yang, Nano Lett., 2012, 12, 407–413 CrossRef CAS PubMed.
- O. Game, U. Singh, A. A. Gupta, A. Suryawanshi, A. Banpurkar and S. Ogale, J. Mater. Chem., 2012, 22, 17302–17310 RSC.
- S. T. Kochuveedu, Y. H. Jang, Y. J. Jang and D. H. Kim, J. Mater. Chem. A, 2013, 1, 898–905 CAS.
- Y. K. Hsu and C. M. Lin, Electrochim. Acta, 2012, 74, 73–77 CrossRef CAS.
- M. Shi, X. Pan, W. Qiu, D. Zheng, M. Xu and H. Chen, Int. J. Hydrogen Energy, 2011, 36, 15153–15159 CrossRef CAS.
- Y. Wei, H. Du, J. Kong, X. Lu, L. Ke and X. W. Sun, Electrochim. Acta, 2014, 143, 188–195 CrossRef CAS.
- X. Zhao, P. Wang and B. Li, Chem. Commun., 2010, 46, 6768–6770 RSC.
- Y. F. Wei, L. Ke, J. H. Kong, H. Liu, Z. H. Jiao, X. H. Lu, H. J. Du and X. W. Sun, Nanotechnology, 2012, 23, 235401 CrossRef PubMed.
- M. Pourbaix and N. D. Zoubov, Atlas d'équilibres électrochimiques, Gauthier-Villars, Paris, 1963 Search PubMed.
- K. Juodkazis, J. Juodkazyte, R. Vilkauskaite and V. Jasulaitiene, J. Solid State Electrochem., 2008, 12, 1469–1479 CrossRef CAS.
Footnote |
| † Electronic supplementary information (ESI) available: Method section, TEM results, photocurrent stability performance, the calculation process of the PEC conversion efficiency, DRS spectra, and the summary of performance parameters. See DOI: 10.1039/c5nj01815c |
| This journal is © The Royal Society of Chemistry and the Centre National de la Recherche Scientifique 2016 |