Nanoscale adhesion forces between the fungal pathogen Candida albicans and macrophages
Sofiane
El-Kirat-Chatel
and
Yves F.
Dufrêne
*
Institute of Life Sciences, Université catholique de Louvain, Croix du Sud 4-5, bte L7.07.06, 1348 Louvain-la-Neuve, Belgium. E-mail: yves.dufrene@uclouvain.be
First published on 1st October 2015
Abstract
The development of fungal infections is tightly controlled by the interaction of fungal pathogens with host immune cells. While the recognition of specific fungal cell wall components by immune receptors has been widely investigated, the molecular forces involved are not known. In this Communication, we show the ability of single-cell force spectroscopy to quantify the specific adhesion forces between the fungal pathogen Candida albicans and macrophages. The Candida–macrophage adhesion force is strong, up to ∼3000 pN, and corresponds to multiple cumulative bonds between lectin receptors expressed on the macrophage membrane and mannan carbohydrates on the fungal cell surface. Adhesion force signatures show constant force plateaus, up to >100 μm long, reflecting the extraction of elongated tethers from the macrophage membrane, a phenomenon which may increase the duration of intercellular adhesion. Adhesion strengthens with time, suggesting that the macrophage membrane engulfs the pathogen quickly after initial contact, leading to its internalization. The force nanoscopy method developed here holds great promise for understanding and controlling the early stages of microbe–immune interactions.
Conceptual insightsLive-cell nanoscopy has recently offered unprecedented opportunities for analyzing living cells to molecular resolution, providing novel insights into cellular functions. Yet, implementation of nanoscopy assays for measuring the nanoscale interactions between pathogens and host immune cells has not been reported. Such methods would contribute to the enhancement of our understanding of microbial infections, and may help modulating immune responses for therapy. Here we establish atomic force microscopy as a nanoscopy platform for quantifying the forces between the medically-important fungal pathogen Candida albicans and macrophages, a major class of immune cells. We found that fungal-macrophage adhesion is strong and primarily involves multiple specific molecular bonds between lectin receptors on the macrophage membrane and mannan carbohydrates on the fungal cell surface. Our force nanoscopy assay will find broad application in nanomedicine for studying the interactions between microbial pathogens (fungi, bacteria) and various types of immune cells (macrophages, monocytes, neutrophils and dendritic cells). |
Introduction
Candida albicans is a major opportunistic fungal pathogen infecting patients with impaired immune systems.1–3 Host defense against C. albicans infections relies primarily on recognition, internalization and destruction of the fungus by host immune cells such as macrophages and neutrophils.4–8 To be efficient, immune cells need to recognize and sense the pathogen,9 through mechanisms that remain poorly understood. Recognition involves the interaction between immune “pattern recognition receptors” (PRRs), composed of Toll-like receptors, C-type lectin receptors and galectin family proteins, and fungal cell wall components named “pathogen associated molecular patterns” (PAMPs).4,5,10–12 The major cell wall glycans recognized by immune receptors are β-glucans and chitin from the inner layer, and mannans from the outermost layer. Mannans are chains of mannosides O- or N-linked to proteins that are believed to play a major role in immune detection as they are the most exposed and most abundant carbohydrates of the cell wall.13–21 While the specific receptors and ligands involved in the recognition of fungi by immune cells are well-characterized,4,12 the molecular forces involved are not known. Also, we know little about the relative contribution of the different binding partners to intercellular adhesion, e.g. whether mannan–lectin bonds represent the primary driving force.Recently, there have been remarkable advances in our use of atomic force microscopy (AFM)-based single-cell force spectroscopy (SCFS) to probe the forces driving cell–cell and cell–solid interactions.22–28 Yet, the method has not been implemented to study pathogen–immune interactions. Here, we show the ability of SCFS for measuring the adhesive forces between C. albicans and macrophages, thereby shedding new light into fungal–host intercellular adhesion.
Results and discussion
Nanoscale imaging of the initial adhesion between Candida and macrophages
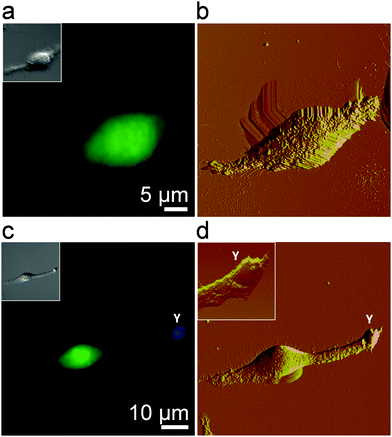
We first visualized the initial step of the C. albicans–macrophage interaction at the nanoscale by correlative fluorescence-AFM imaging. To obtain high-resolution images of macrophages, cells were chemically-fixed with a protocol known to enhance image quality and preserve morphological features.29,30Fig. 1a and b show an uninfected macrophage fluorescently stained (green) and the correlative AFM contact-mode image. While the optical image shows the general morphology of the cell, AFM captures the fine structure of the cell surface. Structural details typical of macrophages were observed, i.e., ruffles covering the cell body and elongated lamellipodia.30–32 To image the early stage of infection, macrophages were infected and then chemically fixed after 30 min. Correlative microscopy revealed yeast cells (in blue) in tight contact with long lamellipodia extended from the macrophages (Fig. 1c and d). High-resolution AFM analysis of the area containing the yeast cell revealed ongoing pathogen internalization with the smooth yeast surface partially covered by macrophage membrane extensions (Fig. 1d, inset). This early stage is critical for further phagocytosis and immune response activation. Starting from here, we sought to determine the specific forces involved in Candida–macrophage intercellular adhesion.Forces involved in Candida–macrophage adhesion
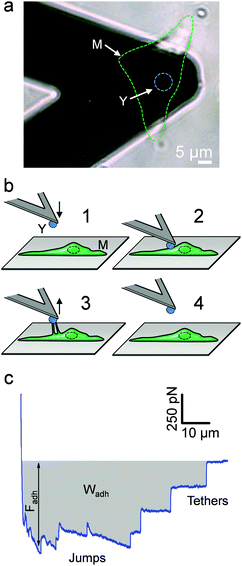
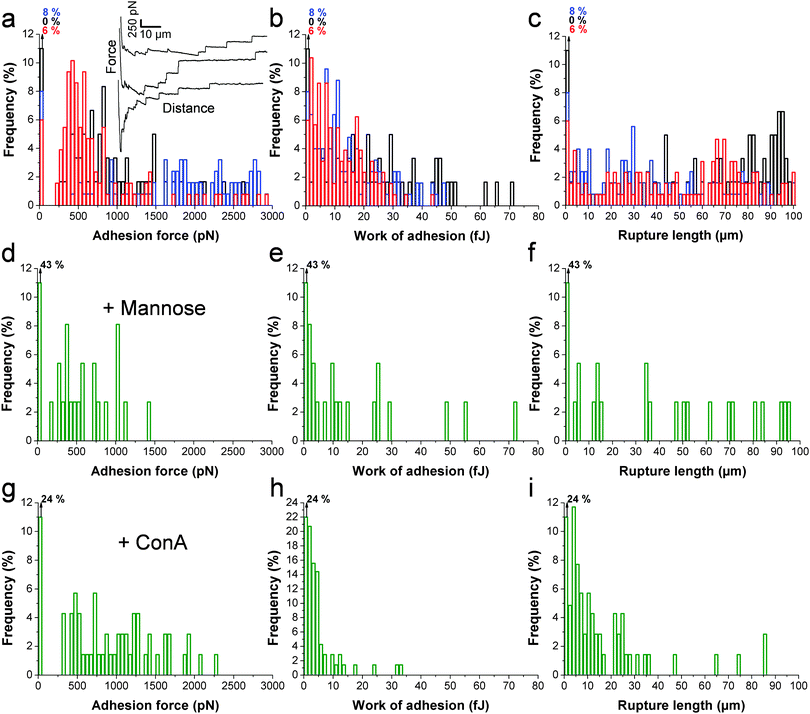
The principle of the SCFS assay is depicted in Fig. 2. Living fungal cells were attached to tipless cantilevers coated with polydopamine.33–36 The obtained fungal cell probes were brought into contact with a macrophage membrane for a given period of time to allow for adhesion (Fig. 2a and b). The probes were then retracted at constant speed until the rupture of all adhesive bonds (Fig. 2b). Force–distance curves were recorded during constant approach and retraction of the yeast to the macrophage membrane. Fig. 2c shows a typical force–distance signature obtained upon separating C. albicans–macrophage interacting cells. Features typical of mammalian cells were observed.22,24 The maximum adhesion force (Fadh), generally occurring at a short distance, represents the rupture of specific and unspecific cell–cell interactions.24,37 This large adhesion was followed by two types of unbinding events, i.e., jumps that represent rupture of individual or multiple intermolecular bounds and tethers that correspond to long-range lipid membrane extensions.24,38,39 We note that tether lengths were sometimes larger than 100 μm, emphasizing the need of an extended z-range scanner not available on conventional AFMs to capture these events. The area under the curve can be calculated from the retraction curve to assess the energy or work of adhesion (Wadh) associated with the yeast–macrophage interaction.34 Shown in Fig. 3a–c are the adhesion force, work of adhesion and rupture length histograms as well as representative force curves obtained for three different C. albicans–macrophage pairs after 10 s contact time. Most force curves (92–100%) showed large adhesion peaks (250–3000 pN) followed by multiple jumps and long-range tethers (from 2 μm to >100 μm). The observed variability reflects both cell-to-cell differences and subcellular heterogeneity as the curves were recorded across 5 μm × 5 μm areas of the macrophage surface. The corresponding work involved in these interactions ranged from 2 to 50 fJ. It is worth noting that while yeast cells are much smaller than mammalian cells, the work of adhesion estimated here is in the range of that described between animal cells,24,40,41 suggesting that multiple biomolecular bonds are involved and that the intercellular contact area is large due to the deformable macrophage membrane. Supporting this notion, the work of adhesion is up to 1000 times larger than that measured between two rigid C. albicans cells.34 This suggests that the soft macrophage membrane partly covers the fungal cell surface, leading to enhanced adhesion. Deformability of the macrophage membrane was also evident from constant force plateaus, with a length reaching 100 μm, seen in most curves, and attributed to the extraction of membrane tethers.42,43 The lifetime of the bond is given by the tether length divided by the tip velocity. Therefore, the formation of membrane tethers between pathogens and host cells may increase the duration of intercellular adhesion, a phenomenon which could be important for fungal pathogenesis.Since mannans are the most abundant carbohydrates in the C. albicans cell wall and are believed to be important ligands for macrophage receptors, we performed two experiments to test this hypothesis (Fig. 3d–i). Soluble mannoside was injected in the AFM chamber with the aim to block the mannose receptors of macrophages. We observed a substantial decrease of adhesion frequency (57%) together with a decrease of the adhesion force (250–1000 pN) and work of adhesion (2–25 fJ) (Fig. 3d–f). The lectin Concanavalin A (ConA) was also added in order to block the mannoside residues of the fungal cells. Here again, the lectin decreased the adhesion frequency (76%), the adhesion force (250–2000 pN) and the work of adhesion (2–20 fJ) (Fig. 3g–ivs.Fig. 3a–c). These observations lead us to conclude that mannose–lectin bonds represent the primary driving force for C. albicans–macrophage adhesion. As the strength of single molecular bonds between lectins and mannose residues is on the order of 100 pN,35 we speculate that the 3000 pN force corresponds to about 30 bonds loaded in parallel.
Candida–macrophage adhesion strengthens with time
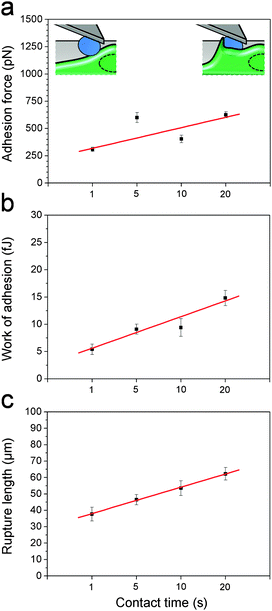
After initial contact, the macrophage membrane usually engulfs C. albicans until complete phagocytosis. Thus, we postulated that fungal–host adhesion should increase with interaction time. Fig. 4 shows the mean adhesion force, work of adhesion and rupture length recorded at 1 s, 5 s, 10 s and 20 s contact time. As can be seen, the three parameters increased with the contact time, suggesting that the macrophage membrane may start to cover the cell to form a so-called “phagocytic cup” rapidly after initial contact, thus increasing the contact area. Note that the time-dependency could also mean that more and more receptors are engaged in the interaction with time.24,26Conclusions
Quantifying the molecular forces between fungal pathogens and immune cells is an important challenge for elucidating the molecular basis of fungal pathogenesis, and may help modulating immune responses for therapy. We have shown that AFM is a valuable tool for measuring the forces engaged in the specific recognition between C. albicans and immune receptors. While there have been a few AFM studies so far dealing with immune cells,29,30,32,44,45 this is the first report describing the use of the technique to quantify microbe–immune interactions. C. albicans–macrophage adhesion forces are strong (up to 3000 pN, work of adhesion of 50 fJ) and are primarily mediated by multiple specific bonds between macrophage receptors and mannans on the fungal cell surface. Long-range macrophage tethers (up to 100 μm long) are observed upon cell–cell detachment, which could be critical for increasing the duration of the pathogen–host contact. Fungal–macrophage adhesion strengthens with time, suggesting the macrophage membrane may start to cover the cell rapidly after initial contact, leading to internalization. In future work, it would be interesting to determine the extent to which other cell wall glycans, i.e. β-glucans and chitin, contribute to C. albicans–macrophage adhesion.Methods
Strain, media, and growth conditions
The Candida albicans CAI4 wild type strain was grown in standard YPD (1% yeast extract, 2% bactopeptone, 2% glucose). The murine macrophage cell line J774A.1 (ATCC TIB-67) was cultured in DMEM (Gibco) containing 10% decomplemented fetal bovine serum (FBS, Gibco), 1 mM sodium pyruvate, 50 U mL−1 penicillin-G and 50 μg mL−1 streptomycin, at 37 °C in 5% CO2.Correlative fluorescence-atomic force microscopy
Macrophages were infected by adding 1 × 10⁶C. albicans cells from the stationary growth phase to 1 × 10⁶ macrophages platted 16 h before in a Petri dish (TPP, tissue culture dish 40). The cell mixture was incubated at 37 °C in 5% CO2 for 30 min. Non-infected macrophage experiments were performed by treating macrophages under the same conditions but without adding yeast cells. For yeast fluorescence staining, we used 5 μg mL−1 of Calcofluor White (CFW blue, excitation 350 nm and emission 460 nm, Sigma). For staining of live macrophages, 10 μM of carboxyfluorescein succinimidyl ester (CFSE green, excitation 492 nm and emission 517 nm, Molecular Probes) were added following the supplier recommendations. For cell fixation, 0.5% of glutaraldehyde (Sigma) was added into the medium and fixation was achieved during 1 h at 37 °C in 5% CO2 before changing the fixation medium with PBS buffer. Correlative microscopy images were acquired using a Bioscope Catalyst AFM (Bruker Corporation, Santa Barbara, CA), equipped with an optical microscope (Zeiss Axio Observer Z1) and a Hamamatsu camera C10600. AFM contact mode images were obtained using MLCT cantilevers (nominal spring constant 0.01 N m−1, Bruker, Santa Barbara, CA) with an applied force of 500 pN.Single-cell force spectroscopy
Macrophages (1 × 10⁶) were platted in Petri dishes 16 h before experiments. Before single-cell measurements, the medium was replaced by completed DMEM without phenol red and with Hepes buffer, and 1 × 10⁵ yeast cells from the stationary growth phase were added. Yeast cell probes were prepared using triangular shaped tipless cantilevers (NP-O10, Microlevers, Bruker Corporation) coated with bioinspired polydopamine wet adhesives.35,46 To this end, cantilevers were immersed for 1 h in a 10 mM Tris buffer solution (pH 8.5) containing 4 mg mL−1 dopamine hydrochloride (99%, Sigma), and dried with N2 flow. Single yeast cells deposited in the Petri dish containing live macrophages were then attached onto the polydopamine-coated cantilevers using a Nanowizard III AFM (JPK Instruments). The cantilever was brought into contact with an isolated cell for 3 min, and the obtained cell probe was then transferred over a macrophage. Force measurements were performed at room temperature (20 °C) in a medium using a Nanowizard III AFM equipped with the CellHesion module (JPK Instruments). The nominal spring constant of the cantilever was ∼0.12 N m−1, as determined by the thermal noise method. Unless stated otherwise, multiple force–distance curves were recorded across 5 μm × 5 μm areas of the macrophages using a maximum applied force of 500 pN, an interaction time of 10 s, and constant approach and retraction speeds of 5000 nm s−1. For blocking experiments, 200 mM of free methyl, α-D-mannopyranoside or 0.3 mg mL−1 of free Concanavalin A (ConA) were added. Adhesion force, work of adhesion and rupture length histograms were obtained by calculating for each force curve the maximum adhesion peak, the area under the curve and the last rupture distance, respectively.Conflict of interest
The authors declare no competing financial interest.Acknowledgements
Work at the Université catholique de Louvain was supported by the National Fund for Scientific Research (FNRS), the Université catholique de Louvain (Fonds Spéciaux de Recherche), the Federal Office for Scientific, Technical and Cultural Affairs (Interuniversity Poles of Attraction Programme), and the Research Department of the Communauté française de Belgique (Concerted Research Action). Y.F.D. is a Research Director of the FNRS.References
- M. A. Pfaller and D. J. Diekema, Clin. Microbiol. Rev., 2007, 20, 133 CrossRef CAS PubMed.
- C. d'Enfert, Curr. Opin. Microbiol., 2009, 12, 358 CrossRef PubMed.
- G. D. Brown, D. W. Denning, N. A. Gow, S. M. Levitz, M. G. Netea and T. C. White, Sci. Transl. Med., 2012, 4, 165rv13 Search PubMed.
- M. G. Netea, G. D. Brown, B. J. Kullberg and N. A. Gow, Nat. Rev. Microbiol., 2008, 6, 67 CrossRef CAS PubMed.
- T. Jouault, A. Sarazin, M. Martinez-Esparza, C. Fradin, B. Sendid and D. Poulain, Cell. Microbiol., 2009, 11, 1007 CrossRef CAS PubMed.
- C. Bourgeois, O. Majer, I. E. Frohner, L. Tierney and K. Kuchler, Curr. Opin. Microbiol., 2010, 13, 401 CrossRef CAS PubMed.
- K. Seider, A. Heyken, A. Luttich, P. Miramon and B. Hube, Curr. Opin. Microbiol., 2010, 13, 392 CrossRef CAS PubMed.
- N. A. Gow and B. Hube, Curr. Opin. Microbiol., 2012, 15, 406 CrossRef CAS PubMed.
- N. A. Gow, F. L. van de Veerdonk, A. J. Brown and M. G. Netea, Nat. Rev. Microbiol., 2012, 10, 112 CAS.
- L. Romani, Nat. Rev. Immunol., 2004, 4, 1 CrossRef PubMed.
- M. G. Netea, N. A. Gow, C. A. Munro, S. Bates, C. Collins, G. Ferwerda, R. P. Hobson, G. Bertram, H. B. Hughes, T. Jansen, L. Jacobs, E. T. Buurman, K. Gijzen, D. L. Williams, R. Torensma, A. McKinnon, D. M. MacCallum, F. C. Odds, J. W. Van der Meer, A. J. Brown and B. J. Kullberg, J. Clin. Invest., 2006, 116, 1642 CrossRef CAS PubMed.
- S. C. Cheng, L. A. Joosten, B. J. Kullberg and M. G. Netea, Infect. Immun., 2012, 80, 1304 CrossRef CAS PubMed.
- J. Masuoka, Clin. Microbiol. Rev., 2004, 17, 281 CrossRef CAS.
- S. Keppler-Ross, L. Douglas, J. B. Konopka and N. Dean, Eukaryotic Cell, 2010, 9, 1776 CrossRef CAS PubMed.
- C. G. McKenzie, U. Koser, L. E. Lewis, J. M. Bain, H. M. Mora-Montes, R. N. Barker, N. A. Gow and L. P. Erwig, Infect. Immun., 2010, 78, 1650 CrossRef CAS PubMed.
- H. M. Mora-Montes, S. Bates, M. G. Netea, L. Castillo, A. Brand, E. T. Buurman, D. F. Diaz-Jimenez, B. Jan Kullberg, A. J. Brown, F. C. Odds and N. A. Gow, J. Biol. Chem., 2010, 285, 12087 CrossRef CAS PubMed.
- U. Gazi, M. Rosas, S. Singh, S. Heinsbroek, I. Haq, S. Johnson, G. D. Brown, D. L. Williams, P. R. Taylor and L. Martinez-Pomares, J. Biol. Chem., 2011, 286, 7822 CrossRef CAS PubMed.
- M. Martinez-Esparza, A. Tapia-Abellan, A. Vitse-Standaert, P. Garcia-Penarrubia, J. C. Arguelles, D. Poulain and T. Jouault, Glycobiology, 2011, 21, 796 CrossRef CAS PubMed.
- S. El-Kirat-Chatel, A. Beaussart, D. Alsteens, A. Sarazin, T. Jouault and Y. F. Dufrene, Nanoscale, 2013, 5, 4855 RSC.
- R. A. Hall and N. A. Gow, Mol. Microbiol., 2013, 90, 1147 CrossRef CAS PubMed.
- J. Te Riet, I. Reinieren-Beeren, C. G. Figdor and A. Cambi, J. Mol. Recognit., 2015 DOI:10.1002/jmr.2481.
- M. Benoit, D. Gabriel, G. Gerisch and H. E. Gaub, Nat. Cell Biol., 2000, 2, 313 CrossRef CAS PubMed.
- M. Benoit and H. E. Gaub, Cells Tissues Organs, 2002, 172, 174 CrossRef CAS PubMed.
- J. Helenius, C. P. Heisenberg, H. E. Gaub and D. J. Muller, J. Cell Sci., 2008, 121, 1785 CrossRef CAS PubMed.
- D. J. Muller, J. Helenius, D. Alsteens and Y. F. Dufrene, Nat. Chem. Biol., 2009, 5, 383 CrossRef PubMed.
- J. Friedrichs, J. Helenius and D. J. Muller, Nat. Protoc., 2010, 5, 1353 CrossRef CAS PubMed.
- D. J. Müller and Y. F. Dufrêne, Trends Cell Biol., 2011, 21, 461 CrossRef PubMed.
- D. J. Müller and Y. F. Dufrêne, Curr. Biol., 2011, 21, R212 CrossRef PubMed.
- S. F. Ahmad, L. A. Chtcheglova, B. Mayer, S. A. Kuznetsov and P. Hinterdorfer, Anal. Bioanal. Chem., 2011, 399, 2359 CrossRef CAS PubMed.
- S. El-Kirat-Chatel and Y. F. Dufrene, ACS Nano, 2012, 6, 10792 CAS.
- R. Buccione, J. D. Orth and M. A. McNiven, Nat. Rev. Mol. Cell Biol., 2004, 5, 647 CrossRef CAS PubMed.
- A. Labernadie, C. Thibault, C. Vieu, I. Maridonneau-Parini and G. M. Charriere, Proc. Natl. Acad. Sci. U. S. A., 2010, 107, 21016 CrossRef CAS PubMed.
- D. Alsteens, A. Beaussart, S. Derclaye, S. El-Kirat-Chatel, H. R. Park, P. N. Lipke and Y. F. Dufrene, Anal. Methods, 2013, 5, 3657 RSC.
- D. Alsteens, P. Van Dijck, P. N. Lipke and Y. F. Dufrene, Langmuir, 2013, 29, 13473 CrossRef CAS PubMed.
- S. El-Kirat-Chatel, A. Beaussart, S. P. Vincent, M. Abellan Flos, P. Hols, P. N. Lipke and Y. F. Dufrene, Nanoscale, 2015, 7, 1760 RSC.
- S. El-Kirat-Chatel, A. Beaussart, S. Derclaye, D. Alsteens, S. Kucharikova, P. Van Dijck and Y. F. Dufrene, ACS Nano, 2015, 9, 1648 CrossRef CAS PubMed.
- L. Dao, U. Weiland, M. Hauser, I. Nazarenko, H. Kalt, M. Bastmeyer and C. M. Franz, Exp. Cell Res., 2012, 318, 2155 CrossRef CAS PubMed.
- M. P. Sheetz, Nat. Rev. Mol. Cell Biol., 2001, 2, 392 CrossRef CAS PubMed.
- E. A. Evans and D. A. Calderwood, Science, 2007, 316, 1148 CrossRef CAS PubMed.
- L. Andolfi, E. Bourkoula, E. Migliorini, A. Palma, A. Pucer, M. Skrap, G. Scoles, A. P. Beltrami, D. Cesselli and M. Lazzarino, PLoS One, 2014, 9, e112582 Search PubMed.
- R. Schubert, N. Strohmeyer, M. Bharadwaj, S. P. Ramanathan, M. Krieg, J. Friedrichs, C. M. Franz and D. J. Muller, FEBS Lett., 2014, 588, 3639 CrossRef CAS PubMed.
- M. Sun, J. S. Graham, B. Hegedus, F. Marga, Y. Zhang, G. Forgacs and M. Grandbois, Biophys. J., 2005, 89, 4320 CrossRef CAS PubMed.
- M. Krieg, J. Helenius, C. P. Heisenberg and D. J. Muller, Angew. Chem., Int. Ed. Engl., 2008, 47, 9775 CrossRef CAS PubMed.
- L. A. Chtcheglova and P. Hinterdorfer, Methods Mol. Biol., 2013, 950, 359 CAS.
- C. Roduit, G. Longo, I. Benmessaoud, A. Volterra, B. Saha, G. Dietler and S. Kasas, J. Mol. Recognit., 2012, 25, 241 CrossRef CAS PubMed.
- A. Beaussart, S. El-Kirat-Chatel, R. M. Sullan, D. Alsteens, P. Herman, S. Derclaye and Y. F. Dufrene, Nat. Protoc., 2014, 9, 1049 CrossRef CAS PubMed.
| This journal is © The Royal Society of Chemistry 2016 |


