 Open Access Article
Creative Commons Attribution 3.0 Unported Licence
Synthesis of novel 2-d carbon materials: sp2 carbon nanoribbon packing to form well-defined nanosheets†
Xiaofeng
Liu‡
a,
Nina
Fechler
a,
Markus
Antonietti
*a,
Marc Georg
Willinger
b and
Robert
Schlögl
b
aMPI of Colloids and Interfaces, Department of Colloid Chemistry, Research Campus Golm, D–14424 Potsdam, Germany. E-mail: antonietti@mpikg.mpg.de
bFritz Haber Institute of the Max Planck Society, Department of Inorganic Chemistry, Faradayweg 4–6, D–14195 Berlin, Germany
First published on 25th February 2016
Abstract
The conversion of simple glucose in a salt flux results in functional carbon materials which contain larger quantities of N and S as dopants. This “salt and sugar” approach gives access to a new type of mesostructure, where single carbon ribbons terminated with oxygen and sulfur or nitrogen functionalities are “knitted” towards very homogeneous, about 10 nm thick layers with very large specific surface areas of up to 3200 m2 g−1. Aberration corrected high resolution TEM together with EELS reveals the details of this structure.
Conceptual insights2d-nanomaterials are a recent, important addition to their 3d counterparts and are presumably responsible for the most significant practical progress in the nanoworld. For carbons, it is generally thought that “graphene” is the only 2d-version. The generation of in-plane porosity (and its lining with heteroatoms) within sp2 carbon materials is another valuable target for efficient materials synthesis. In particular nitrogen-doped nanocarbons turned out to be a material family as such, as they offer unprecedented stability, electronic conductivity, and (electro)catalytic activities. In this communication, we illustrate a novel 2d carbon nanostructure with higher specific surface area, controlled porosity, and high heteroatom functionality. In addition, this material can be simply made by heating glucose in ordinary salt fluxes, and a scalable and comparatively low-tech process. This communication focusses on the use of high end electron microscopy techniques to depict the perfection and beauty of such structures. |
Introduction
Carbon, abundant and the element with richest structural flexibility, has been extensively exploited for new functions that are not covered by the known allotropes of graphite or diamond.1–3 These new functions generally rely on the generation of low-dimensional nanostructures and the doping with foreign atoms.4–6 The generation of porosity (and its lining with heteroatoms) within the sp2 carbon materials is another valuable target for the development of efficient synthetic routes towards such functional carbon nanostructures.7–9 In particular, a nitrogen-doped version of nanocarbon turned out to be a material family as such, with unprecedented stability, electronic conductivity, and electrocatalytic activities (see, for instance ref. 10 or 11).Recently a simple process for the conversion of carbohydrates into functional carbon materials in molten salts or salt fluxes was developed.12,13 In a moderate version of black powder chemistry,14,15 controlled amounts of oxygen containing anions, such as LiNO3, were added to control redox conditions in the salt melts. The liquid reaction medium and the moderate oxidation of less stable carbon products allowed us to obtain diverse well defined morphologies: either highly porous N-doped carbon scaffolds containing C–N–C bonds, or at higher dilutions (depending on the salt system, below 1–20 wt% monomer concentration) carbon sheets with a constant thickness in the nanometer range and very high sp2-carbon content could be produced in high yields. The process could be readily extended to the preparation of S-doped carbon by simply replacing the nitrate salts with sulfur-based salts, such as K2SO4 or Na2S2O3. Again, sheet-like structures of high homogeneity were obtained. The “problem” within the analysis of these carbons was apparently contradictious characterization data: on the one hand sheet-like structures with constant nano-thickness over many micrometer lateral extension were observed, as clearly proven not only by low resolution TEM, SEM, but also AFM. On the other hand, the sheets at the same time possessed a very high surface area and microporosity, much higher than that calculated from an outer, stack-of-graphene like geometry. In addition, the content of foreign elements was so high that these foreign atoms could not been accommodated within graphene planes, and XPS in addition taught that both sulfur and nitrogen atoms were mostly at edge positions. All this came with a superior electrochemical performance, well ahead of the most ordinary graphene materials, as for instance substantiated in ref. 16.
It is the intention of the present communication to resolve this apparent contradiction and to analyze the local structure of those carbons more carefully using advanced TEM techniques. As a result, a novel, apparently general carbon nanoarchitecture could be identified, which essentially can be described as a very flat block of graphene ribbons, similar to a Ramen noodle block.
Results and discussion
In the present series of experiments the deep eutectic mixture in the LiCl/KCl system with a melting point of 353 °C was used as the liquid flux media to react with a diluted mixture of LiNO3 and glucose (in 1![[thin space (1/6-em)]](https://www.rsc.org/images/entities/char_2009.gif) :
:![[thin space (1/6-em)]](https://www.rsc.org/images/entities/char_2009.gif) 1 mass ratio). Starting from a dilution of overall reactants to salt of 1
1 mass ratio). Starting from a dilution of overall reactants to salt of 1![[thin space (1/6-em)]](https://www.rsc.org/images/entities/char_2009.gif) :
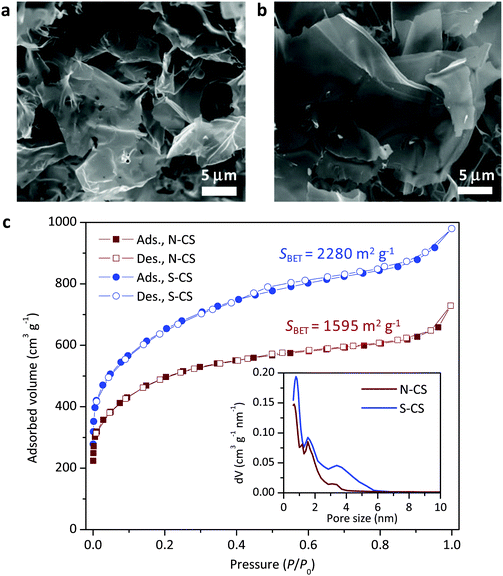
:![[thin space (1/6-em)]](https://www.rsc.org/images/entities/char_2009.gif) 5 (in mass), the explosive runaway of the reaction is effectively prevented,17 allowing the capture of the reaction products at different temperatures and reaction times. After the reaction the salt was removed by washing the sample with water, leaving only a black product: the rather pure, modified carbon. The samples were first analyzed using SEM, and the very typical layered structures with large lateral extension and homogenous thickness were found (Fig. 1a). Nitrogen sorption indicates a highly porous character of those close-to-perfect sheets: the specific surface area (SSA) increases with reaction temperature up to 900 °C to 1815 m2 g−1 and then slightly decreases. The increase in SSA is in line with the increase in pore volume, which is interestingly dominated by micropores (pore size < 2 nm) for all the examined samples, as shown in Fig. 1c. Along with the increase of the reaction temperature, the peaks in the pore size distribution also shift towards larger sizes. This process is the result of the rearrangement of small pores and the formation of mesopores with larger sizes and thicker walls, an effect already observed for carbonization of other precursors under different conditions.18,19 Behind this process is the minimization of surface energy that drives the structure to evolve towards more condensed graphitic carbon. Considering the thickness measurements reported below, a 10 nm graphene multistack would have a theoretical specific surface area of around 80 m2 g−1, and the sorption isotherms would look different and be dominated by surface porosity. This clearly means that the carbon layers as such, in spite of their apparent planarity, must be highly porous. Already at this stage, we can regard minor differences between N-doped and S-doped carbon sheets: the structures are definitely similar, but S-doped carbon sheets are thicker, and similar micropores (see inset Fig. 1) percolate towards small mesopores and add up to an overall 35% higher pore volume.
5 (in mass), the explosive runaway of the reaction is effectively prevented,17 allowing the capture of the reaction products at different temperatures and reaction times. After the reaction the salt was removed by washing the sample with water, leaving only a black product: the rather pure, modified carbon. The samples were first analyzed using SEM, and the very typical layered structures with large lateral extension and homogenous thickness were found (Fig. 1a). Nitrogen sorption indicates a highly porous character of those close-to-perfect sheets: the specific surface area (SSA) increases with reaction temperature up to 900 °C to 1815 m2 g−1 and then slightly decreases. The increase in SSA is in line with the increase in pore volume, which is interestingly dominated by micropores (pore size < 2 nm) for all the examined samples, as shown in Fig. 1c. Along with the increase of the reaction temperature, the peaks in the pore size distribution also shift towards larger sizes. This process is the result of the rearrangement of small pores and the formation of mesopores with larger sizes and thicker walls, an effect already observed for carbonization of other precursors under different conditions.18,19 Behind this process is the minimization of surface energy that drives the structure to evolve towards more condensed graphitic carbon. Considering the thickness measurements reported below, a 10 nm graphene multistack would have a theoretical specific surface area of around 80 m2 g−1, and the sorption isotherms would look different and be dominated by surface porosity. This clearly means that the carbon layers as such, in spite of their apparent planarity, must be highly porous. Already at this stage, we can regard minor differences between N-doped and S-doped carbon sheets: the structures are definitely similar, but S-doped carbon sheets are thicker, and similar micropores (see inset Fig. 1) percolate towards small mesopores and add up to an overall 35% higher pore volume.
As revealed by elemental analysis (Table 1), the samples mainly contain C, but also O, and N or S. It is an expected outcome that O constitutes the main termination surface functionality (say as alcohol or carbonyl groups) of porous carbon by oxidation with different oxidants, including nitrates.20,21 The doping of N into carbon from this process even at levels of only 2.8% was unexpected, especially because the nitrogen was not oxidized, but transferred to structural nitrogen bound only to carbon atoms.13 The homogeneity of the element distribution was also checked by EDX (data not shown), and the distribution was homogeneous within the instrumental resolution.
| Sample name | Composition (wt%) | Structure information | ||||
|---|---|---|---|---|---|---|
| C | O | N or S | SSA (m3 g−1) | D 70 (nm) | V pore (cm3 g−1) | |
| a Pore with size less than D70 contribute to 70% of the total pore volume. b Total volume per cubic centimeter contributed from pores with size below 20 nm. | ||||||
| N-CS | 90 | 7.0 | 2.8 | 1595 | 1.95 | 0.91 |
| S-CS | 91 | 4.1 | 4.3 | 2280 | 2.10 | 1.26 |
In the second set of experiments, nitrate ions were replaced by thiosulfate (S2O32−). Again, very well developed sheet like structures can be observed (Fig. 1b), and higher concentrations of S in the materials can be detected (Table 1). Sulfur contents of 4.3% at those carbonization temperatures can be regarded as “unusually high”22,23 and speak for extremely stable incorporation motifs. The maximum SSA goes in this case up to 3230 m2 g−1,13 which is even exceeding a hypothetical single layer graphene material (around 2600 m2 g−1). In the previous papers it was described that carbon – on the base of Lux–Flood redox potentials – can reduce p-block elements (like S and N), while the local structure incorporating these heteroatoms remain to be revealed.24,25
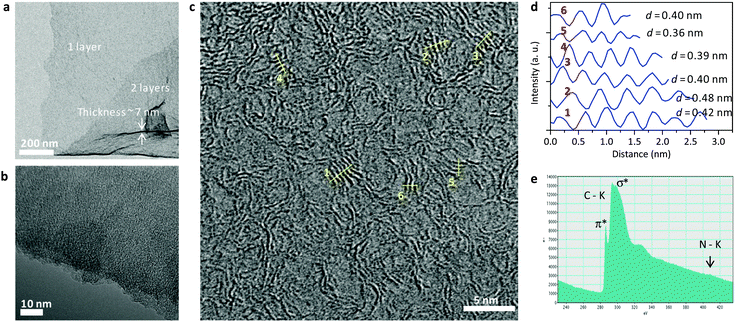
The samples were analyzed by aberration corrected, high resolution TEM (Ac-HRTEM) using a FEI Titan instrument that was operated at 300 kV. Fig. 2 shows some data on the sample N-CS, the N-doped carbon nanosheet. Lower magnification pictures (Fig. 2a and b) clearly show the very homogeneous, layer-like structure of those carbons. Purposefully, we have chosen positions where layers overlap and where folded-up parts allow an estimation of the thickness of the single layers, which is, in this specific case, around 7 nm. A more careful observation of the edge termination of the sheets, but also their inner structure (Fig. 2c) reveals that the sheets are composed on “tagliatelle”-like nanoribbons, partly densely packed but essentially bent and disordered, with the micropores described above coming from the interstitial sites of the ribbons. Electron energy loss spectra (EELS) (Fig. 2e) confirm the sp2-character of the as-formed sheets.
Picture analysis of the stacked regions reveals a ribbon-to-ribbon distance of 0.36–0.42 nm, i.e. a typical aromatic packing distance, but more expanded than graphite. This is known from graphene oxide, where the incorporation of foreign atoms also leads to layer expansion.26,27
The homogeneity and mechanical robustness of these layers are indeed very high, as for instance shown not only by scanning electron microscopy (SEM) and TEM, but also by AFM of specimens floated onto silicon wafers (ESI,† see Fig. SI 1).
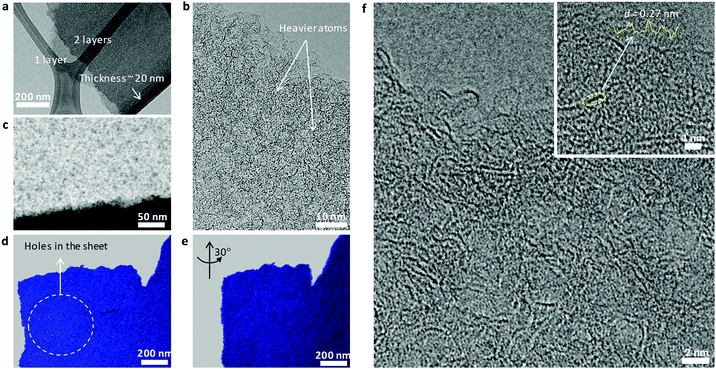
The local architecture is getting even more recognizable for the sulfur-doped carbons, where a very similar structure but with higher porosity is observed. In addition, due to the higher electron density and the very unusual high radiation stability of the as-formed layers, even localization and co-localization of single heavier atoms such as sulfur can be determined.
Low magnification analyses again confirm the homogeneous, layer-like character of the samples, generally with a higher thickness than the N-doped samples, here about 20 nm (Fig. 3a). The bended, ribbon-like character is even more clearly observed (Fig. 3c), and the ribbons tend to stack less than their N-doped counterparts, with single ribbons looping out at the edges allowing us to judge their nanosized dimensions. In the highest magnification applied (inset Fig. 3f), one can see single and lines of black spots edge-terminating the ribbons, potentially sulfur in a condensed-thiophenic-structure.19,28,29 The distance between the black spots is about 0.27 nm, i.e. the correct distance of zig-zag-termination sites in graphene ribbons, here potentially decorated with heavier atoms. Application of HAADF-STEM (high angle annular dark field-scanning TEM) microscopy and recording of tilt series (ESI†) provide a three dimensional impression and allows better visualization of the pore structure and distribution (Fig. 3c–e). The composition of a series of such pictures as a STEM tomographic video is added in the supporting information and as Fig. SI 2 (ESI†). Again, the very high, macroscopically homogeneous, well-accessible, microporous structure of the layers can be convincingly demonstrated. The reason why the layers are obviously made up of ribbons, but nevertheless maintain a constant thickness over lateral extensions of many microns is still open to discussion.
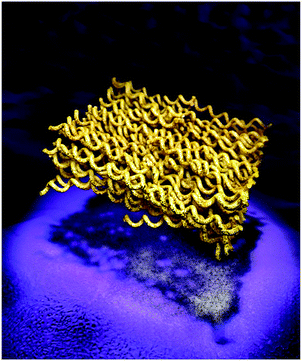
One important point to mention is that the applied synthesis conditions are selectively corrosive, i.e. all badly organized or less stable carbon structures are more easily oxidized towards CO2. The formation of lamellar mesophases in colloidal systems is not unusual and generally driven by the minimization of interface energy, with lamellar structures having the lowest interface energy of all mesophases.30 In the present case this discussion applies to the conditions throughout synthesis, i.e. a very polar salt melt and the forming carbon nanophase. By analyzing intermediates at lower reaction temperatures and shorter reaction times, we tried to get an admittedly incomplete picture of the formation mechanism. Obviously, highly fluorescent, but electron-sensitive carbon nanodots with a high carbon content and a diameter of about the thickness of the 2d-layers were first formed. These primary units presumably assemble into two dimensional aggregates via a “vectorial alignment”, as recently described also for other carbon nanodots.31 These structures are in a later stage of the process reaching higher temperatures oxidatively “polished” towards the final structure. Such a “noodle-block” (“Ramen”) with constant nanometer thickness, but composed of primary, potentially interlinked ribbons is artistically illustrated in Fig. 4. It is clear that such structures combine the highest surface area together with good stability, structural density and high accessibility of all edge atoms.
 | ||
| Fig. 4 Artistic illustration of the inner structure of the assembled carbon nanosheets as well their TEM projection on the plane (depicted as the shadow of the structure). | ||
Conclusions
In summary, we were able to show that the salt flux based synthesis for the conversion of glucose into functional carbon materials which contain N and S as dopants spontaneously results in a new type of mesostructure, where single carbon ribbons edge-terminated with oxygen and sulfur or nitrogen functionalities are “knitted” towards very homogeneous, about 10 nm thick layers which have very large specific surface areas of up to 3200 m2 g−1. Aberration corrected high resolution TEM together with EELS gave further details of this structure, including its predominant sp2-character, the disordered microporous pore structure arising from the interstitials of the packing of the carbon ribbons, and unexpectedly high radiation and oxidation stability. Due to the combination of high edge-located heteroatom doping with highest surface areas, the resulting structures have potential as metal-free electrocatalysts or also as a support “fleece” for metal nanocatalysts. The surprising fact is that this delicate mesoscale morphology is easily accessible by a convenient and low price synthesis from ordinary salts and sugars.Experimental part
Sample synthesis
The carbon sheets were synthesized by a molten salt process from glucose.13 For the synthesis of N-doped carbon sheets, 10 g of LiCl/KCl (eutectic composition: 45/55 in mass) salt was mixed with LiNO3 and glucose in a ratio of 10![[thin space (1/6-em)]](https://www.rsc.org/images/entities/char_2009.gif) :
:![[thin space (1/6-em)]](https://www.rsc.org/images/entities/char_2009.gif) 1
1![[thin space (1/6-em)]](https://www.rsc.org/images/entities/char_2009.gif) :
:![[thin space (1/6-em)]](https://www.rsc.org/images/entities/char_2009.gif) 1 (in mass), and the power mixture was thoroughly homogenized by ball milling. Molten salt reaction of the raw material mixture was performed using an electric oven under a continuous nitrogen flow. After reaction, the carbon sheets were extracted from the reaction product by repeated washing with deionized water, and finally the as-received wet carbon sheets were dried in a vacuum at 50 °C for over 24 h. The N-doped carbon sheets (N-CSs) were obtained after reaction at 900 °C for 5 h. S-doped carbon sheets (S-CSs) were obtained under identical synthetic conditions but by replacing LiNO3 with the same amount (in mass) of Na2S2O3.
1 (in mass), and the power mixture was thoroughly homogenized by ball milling. Molten salt reaction of the raw material mixture was performed using an electric oven under a continuous nitrogen flow. After reaction, the carbon sheets were extracted from the reaction product by repeated washing with deionized water, and finally the as-received wet carbon sheets were dried in a vacuum at 50 °C for over 24 h. The N-doped carbon sheets (N-CSs) were obtained after reaction at 900 °C for 5 h. S-doped carbon sheets (S-CSs) were obtained under identical synthetic conditions but by replacing LiNO3 with the same amount (in mass) of Na2S2O3.
Characterization
The microstructures of the samples were first examined by scanning electron microscopy (SEM) using a Gemini SEM, LEO 1550 system. Quantitative structural information of the samples was obtained from nitrogen sorption measurements performed using a Quadrasorb Adsorption Instrument (Quantachrome Instruments). The specific surface area was calculated using a multi-point Brunauer–Emmett–Teller (BET) method. The pore size distribution was extracted from a further analysis of the isotherms using the quenched-solid density functional theory (QSDFT) model.Transmission electron microscopy was performed using an image Cs corrected FEI Titan instrument that was operated at 300 kV. Samples were prepared via the drop deposition of the suspended material in chloroform onto a copper TEM grid with a holey carbon support film.
Acknowledgements
This work was supported by the Max-Planck society. The authors thank Dr Guylhaine Clavel for some TEM measurements and valuable discussions.References
- H. W. Kroto, J. R. Heath, S. C. Obrien, R. F. Curl and R. E. Smalley, Science, 1985, 318, 162–163 CAS.
- S. Iijima, Nature, 1991, 354, 56–58 CrossRef CAS.
- K. S. Novoselov, A. K. Geim, S. V. Morozov, D. Jiang, Y. Zhang, S. V. Dubonos, I. V. Grigorieva and A. A. Firsov, Science, 2004, 306, 666–669 CrossRef CAS PubMed.
- X. R. Wang, X. L. Li, L. Zhang, Y. Yoon, P. K. Weber, H. L. Wang, J. Guo and H. J. Dai, Science, 2009, 324, 768–771 CrossRef CAS PubMed.
- K. P. Gong, F. Du, Z. H. Xia, M. Durstock and L. M. Dai, Science, 2009, 323, 760–764 CrossRef CAS PubMed.
- J. Zhang, X. Liu, R. Blume, A. H. Zhang, R. Schlogl and D. S. Su, Science, 2008, 322, 73–77 CrossRef CAS PubMed.
- Y. W. Zhu, S. Murali, M. D. Stoller, K. J. Ganesh, W. W. Cai, P. J. Ferreira, A. Pirkle, R. M. Wallace, K. A. Cychosz, M. Thommes, D. Su, E. A. Stach and R. S. Ruoff, Science, 2011, 332, 1537–1541 CrossRef CAS PubMed.
- J. Chmiola, C. Largeot, P. L. Taberna, P. Simon and Y. Gogotsi, Science, 2010, 328, 480–483 CrossRef CAS PubMed.
- X. W. Yang, C. Cheng, Y. F. Wang, L. Qiu and D. Li, Science, 2013, 341, 534–537 CrossRef CAS PubMed.
- S. P. Wang, J. N. Zhang, P. Shang, Y. Y. Li, Z. M. Chen and Q. Xu, Chem. Commun., 2014, 50, 12091–12094 RSC.
- Y. Y. Shao, J. H. Sui, G. P. Yin and Y. Z. Gao, Appl. Catal., B, 2008, 79, 89–99 CrossRef CAS.
- X. F. Liu and M. Antonietti, Carbon, 2014, 69, 460–466 CrossRef CAS.
- X. F. Liu and M. Antonietti, Adv. Mater., 2013, 25, 6284–6290 CrossRef CAS PubMed.
- J. Kelly, Gunpowder: Alchemy, Bombards, and Pyrotechnics: The History of the Explosive that Changed the World, Perseus Books Group, 2005 Search PubMed.
- W. Cocroft, Dangerous Energy: The archaeology of gunpowder and military explosives manufacture, English Heritage, Swindon, 2000 Search PubMed.
- K. Elumeeva, J. W. Ren, M. Antonietti and T. Fellinger, ChemElectroChem, 2015, 2, 584–591 CrossRef CAS.
- Without dilution with the alkali chloride salt, heating up the mixture of glucose and nitrate in a nitrogen atmosphere eventually ends up with an explosion, which, from a chemical point of view, is the same as the combustion of black powder.
- X. B. Wang, Y. J. Zhang, C. Y. Zhi, X. Wang, D. M. Tang, Y. B. Xu, Q. H. Weng, X. F. Jiang, M. Mitome, D. Golberg and Y. Bando, Nat. Commun., 2013, 4, 2905 Search PubMed.
- T. P. Fellinger, A. Thomas, J. Y. Yuan and M. Antonietti, Adv. Mater., 2013, 25, 5838–5854 CrossRef CAS PubMed.
- T. G. Ros, A. J. van Dillen, J. W. Geus and D. C. Koningsberger, Chem. – Eur. J., 2002, 8, 1151–1162 CrossRef CAS.
- C. Moreno-Castilla, M. V. Lopez-Ramon and F. Carrasco-Marin, Carbon, 2000, 38, 1995–2001 CrossRef CAS.
- S. A. Wohlgemuth, R. J. White, M. G. Willinger, M. M. Titirici and M. Antonietti, Green Chem., 2012, 14, 1515–1523 RSC.
- W. Kicinski, M. Szala and M. Bystrzejewski, Carbon, 2014, 68, 1–32 CrossRef CAS.
- H. Lux, Z. Elektrochem., 1939, 45, 303–309 CAS.
- H. Flood and T. Förland, Acta Chem. Scand., 1947, 1, 592–604 CrossRef CAS PubMed.
- D. Chen, H. B. Feng and J. H. Li, Chem. Rev., 2012, 112, 6027–6053 CrossRef CAS PubMed.
- W. Gao, L. B. Alemany, L. J. Ci and P. M. Ajayan, Nat. Chem., 2009, 1, 403–408 CrossRef CAS PubMed.
- Z. Yang, Z. Yao, G. F. Li, G. Y. Fang, H. G. Nie, Z. Liu, X. M. Zhou, X. A. Chen and S. M. Huang, ACS Nano, 2012, 6, 205–211 CrossRef CAS PubMed.
- J. P. Paraknowitsch and A. Thomas, Energy Environ. Sci., 2013, 6, 2839–2855 CAS.
- M. Antonietti and S. Förster, Adv. Mater., 2003, 15, 1323–1333 CrossRef CAS.
- Y. Q. Chang, M. Antonietti and T. P. Fellinger, Angew. Chem., Int. Ed., 2015, 54, 5507–5512 CrossRef CAS PubMed.
Footnotes |
| † Electronic supplementary information (ESI) available. See DOI: 10.1039/c5mh00274e |
| ‡ School of Materials Science & Engineering, Zhejiang University, 310027 Hangzhou, China. |
| This journal is © The Royal Society of Chemistry 2016 |


