
 Open Access Article
 This Open Access Article is licensed under a
 Creative Commons Attribution 3.0 Unported Licence
Squaramides with cytotoxic activity against human gastric carcinoma cells HGC-27: synthesis and mechanism of action†‡
Mireia
Quintana§
a,
Juan V.
Alegre-Requena§
ab,
Eugenia
Marqués-López
b,
Raquel P.
Herrera
*b and
Gemma
Triola
*a
aBiomedicinal Chemistry Department, Institute of Advanced Chemistry of Catalonia (IQAC), CSIC, E-08034, Barcelona, Spain. E-mail: gemma.triola@iqac.csic.es
bLaboratorio de Organocatálisis Asimétrica, Departamento de Química Orgánica, Instituto de Síntesis Química y Catálisis Homogénea (ISQCH), CSIC-Universidad de Zaragoza, E-50009 Zaragoza, Spain. E-mail: raquelph@unizar.es
First published on 9th March 2016
Abstract
A series of squaramates and squaramides have been synthesized and their cytotoxic activity has been investigated in different cancer cell lines. Among the studied compounds, squaramide 34 showed a potent and selective cytotoxicity against the human gastric cancer cell line HGC-27. Studies directed to elucidate the mechanism of induced cell death were performed. Cell cycle distribution analysis and cell death studies showed that compound 34 induces cell cycle arrest at the G1 phase and caspase-dependent apoptosis. In conclusion, squaramide 34 can be considered a potential anticancer agent for gastric carcinoma.
1. Introduction
The field of squaramides has experienced an extraordinary growth since the work reported by Rawal and co-workers in 2008,1 where these molecules were used as organocatalysts. Their promising properties also make them appealing for diverse areas of research beyond organocatalysis.2–4Their unique structural features are believed to have an effect on the biological activity of these substrates; squaramide structures present a planar aromatic framework5 bearing two adjacent carbonyl acceptor groups and two NH donor sites that are able to establish multiple hydrogen bond interactions.6 In this sense, due to their important ability to selectively bind through cooperative hydrogen bonds, squaramides have received special attention in medicinal chemistry since they may be able to interact with biological targets via specific molecular recognition.7
This has promoted recent interest of medicinal chemists in considering squaramide motifs as promising candidates for drug design and interesting tools as bioisosteres of ureas, guanidines or phosphates, among others.8–16 Moreover, squaramides exhibit an interesting dual behaviour, as they are able to act as good hydrogen bond acceptors and hydrogen bond donors, which make them suitable for both cation and anion recognition. This could be crucial for the success of cell internalization of these compounds, one of the most important issues in drug design.
In spite of the increasing number of bioactive squaramide-based compounds found in the literature, their application as anticancer agents has not yet been intensively explored and no exhaustive studies in different cancer cells have been previously reported.17,18 In addition, some squaramides have been shown to selectively bind protein kinases18 or the CXCR2 receptor,19 thus indicating that this class of compounds may exert their function by selectively binding to cellular targets. Hence, this interesting behaviour suggests that squaramides may serve as a good starting point to identify molecules that can specifically target cancer cells. This, together with the interest in searching for new anticancer agents, prompted us to evaluate the antitumor activity of a variety of squaramides synthesized following a protocol recently published by us.20–22
Based on these precedents, we envisioned that the ability of squaramides to generate hydrogen bonds and electrostatic interactions could be an interesting option to design specific recognition systems with potential antitumor effects. Herein, we present a series of squaramides and squaramates and the study of their activity against different cancer cells that confirms the antitumor properties of this family of promising drug candidates.
2. Results and discussion
Firstly, following our optimized reaction conditions,20,22 a series of differently substituted squaramates 1–14 and squaramides 15–39 were synthesized (Charts 1 and 2). Substituents with different stereoelectronic properties and lipophilicities were incorporated with the aim of investigating if their biological activity may correlate with the presence of different NH amide-type donor sites. | ||
| Chart 1 Squaramates and squaramides evaluated. | ||
 | ||
| Chart 2 Squaramides evaluated. | ||
2.1. Cell-type specific cytotoxic effect of squaramides
The effect of squaramides on cell viability was initially evaluated on different tumor cell lines (HeLa, cervical carcinoma, and HGC-27, gastric carcinoma) using an MTT assay after 24 h of treatment at 100 μM (Fig. 1). | ||
| Fig. 1 Percentage of cell viability after 24 h of treatment with a concentration of 100 μM as measured by an MTT assay. The cells were grown on a 96-well plate and treated with the squaramides or DMSO (vehicle group). After 24 h of treatment, cell viability was evaluated using an MTT assay, as described in the Experimental section. Cell viability is represented in relation to the vehicle group. Data are the average ± SD of three experiments. | ||
As shown in Fig. 1, treatment with some of the compounds resulted in significant loss of cell viability. Some structure–activity relationships can be disclosed from this initial screening. Hence, squaramates 1–14 (Chart 1) showed no remarkable activity in any of the cases, thus indicating that the second NH amide bond is required for activity. Substantial inhibition can be seen for compounds 15–20 all of them sharing a cinchona-based substituent. Interestingly, the presence of a 3,5-bis(trifluoromethyl)phenyl moiety confers almost in all the cases inhibition of cell viability (15, 16, 21, 27, 34–38), irrespective of the other substituent present at the second amide. Similarly, 3,5-bis(trifluoromethyl)benzyl substituted squaramides 22 and 26 also show good activities in HGC-27 cells, whereas they are less active in HeLa cells.
After this initial screening, the most potent compounds were selected and were further evaluated at 20 μM (Fig. 2). Interesting information was revealed from this second screening. In general, HGC-27 cells seem to be more sensitive than HeLa cells to the effect of the tested squaramides, except for compound 27 which shows a more potent cell viability inhibitory activity in HeLa cells than in HGC-27. This cell-type specificity may discard a general non-specific cytotoxic effect exerted by the squaramides. Again, the cinchona-based compounds 15–20 showed good inhibitory activities, independently of the substituents present at the other point of diversity. Squaramides containing bulky and chiral substituents at both sites (25, 39) are more potent than the corresponding p-trifluoromethylphenyl analogues (29, 30). The 3,5-bis(trifluoromethyl)phenyl substituted squaramides 34–38 displayed different potencies depending on their substitution pattern, with the highly lipophilic 33 and 34 being the most potent compounds. As a result of this second screening, squaramides 21, 22, 28–30, 32 and 35–37 were discarded due to the low potency displayed at 20 μM and, consequently, IC50 values were measured for the remaining compounds (Table 1).
 | ||
| Fig. 2 Percentage of cell viability after 24 h of treatment with a concentration of 20 μM as measured by an MTT assay. The cells were grown on a 96-well plate and treated with the squaramides or DMSO (vehicle group). After 24 h of treatment, cell viability was evaluated using an MTT assay, as described in the Experimental section. Cell viability is represented in relation to DMSO. Data are the average ± SD of three experiments. Note: compounds 29, 30 and 33–35 were not investigated in HeLa cells at 20 μM. | ||
| Compound | Mean IC50 (95% CI) in μM | |
|---|---|---|
| HeLa cells | HGC-27 cells | |
| 15 | 11.26 (10.33–12.2) | 8.12 (7.14–9.24) |
| 16 | 15.17 (13.2–17.4) | 8.21 (7.68–8.78) |
| 17 | 10.79 (9.49–12.26) | 4.53 (3.83–5.36) |
| 18 | >20 | 12.76 (11.84–13.7) |
| 20 | 12.08 (11.37–3.93) | 3.01 (2.26–5.02) |
| 25 | >20 | 11.11 (10.51–11.74) |
| 33 | >20 | 3.39 (2.85–4.04) |
| 34 | 34.63 (27.97–42.87) | 1.81 (1.47–2.23) |
| 39 | >20 | 10.79 (10.30–11.20) |
| Cisplatin | — | 20.44 (19.84–22.18) |
| Doxorubicin | — | 37.40 (30.63–45.67) |
The increased sensitivity of HGC-27 cells compared to HeLa cells was again proven, showing in all the cases IC50 values in the low micromolar range for all the tested squaramides. Interestingly, squaramide 34, bearing a 1,1,2-triphenylethanol and a 3,5-trifluoromethylphenyl substituent, was found to be one of most potent and selective compounds tested, showing an IC50 value of 34.63 μM in HeLa cells and 1.81 μM in HGC-27 cells. Analogously, squaramide 33, where the 3,5-bis(trifluoromethyl)phenyl had been replaced by 3,5-difluorophenyl, displayed a similar activity pattern. Moreover, this low micromolar IC50 decreased further to nanomolar values (660 nM, Table 2) when HGC-27 cells were exposed to compound 34 for 48 h.
With these promising results in hand regarding the activity and selectivity of squaramide 34, we decided next to explore the activity profile of 34 on different cell lines. Hence, cell viability studies were extended to the glioblastoma cells lines, T98 and U87 (the most aggressive type of primary brain tumor) and the non-cancer cells HEK293, MDCK (Madin-Darby Canine Kidney Epithelial cells) and the Vero cell line (African green monkey kidney cell line). The results are displayed in Table 2 and confirm certain cell-dependent toxicity (IC50 values of 60.25 μM and 7.15 μM for the glioblastoma cell lines U87 and T98, respectively, 9.03 μM for the HEK293 cells, 70.20 μM for the MDCK cells and 33.40 μM for the Vero cells).
Gastric cancer accounts for 8% of the total cases of cancers and 10% of total deaths. The survival for patients with this type of cancer has improved only modestly over the last 50 years. Consequently, there is still a clear need for the development of more efficient treatments. Moreover, gastric cancer presents high molecular heterogeneity, which prevents the uniform application of specific targeted agents,23 and therefore the identification of novel targets or novel compounds active on gastric cancer cells is of great interest.23,24 With this aim, and due to the high potency displayed by 34 in the gastric cancer cells HGC-27 together with its interesting selectivity profile observed in the other cell lines, we aimed to further examine the molecular mechanisms underlying 34-mediated cell death in HGC-27 cells.
2.2. Apoptotic cell death study
The MTT assay reflects viable cells but cannot be employed as a marker of cell proliferation. A decrease in the number of viable cells can be attributed to cell cycle arrest and/or cell death. To determine whether 34-induced decrease in cell viability in HGC-27 cells was accompanied by alterations in cell cycle distribution, the percentage of cells in the different stages of the cell cycle was analysed by flow cytometry. As shown in Fig. 3, treatment with 34 for 24 h induced a significant accumulation of G0/G1 cells associated with a decrease in the S–G2/M cell population, suggesting that cell cycle arrest at the G0/G1 phase contributes to the observed effect, whereas treatment of cells with doxorubicin, included as a positive control, resulted in G2/M arrest. | ||
| Fig. 3 Cell cycle distribution of HGC-27 cells with or without treatment of compound 34 at 5 μM in DMSO for 24 h. Doxorubicin (500 nM) was included as a positive control. The cells were collected and processed for cell cycle analysis. A) Representative cell cycle histograms obtained from HGC-27 cells after 24 h of exposure to vehicle or 34. B) Quantification of the relative number of cells in each stage of the cell cycle (Multicycle AV software). Data are the average ± SD of three experiments. | ||
Cell death can be controlled by several mechanisms or pathways.25 Therefore, we decided to quantify the cell death caused by 34 as well as determine the specific cell death modality, which is mainly apoptosis, necrosis or autophagy that may be prevalent in these cells. With this aim, we evaluated the apoptotic effect of 34 on HGC-27 cells using an Annexin V-FITC/PI staining assay and analysed the stained cells by flow cytometry.26 Briefly, loss of plasma membrane integrity is indicative of cell death and this can be assessed using cell-impermeable dyes that are able to enter the cell once the integrity of the plasma membrane is lost, such as propidium iodide (PI). Moreover, apoptotic cells expose phosphatidylserine (PS) before membrane rupture, whereas in necrotic cells PS exposure and membrane disruption occur simultaneously, thus discriminating early and late apoptotic cells as well as necrotic cells. To study the effect of 34 on HGC-27 cells, cells were treated with the vehicle alone as control or with 34 at three different concentrations (1, 2.5 and 8 μM). After 24 hours, the samples were double stained with Annexin V-FITC and PI and the percentage of cells was analysed. As shown in Fig. 4, compound 34 induced cell apoptosis in a concentration-dependent manner. In the case of 1 μM, 2.5 μM and 8 μM treated HGC-27 cells, the total percentage of early and late apoptotic cells were 2.4%, 24.7%, and 60.1%, respectively. In contrast, only 6.7% of the early and late apoptotic cells were detected in the control, which revealed that compound 34 efficiently induces apoptosis in HGC-27 cells (Fig. 4). Doxorubicin and cisplatin have been used for the treatment of gastric cancer, usually in combination with other anticancer agents. Therefore, the effect of doxorubicin in HGC-27 cells was also investigated, resulting in dose-dependent induction of apoptosis. HGC-27 cells treated with a concentration of 2 μM of doxorubicin27 presented 3.2% of early apoptotic cells, 16.7% of late apoptotic cells and 32.4% of necrotic cells, thus showing a slightly less potent effect than squaramide 34.
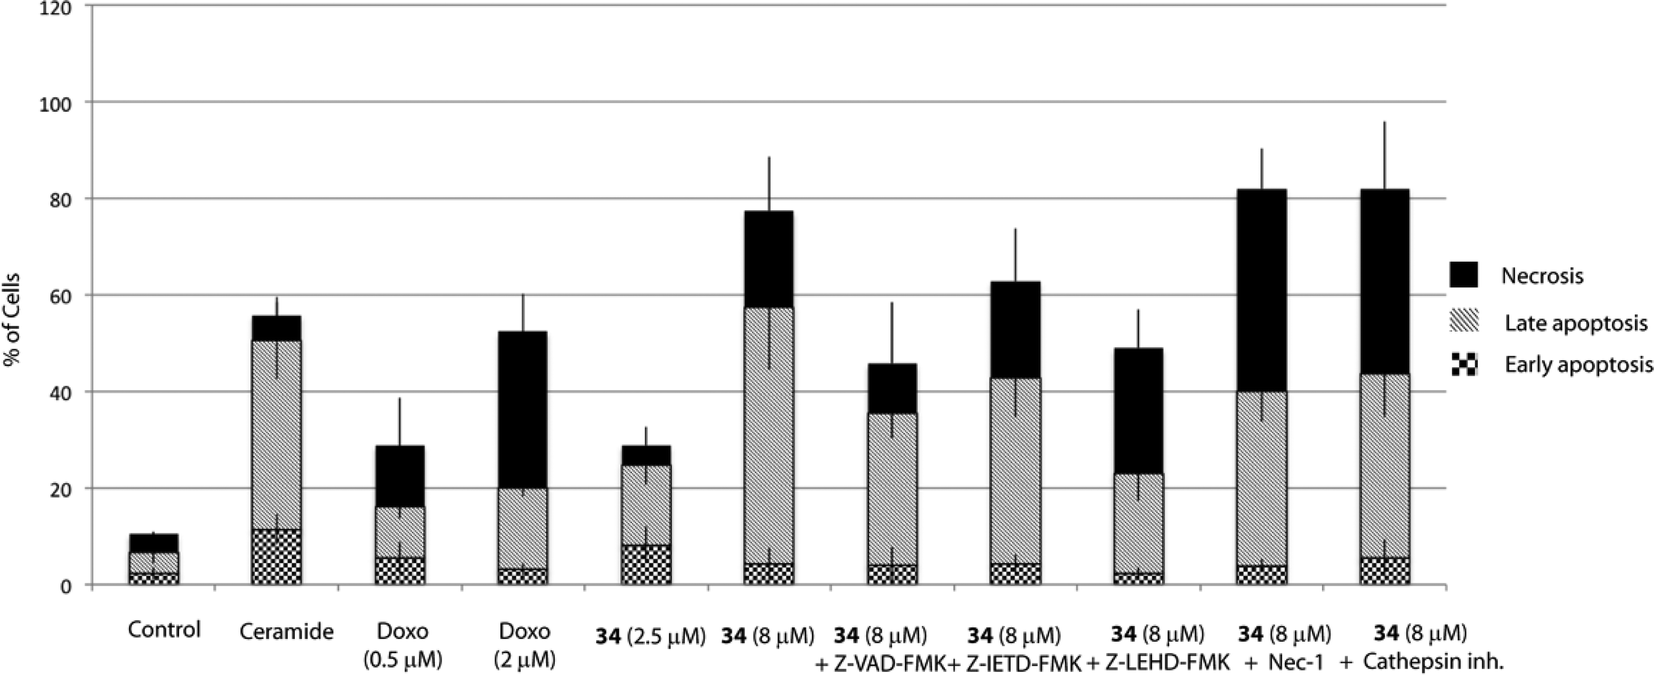 | ||
| Fig. 4 Apoptotic effect of squaramide 34 on HGC-27 cells. Cells were treated with DMSO (vehicle group) or 34 alone or together with Z-VAD-FMK (20 μM), Z-IETD-FMK (20 μM), Z-LEHD-FMK (20 μM), Nec-1 (10 μM) or cathepsin inhibitor III (10 μM). Cells were pre-treated for 1 h with Z-VAD-FMK, Z-IETD-FMK, Z-LEHD-FMK and cathepsin inhibitor III and 3 h with Nec-1 before adding 34. C8-ceramide (20 μM) was added as a positive control. After 24 h of treatment, the cells were double-stained with Annexin V and PI and analysed. The percentage of apoptotic and necrotic cells upon incubation with 34 were quantified by flow cytometry as described in the Experimental section (live cells (bottom left quadrant), early apoptotic cells (bottom right quadrant), late apoptotic cells (upper right quadrant) and necrotic cells (upper left quadrant)). The graph shows the quantitative analysis of necrosis and early and late apoptosis in treated cells. The data were obtained from three independent experiments. | ||
To explain the high doses required to detect cell death compared to the IC50 values obtained in the MTT assays, we measured the effect of these compounds on cell viability by an alternative assay based on the quantification of cellular ATP levels. Indeed, although IC50 values resulting from these studies were in a similar range, the dose-dependent curve obtained in the ATP-based analysis was in agreement with concentrations required in cells to cause an apoptotic effect (Fig. S1‡). Alternatively, a sulforhodamine B (SRB) assay was employed to investigate the cytotoxicity of 34. SRB is a dye that binds proteins under mild acidic conditions, and the amount of detected dye can be correlated with the cell mass.28 Hence, the SRB assay is independent of the mitochondrial function. In this case, an IC50 of 9.74 μM was obtained for squaramide 34 in HGC-27 cells (vs. 149 μM and 73.85 μM in MDCK and Vero cells, respectively). In contrast to the MTT assay that requires cellular metabolic activity and therefore only stains viable cells, SRB stains viable and dead cells, thus giving generally slightly higher IC50 values.28
2.3. Squaramide 34 induces caspase-dependent cell death
Apoptosis can be triggered through caspase-dependent or independent mechanisms. To explore whether 34 induces cell death through a caspase-dependent mechanism, Z-VAD-FMK, a pan-caspase inhibitor was employed. Hence, pre-treatment of cells with Z-VAD-FMK (20 μM) for 1 h partially prevented 34-induced cell death, thus suggesting that a caspase-dependent mechanism may be involved (Fig. 4).Apoptosis may be initiated by the extrinsic or the intrinsic signaling pathway. The extrinsic signaling pathway involves death receptors located at the membrane, such as FasL/FasR and TNF-α/TNFR1, the transmission of the signal from the cell surface to intracellular signaling pathways and the implication of caspase-8. The intrinsic pathway is the mitochondrial pathway and may be caused by different stimuli including free radicals, toxins, or hypoxia, and involves the activation of caspase-9. The extrinsic pathway and the intrinsic pathway converge on the final execution phase, mediated by the effector caspase-3.29 Hence, we next investigated the implication of both pathways by pre-treatment of the cells with a caspase-8 (Z-IETD-FMK) or a caspase-9 (Z-LEHD-FMK) inhibitor. Interestingly, the percentage of apoptotic cells decreased markedly upon treatment with the caspase-9 inhibitor Z-LEHD-FMK, compared to the results obtained with the other caspase inhibitors, thus suggesting the implication of the mitochondrial pathway (Fig. 4). A smaller decrease in apoptosis rate was also observed when cells were treated with the caspase inhibitor Z-IETD-FMK, which could be due to the described cross reactivity for these inhibitors.30
2.4. Alternative cell death mechanism
 | ||
| Fig. 5 HGC-27 cells were exposed to 34 for 24 h. A) Levels of LC3-II were assessed by Western blotting of cell lysates as described in the Experimental procedures. XM462 (10 μM), a known autophagy inducer in HGC-27 cells, was used as a positive control.47 The images shown are representative of three independent experiments with similar results. B) Quantified LC3-II levels with respect to β-actin. C) Effect of autophagy inhibition on apoptosis/necrosis of treated HGC-27 cells. Cells were treated with DMSO (vehicle group), 34 alone, chloroquine (CQ, 50 μM in EtOH) or 3-methyladenine (3-MA, 2 mM in DMSO). The cells were pre-treated for 2 h with CQ or 3 h with 3-MA before adding 34. After 24 h of treatment, the cells were double-stained with Annexin V and PI and analysed. The percentage of apoptotic and necrotic cells upon incubation with 34 were quantified by flow cytometry as described in the Experimental section (live cells (bottom left quadrant), early apoptotic cells (bottom right quadrant), late apoptotic cells (upper right quadrant) and necrotic cells (upper left quadrant)). The graph shows the quantitative analysis of necrosis and early and late apoptosis in cells treated with 34. The data were obtained from three independent experiments. | ||
Although it has been proven that autophagy can contribute to cell death,36 there is still a controversy whether it is a cell death caused by autophagy, or a cell death accompanied by induction of autophagy that may exert a survival or cytoprotective effect.37,38 To determine how this autophagy induction impacts the cell fate, we aimed to test if autophagy plays a causative role in preventing 34-induced cell death by employing autophagy inhibitors. Herein, we used two autophagy inhibitors, chloroquine (CQ), a lysosomotropic agent that impairs the lysosomal function, and 3-methyladenine (3-MA), a pan inhibitor of the lipid kinase phosphatidylinositol 3-kinase (PI3K), involved in the first steps of autophagosome formation, and the percentage of apoptotic/necrotic and live cells upon autophagy inhibition was analysed. As shown in Fig. 5, co-treatment of 34 with autophagy inhibitors such as CQ or 3-MA did not increase the number of live cells, but on the contrary significantly increased the number of necrotic cells. Taken all together, all data described above suggest that autophagy is triggered by 34 exposure to HGC-27 cells as a protective response to alleviate its cytotoxicity. Moreover, the fact that cathepsin inhibition, which causes lysosomal dysfunction, results also in increased cell death may underscore the pro-survival function of autophagy, which requires a correct lysosomal function to take place (Fig. 4).39
2.5. Mitochondria and ROS
MTT assays measure the activity of succinate dehydrogenase, a mitochondrial enzyme, hence reflecting the activity status of this organelle and suggesting that the differences observed in both cell viability methods employed above (MTT vs. ATP-based assay) may occur due to mitochondrial damage, which would be in agreement with the increased viability upon treatment with the caspase-9 inhibitor, a marker of the intrinsic mitochondrial pathway.If the intrinsic mitochondrial pathway is activated, there are alterations in the inner mitochondrial membrane, resulting in changes in transmembrane potential, loss of membrane permeability and activation of caspase. Therefore, we next investigated the mitochondrial membrane potential in HGC-27 cells treated with squaramide 34. JC-1 accumulates as aggregates in the mitochondria (orange color) and the color changes from orange to green fluorescence in apoptotic cells with depolarization of mitochondrial membrane potential, where JC-1 exists in the monomeric form.40 Therefore, JC-1 has been widely used to detect mitochondrial depolarization during apoptosis. The results showed that 34 efficiently caused mitochondrial membrane depolarization. When ΔΨm levels were assessed quantitatively by the ratio of orange/green fluorescence intensity, there was a significant reduction of ΔΨm in HGC-27 cells compared to control cells after a 2 μM and 8 μM treatment for 24 h (Fig. 6), which indicates that compound 34 induces ΔΨm changes in HGC-27 cells during apoptosis. These results confirmed the implication of the intrinsic pathway in the 34-mediated cell death.
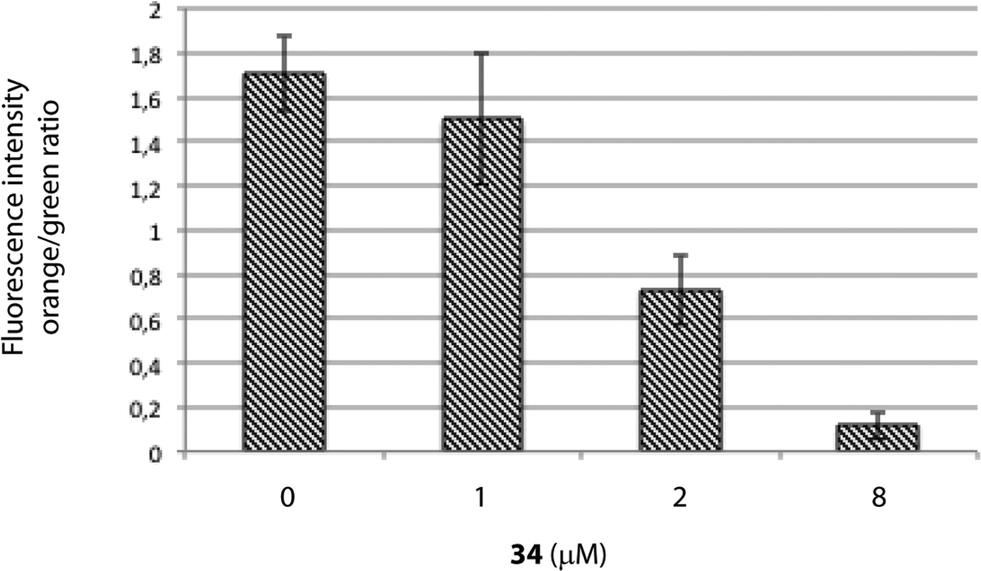 | ||
| Fig. 6 Mitochondrial membrane potential in 34-treated HGC-27 cells evaluated by JC-1 staining and flow cytometry analysis. Quantification of the orange/green ratio. Data are the average ± SD of three experiments. | ||
Reactive oxygen species (ROS) are known triggers of the intrinsic apoptotic cascade.41 Therefore, oxidative damage caused by the generation of ROS may be one of the underlying mechanisms of 34-mediated cell death. To elucidate whether oxidative stress mediated by ROS generation plays a critical role in the onset of cell death caused by 34, we determined the changes in the intracellular redox potential upon treatment with 34 by employing the fluorescent probe 2′,7′-dichlorofluorescein diacetate (DCFH-DA), which is converted to highly fluorescent dichlorofluorescein (DCF) in the presence of intracellular ROS. However, although a remarkable increase in ROS formation was detected when H2O2 was employed as a positive control, no signs of ROS production could be detected in HGC-27 treated cells, thus discarding the implication of oxidative damage in the molecular mechanism responsible for 34-mediated cell death (Fig. S2‡).
Summary and conclusions
In this study, it has been shown that substituted squaramide 34 effectively inhibited the proliferation of HGC-27 cells in a concentration-dependent manner. These inhibitory effects were associated with the cell cycle arrest and induction of apoptosis dependent of caspases that implicates the activation of the intrinsic pathway and the subsequent mitochondrial membrane depolarization. The implication of ROS as stimuli for the activation of the intrinsic pathway has been discarded, suggesting that other stimuli or pro-apoptotic proteins may be involved in the activation of the intrinsic pathway. Apart from the observed caspase-dependent apoptosis, no signs of cathepsin-mediated cell death or necroptosis have been detected. Moreover, the cell death caused by 34 is accompanied by autophagy induction having a protective effect. These overall results indicate that the decrease in cell viability caused by squaramide 34 is most likely mediated by G0/G1 cell cycle arrest and caspase-mediated apoptosis. Since the identification of compounds inducing a specific cell death subroutine is preferred to avoid side-effects and nonspecific cytotoxic effects, squaramide 34 can be considered a promising agent for the treatment of gastric carcinoma. Moreover, although 34 presents an specific effect on HGC-27 cells vs. HeLa, U87 and T98 cells, similar anti-tumor effects on other epithelial tumor types, particularly those of the GI tract, cannot be discarded and will be characterized in future studies.Experimental section
Materials
Minimum essential medium eagle, fetal bovine serum, nonessential amino acids, 3-[4,5-dimethylthiazol-2-yl]-2,5-diphenyltetrazolium bromide (MTT), BSA, NADH, Tween 20, trypsin-EDTA, chloroquine diphosphate, 3-methyladenine, necrostatin-1, pepstatin A, C8-ceramide, doxorubicin, 2′,7′-dichlorofluorescein diacetate and protease inhibitors were obtained from Sigma. Laemmli buffer and acrylamide were procured from BioRad, SDS from Fluka, and the microBCA protein assay kit from Thermo Scientific. The protease inhibitor cocktail contained 2 μg ml−1 aprotinin, 5 μg ml−1 leupeptin, and 1 mM phenylmethylsulphonyl fluoride. Z-VAD-FMK and E-64-D were acquired from Enzo Life Science. Z-IEDT-FMK and Z-LEHD-FMK were purchased from Alfa Aesar and cathepsin inhibitor III from CalBioChem. Annexin V-FITC early apoptosis detection kit was obtained from Cell Signaling. Antibodies: microtubule-associated protein 1-light chain 3 (LC3) II (rabbit) was obtained from Abcam, and β-actin (mouse) was purchased from Sigma. HRP secondary antibodies were acquired from GE Healthcare.General experimental methods
Purification of reaction products was carried out either by filtration or by flash chromatography using silica gel (0.063–0.200 mm). Analytical thin layer chromatography was performed on 0.25 mm silica gel 60-F plates. The ESI ionization method and a mass analyzer type MicroTof-Q were used for ESI measurements. 1H-NMR spectra were recorded at 300 and 400 MHz; 13C-NMR-APT spectra were recorded at 75 and 100 MHz; CDCl3 and DMSO-d6 were used as solvents. Chemical shifts were reported in the δ scale relative to residual CHCl3 (7.26 ppm) and DMSO (2.50 ppm) for 1H-NMR and to the central line of CDCl3 (77 ppm) and DMSO-d6 (39.43 ppm) for 13C-NMR-APT. All commercially available solvents and reagents were used as received.Representative procedure for the synthesis of squaramates and squaramides
To a mixture of 3,4-dimethoxy-3-cyclobutene-1,2-dione (0.2 mmol) in MeOH (0.75–1.5 ml), appropriate amine (0.2 mmol) was added at room temperature. After the appropriate reaction time, the corresponding squaramate was purified either by filtration, washing with MeOH at −25 °C, or column chromatography (see the ESI‡). Squaramate 1 is commercially available. The 1H and 13C-NMR spectral data for squaramates 2,423,104,429,42 and 10,42 are consistent with values previously reported in the literature. For spectral and analytical data for all new squaramates (5–8 and 11–14), see the ESI.‡Squaramides 15-39 were synthesized following our own reported procedure.20,22 The 1H and 13C-NMR spectral data for squaramides 15–18,4319,4420,121,2022,2023,2024,2025,2026,127,4528,2029,4630,4331,2032,2033,2034,2035,2036,2037,4538,20 and 39,20 are consistent with values previously reported in the literature.
Cell culture
The human gastric cancer cell line HGC-27 was cultured at 37 °C in 5% CO2 in minimum essential medium supplemented with 10% fetal bovine serum and 1% nonessential amino acids. Cells were routinely grown at 80% maximum confluence. Glioblastoma cells T98G and U87 as well as HEK293 and HeLa cells were maintained at 37 °C in 5% CO2 in Dulbecco's modified Eagle's medium supplemented with 10% fetal bovine serum and 100 ng ml−1 each of penicillin and streptomycin.Cell viability assay
To determine cell viability, the colorimetric MTT metabolic activity assay was employed. Cells were seeded at a density of 0.1 × 10⁶ cells ml−1, 0.1 ml per well (96-well plates) and cultured at 37 °C and 5% CO2. Twenty-four hours after seeding, cells were exposed to varying concentrations of the investigated compounds and viability was determined 24 h or 48 h later. The control culture was prepared by addition of culture medium (cell viability control) or DMSO (vehicle control) in the absence of treatment. The stock solution of doxorubicin was prepared in water. After 24 h or 48 h of treatment, MTT solution (10 μl at 5 mg ml−1 in PBS) was added to each well and the cells were incubated for another 3 h. The solution was removed from the precipitate and the resulting formazan crystals were dissolved in DMSO (100 μl) and the absorbance intensity was measured using a microplate reader (Molecular Devices, SpectramaxM5) at 570 nm. All experiments were performed in triplicate, and the relative cell viability (%) is expressed as the percentage of cell viability relative to the cells treated with DMSO (0.1%, vehicle group).SRB assay
Cells were seeded at a density of 0.1 × 10⁶ cells per ml, 0.1 ml per well (96-well plates) and cultured at 37 °C and 5% CO2. Twenty-four hours after seeding, cells were exposed to varying concentrations of 34 and viability was determined after 24 h. The control culture was prepared by addition of DMSO (vehicle control) in the absence of treatment. After 24 h, 50 μl of TCA (50% w/v) and 200 μl of PBS were added to each well and the cells were incubated for 1 h at 4 °C. The solution was then removed and the plate was washed with Milli-Q water four times. After that, 100 μl per well of SRB solution (0.4% sulforhodamine B w/v in 0.1% acetic acid) was added and the samples were incubated for another 30 min at room temperature. The plate was then washed with 1% acetic acid five times and 200 μl of a 10 mM Tris solution (pH 10.5) were added to each well. After 30 min of incubation at room temperature, the absorbance intensity was measured using a microplate reader (Molecular Devices, SpectramaxM5) at 564 nm. All experiments were performed in triplicate, and the relative cell viability (%) is expressed as the percentage of cell viability relative to the cells treated with DMSO (0.1%, vehicle group).Cell cycle analysis
Cells were seeded at 150![[thin space (1/6-em)]](https://www.rsc.org/images/entities/char_2009.gif) 000 cells per ml in 6-well plates (1 ml per well). Cells were allowed to adhere for 24 h, and then they were treated with the vehicle (0.1% ethanol) or 34. After exposure for 24 h, cell media were discarded and cells were washed with 400 μl of PBS–EDTA (1% BSA) and harvested with 400 μl of trypsin–EDTA (1% BSA) (37 °C per 2 min). Cells were pulled down by centrifugation at 1300 rpm per 3 min; the cell pellet was washed once with 400 μl of PBS–EDTA (1% BSA) and again centrifuged at the same speed/time. Cells were fixed by −20 °C overnight incubation with 70% ethanol (9.5 ml) in 1 × PBS solution (0.5 ml). Fixed cells were pulled down, washed once with PBS–EDTA (1% BSA) and stained at 37 °C for 2 h with propidium iodide solution (0.1 mg ml−1 in PBS) and RNase, DNase-free (10 μg ml−1). Stained cells were analyzed by using a Guava EasyCyte™ flow cytometer (Merck Millipore, Billerica, MA). Data analysis was performed using the program Multicycle AV (Phoenix Flow Systems, San Diego, CA).
000 cells per ml in 6-well plates (1 ml per well). Cells were allowed to adhere for 24 h, and then they were treated with the vehicle (0.1% ethanol) or 34. After exposure for 24 h, cell media were discarded and cells were washed with 400 μl of PBS–EDTA (1% BSA) and harvested with 400 μl of trypsin–EDTA (1% BSA) (37 °C per 2 min). Cells were pulled down by centrifugation at 1300 rpm per 3 min; the cell pellet was washed once with 400 μl of PBS–EDTA (1% BSA) and again centrifuged at the same speed/time. Cells were fixed by −20 °C overnight incubation with 70% ethanol (9.5 ml) in 1 × PBS solution (0.5 ml). Fixed cells were pulled down, washed once with PBS–EDTA (1% BSA) and stained at 37 °C for 2 h with propidium iodide solution (0.1 mg ml−1 in PBS) and RNase, DNase-free (10 μg ml−1). Stained cells were analyzed by using a Guava EasyCyte™ flow cytometer (Merck Millipore, Billerica, MA). Data analysis was performed using the program Multicycle AV (Phoenix Flow Systems, San Diego, CA).
Apoptosis assay
HGC-27 cells were plated in 6-well plates (100000 cells per ml per well) and were treated with compound 34; 0.1% DMSO was used as a vehicle control. After induction for 24 h, both treated and untreated cells were collected (trypsin and PBS with 5% BSA) and the cells were washed with PBS containing 5% BSA. The percentages of apoptotic cells were estimated by staining with Annexin-V-FITC and PI (Annexin-V- FITC apoptosis detection kit, Cell Signaling). Almost 10000 events were collected for each sample and analyzed by flow cytometry. In brief, cells were incubated with 96 μl of binding buffer, 1 μl of Annexin V-FITC and 12.5 μl of PI solution at room temperature for 10 min in the dark. After a final addition of 150 μl of PBS, HGC-27 cells were immediately analyzed on a Guava EasyCyte™ single sample flow cytometer. Samples were excited by a light wavelength of 488 nm with barrier filters of 525 nm and 575 nm for FITC fluorescence and PI detection, respectively. Data were analyzed by InCyte Software and plotted for Annexin V-FITC and PI in a two-way dot plot. Live, early apoptotic, late apoptotic and necrotic cells are designed as Annexin−/PI−, Annexin+/PI−, and Annexin+/PI+, respectively. Results are shown as the percentage of cells.
Western blotting
For protein analysis, 1 × 10⁵ cells were plated in 6-well plates and were allowed to adhere for 24 h. In the samples containing protease inhibitors, cells were treated with protease inhibitors, 1 μl of pepstatin A at a concentration of 1 mg ml−1 in 9:1 of methanol and acetic acid (1%), and 1 μl of E-64-D at a concentration of 10 mg ml−1 in ethanol. After 2 h of incubation, HGC-27 cells were treated with 34 (2 μM) or DMSO (0.1%) for 24 h, collected with trypsin, and then the pellets were washed twice with cold PBS. Cell lysis was performed with 30 μl of lysis buffer (50 mM Tris-Cl (pH 7.5), 150 mM NaCl, 0.5% Triton X-100, 2 μg ml−1 aprotinin, 5 μg ml−1 leupeptin and 1 mM PMSF) by five cycles of bath sonication (20 s)/rest on ice (20 s). Then samples were kept on ice for 30 min and centrifuged for 3 min at 10000 rpm. Supernatants were collected and protein determination was performed using the Micro BCA™ protein assay kit. Supernatants were combined with Laemmli sample buffer and boiled for 5 min. Equal amounts of proteins (20 μg) were loaded onto a 15% polyacrylamide gel, separated by electrophoresis at 140 V per 60 min, and transferred onto a polyvinylidene fluoride (PVDF) membrane (100 V/1 h). PVDF membranes were then cut to separate LC3B and β-actin bands. Unspecific binding sites were then blocked with 5% milk in TBS with 0.1% Tween 20 (TBST) in the case of the LC3B membrane and with 3% BSA in TBST in the case of the anti-β-actin antibody. The anti-LC3B antibody was diluted 1:1000 in 5% milk in TBST, and the anti-β-actin antibody was diluted 1:2000 in 3% BSA in TBST. Membranes were incubated overnight at 4 °C under gentle agitation. After washing with TBST, membranes were probed with the corresponding secondary antibody for 1 h at 25 °C (LC3B: 1:1000 dilution in 3% BSA in TBST; actin: 1:10000 dilution in 5% milk in TBST). Antibody excess was eliminated by washing with TBST and protein detection was carried out using ECL and membrane scanning with a LI-COR C-DiGit® blot scanner. Band intensities were quantified by LI-COR Image Studio Lite Software. All experiments were performed in triplicate and band intensities were expressed as the relation of the samples with the control.
Mitochondrial membrane potential
HGC-27 cells were seeded at a density of 100000 cells per ml (1 ml per well) in 6-well plates, cultured at 37 °C and 5% CO2, and allowed to adhere for 24 h. Cells were treated with 34 at various concentrations (1 μM, 2 μM, 8 μM in DMSO) or DMSO (0.2%) as negative control (vehicle group). After 24 h of incubation, cells were collected (trypsin with 5% BSA) and washed with PBS containing 5% BSA. The cell pellet was then resuspended in 200 μl of medium and seeded in a 96-well plate (1 sample per well). 4 μl of a previously prepared 50× solution of JC-1 and 7-AAD were added to each well and cells were incubated for 30 min at 37 °C and 5% CO2. Finally, cells were collected in Eppendorf flasks and analysed on a Guava EasyCyte™ Single Sample Flow Cytometer. Data were analyzed by InCyte Software and plotted for orange (JC-1 aggregates) and green fluorescence (JC-1 monomers).
ROS detection
The oxidative metabolism was examined in triplicate samples by using 2′,7′-dichlorofluorescein diacetate, a non-fluorescent membrane-permeable compound which can be oxidised to 2′,7′-dichlorofluorescein in case the cell has high levels of reactive oxygen species.HGC-27 cells were seeded at a density of 0.1 × 10⁶ cells per ml, 0.1 ml per well (96-well plates), cultured at 37 °C and 5% and allowed to adhere for 24 h. 2′,7′-Dichlorofluorescein diacetate (25 μM) in DMSO was then added and incubated for 1 h. Compound 34 was then added at various concentrations (24 to 1.40 μM). DMSO and H2O2 were added too as a negative and positive control, respectively. After 5 h of incubation, fluorescence was measured by a microplate reader (Spectramax) at an excitation wavelength of 485 nm and an emission wavelength of 538 nm.
Acknowledgements
Funding from the Marie Curie Career Integration Grants (Grant PCIG12-GA-2012-333835), the Max Planck Society (Partner Groups), the Ministerio de Economia y Competitividad (Grant CTQ2013-44334-P), the University of Zaragoza (JIUZ-2014-CIE-07), the High Council of Scientific Investigation (CSIC) (PIE-201580I010) and Government of Aragon DGA (Research Group E-104) is gratefully acknowledged. J. V. A.-R. thanks the DGA for his predoctoral contract. G. T. thanks all the members of the RUBAM group for their helpful and generous support.Notes and references
- J. P. Malerich, K. Hagihara and V. H. Rawal, J. Am. Chem. Soc., 2008, 130, 14416–14417 CrossRef CAS PubMed.
- P. Chauhan, S. Mahajan, U. Kaya, D. Hack and D. Enders, Adv. Synth. Catal., 2015, 357, 253–281 CrossRef CAS.
- J. V. Alegre-Requena, Synlett, 2014, 25, 298–300 CAS.
- J. Aleman, A. Parra, H. Jiang and K. A. Jørgensen, Chem. – Eur. J., 2011, 17, 6890–6899 CrossRef CAS PubMed.
- D. Quiñonero, C. Garau, A. Frontera, P. Ballester, A. Costa and P. M. Deya, Chem. – Eur. J., 2002, 8, 433–438 CrossRef.
- C. Rotger, B. Soberats, D. Quiñonero, A. Frontera, P. Ballester, J. Benet-Buchholz, P. M. Deyà and A. Costa, Eur. J. Org. Chem., 2008, 1864–1868 CrossRef CAS.
- R. I. Storer, C. Aciro and L. H. Jones, Chem. Soc. Rev., 2011, 40, 2330–2346 RSC.
- E. T. Buurman, M. A. Foulk, N. Gao, V. A. Laganas, D. C. McKinney, D. T. Moustakas, J. A. Rose, A. B. Shapiro and P. R. Fleming, J. Bacteriol., 2012, 194, 5504–5512 CrossRef CAS PubMed.
- T. S. Elliott, A. Slowey, Y. Ye and S. J. Conway, MedChemComm, 2012, 3, 735–751 RSC.
- P. M. Gloria, J. Gut, L. M. Gonçalves, P. J. Rosenthal, R. Moreira and M. M. Santos, Bioorg. Med. Chem., 2011, 19, 7635–7642 CrossRef CAS PubMed.
- S. P. Kumar, P. M. Gloria, L. M. Gonçalves, J. Gut, P. J. Rosenthal, R. Moreira and M. M. Santos, MedChemComm, 2012, 3, 489 RSC.
- S. K. Narasimhan, P. Sejwal, S. Zhu and Y. Y. Luk, Bioorg. Med. Chem., 2013, 21, 2210–2216 CrossRef CAS PubMed.
- F. Olmo, C. Rotger, I. Ramirez-Macias, L. Martinez, C. Marin, L. Carreras, K. Urbanova, M. Vega, G. Chaves-Lemaur, A. Sampedro, M. J. Rosales, M. Sanchez-Moreno and A. Costa, J. Med. Chem., 2014, 57, 987–999 CrossRef CAS PubMed.
- C. Schieber, A. Bestetti, J. P. Lim, A. D. Ryan, T. L. Nguyen, R. Eldridge, A. R. White, P. A. Gleeson, P. S. Donnelly, S. J. Williams and P. Mulvaney, Angew. Chem., Int. Ed., 2012, 51, 10523–10527 CrossRef CAS PubMed.
- Q. Zhang, Z. Xia, M. J. Mitten, L. M. Lasko, V. Klinghofer, J. Bouska, E. F. Johnson, T. D. Penning, Y. Luo, V. L. Giranda, A. R. Shoemaker, K. D. Stewart, S. W. Djuric and A. Vasudevan, Bioorg. Med. Chem. Lett., 2012, 22, 7615–7622 CrossRef CAS PubMed.
- X. Zhang, Z. Zuo, J. Tang, K. Wang, C. Wang, W. Chen, C. Li, W. Xu, X. Xiong, K. Yuntai, J. Huang, X. Lan and H. B. Zhou, Bioorg. Med. Chem. Lett., 2013, 23, 3793–3797 CrossRef CAS PubMed.
- J. W. Janetka and S. Ashwell, Expert Opin. Ther. Pat., 2009, 19, 165–197 CrossRef CAS PubMed.
- P. Villalonga, S. Fernandez de Mattos, G. Ramis, A. Obrador-Hevia, A. Sampedro, C. Rotger and A. Costa, ChemMedChem, 2012, 7, 1472–1480 CrossRef CAS PubMed.
- M. P. Dwyer, Y. Yu, J. Chao, C. Aki, J. Chao, P. Biju, V. Girijavallabhan, D. Rindgen, R. Bond, R. Mayer-Ezel, J. Jakway, R. W. Hipkin, J. Fossetta, W. Gonsiorek, H. Bian, X. Fan, C. Terminelli, J. Fine, D. Lundell, J. R. Merritt, L. L. Rokosz, B. Kaiser, G. Li, W. Wang, T. Stauffer, L. Ozgur, J. Baldwin and A. G. Taveras, J. Med. Chem., 2006, 49, 7603–7606 CrossRef CAS PubMed.
- J. V. Alegre-Requena, E. Marqués-López and R. P. Herrera, RSC Adv., 2015, 5, 33450–33462 RSC.
- J. V. Alegre-Requena, E. Marqués-López, P. J. Sanz Miguel and R. P. Herrera, Org. Biomol. Chem., 2014, 12, 1258–1264 CAS.
- E. Marqués-López, J. V. Alegre-Requena and R. P. Herrera, Eu. Pat. EP14382260., 2014 Search PubMed.
- A. Cervantes, D. Roda, N. Tarazona, S. Rosello and J. A. Perez-Fidalgo, Cancer Treat. Rev., 2013, 39, 60–67 CrossRef CAS PubMed.
- A. Jemal, F. Bray, M. M. Center, J. Ferlay, E. Ward and D. Forman, CA Cancer J. Clin., 2011, 61, 69–90 CrossRef PubMed.
- O. Kepp, L. Galluzzi, M. Lipinski, J. Yuan and G. Kroemer, Nat. Rev. Drug Discovery, 2011, 10, 221–237 CrossRef CAS PubMed.
- G. Liu, J. K. Lynch, J. Freeman, B. Liu, Z. Xin, H. Zhao, M. D. Serby, P. R. Kym, T. S. Suhar, H. T. Smith, N. Cao, R. Yang, R. S. Janis, J. A. Krauser, S. P. Cepa, D. W. Beno, H. L. Sham, C. A. Collins, T. K. Surowy and H. S. Camp, J. Med. Chem., 2007, 50, 3086–3100 CrossRef CAS PubMed.
- H. G. Yu, Y. W. Ai, L. L. Yu, X. D. Zhou, J. Liu, J. H. Li, X. M. Xu, S. Liu, J. Chen, F. Liu, Y. L. Qi, Q. Deng, J. Cao, S. Q. Liu, H. S. Luo and J. P. Yu, Int. J. Cancer, 2008, 122, 433–443 CrossRef CAS PubMed.
- V. Vichai and K. Kirtikara, Nat. Protoc., 2006, 1, 1112–1116 CrossRef CAS PubMed.
- S. Elmore, Toxicol. Pathol., 2007, 35, 495–516 CrossRef CAS PubMed.
- A. B. Berger, K. B. Sexton and M. Bogyo, Cell Res., 2006, 16, 961–963 CrossRef CAS PubMed.
- S. Aits and M. Jaattela, J. Cell Sci., 2013, 126, 1905–1912 CrossRef CAS PubMed.
- T. Kirkegaard and M. Jaattela, Biochim. Biophys. Acta, Gen. Subj., 2009, 1793, 746–754 CrossRef CAS PubMed.
- H. Sawai and N. Domae, Biochem. Biophys. Res. Commun., 2011, 411, 569–573 CrossRef CAS PubMed.
- G. Triola, Tetrahedron, 2015, 71, 387–406 CrossRef CAS.
- R. Castino, I. Fiorentino, M. Cagnin, A. Giovia and C. Isidoro, Toxicol. Sci., 2011, 123, 523–541 CrossRef CAS PubMed.
- M. Elgendy, C. Sheridan, G. Brumatti and S. J. Martin, Mol. Cell, 2011, 42, 23–35 CrossRef CAS PubMed.
- M. Katayama, T. Kawaguchi, M. S. Berger and R. O. Pieper, Cell Death Differ., 2007, 14, 548–558 CrossRef CAS PubMed.
- G. Kroemer and B. Levine, Nat. Rev. Mol. Cell Biol., 2008, 9, 1004–1010 CrossRef CAS PubMed.
- M. Jung, J. Lee, H. Y. Seo, J. S. Lim and E. K. Kim, PLoS One, 2015, 10, e0116972 Search PubMed.
- J. D. Ly, D. R. Grubb and A. Lawen, Apoptosis, 2003, 8, 115–128 CrossRef CAS PubMed.
- Y. Tsujimoto and S. Shimizu, Apoptosis, 2007, 12, 835–840 CrossRef CAS PubMed.
- M. C. Brezak Pannetier and A. Bourgouin, Pat. WO2009/034258 A1, 2009 Search PubMed.
- W. Yang and D. M. Du, Adv. Synth. Catal., 2011, 353, 1241–1246 CrossRef CAS.
- H. Jiang, M. W. Paixao, D. Monge and K. A. Jørgensen, J. Am. Chem. Soc., 2010, 132, 2775–2783 CrossRef CAS PubMed.
- H. Konishi, T. Y. Lam, J. P. Malerich and V. H. Rawal, Org. Lett., 2010, 12, 2028–2031 CrossRef CAS PubMed.
- Y. Zhu, J. P. Malerich and V. H. Rawal, Angew. Chem., Int. Ed., 2010, 49, 153–156 CrossRef CAS PubMed.
- P. Signorelli, J. M. Munoz-Olaya, V. Gagliostro, J. Casas, R. Ghidoni and G. Fabrias, Cancer Lett., 2009, 282, 238–243 CrossRef CAS PubMed.
Footnotes |
| † The authors declare no competing interests. |
| ‡ Electronic supplementary information (ESI) available. See DOI: 10.1039/c5md00515a |
| § These authors equally contributed to this manuscript. |
| This journal is © The Royal Society of Chemistry 2016 |