 Open Access Article
Creative Commons Attribution 3.0 Unported Licence
DROPLAY: laser writing of functional patterns within biological microdroplet displays†
Chi Long
Chan
a,
Guido
Bolognesi
 a,
Archis
Bhandarkar
b,
Mark S.
Friddin
a,
Nicholas J.
Brooks
a,
John M.
Seddon
a,
Robert V.
Law
a,
Laura M. C.
Barter
a and
Oscar
Ces
*a
a,
Archis
Bhandarkar
b,
Mark S.
Friddin
a,
Nicholas J.
Brooks
a,
John M.
Seddon
a,
Robert V.
Law
a,
Laura M. C.
Barter
a and
Oscar
Ces
*a
aDepartment of Chemistry, Imperial College London, London, UK. E-mail: o.ces@imperial.ac.uk
bDepartment of Biological Engineering, Massachusetts Institute of Technology, USA
First published on 18th October 2016
Abstract
In this study, we introduce an optofluidic method for the rapid construction of large-area cell-sized droplet assemblies with user-defined, re-writable, two-dimensional patterns of functional droplets. Light responsive water-in-oil droplets capable of releasing fluorescent dye molecules upon exposure were generated and self-assembled into arrays inside a microfluidic device. This biological architecture was exploited by the scanning laser of a confocal microscope to ‘write’ user defined patterns of differentiated (fluorescent) droplets in a network of originally undifferentiated (non-fluorescent) droplets. As a result, long lasting images were produced on a droplet fabric with droplets acting as pixels of a biological monitor, which can be erased and re-written on-demand. Regio-specific light-induced droplet differentiation within a large population of droplets provides a new paradigm for the rapid construction of bio-synthetic systems with potential as tissue mimics and biological display materials.
Introduction
Surfactant coated droplets, encapsulating purified biochemical components, have been adopted as cell-sized microreactors capable of mimicking the biological responses of intracellular circuits and showing cell-like self-organised behaviours (e.g. oscillations, bistability, etc.).1 Furthermore, surfactant coated droplet assemblies have been extensively used for diagnostic and screening applications (e.g. digital PCR,2 single cell analysis3etc.), molecular transport studies4 and synthesis of advanced materials (e.g. photonic crystals5). By replacing surfactants with lipids, 2D and 3D water-in-oil droplet assemblies have also been used for the manufacturing of tissue-like materials and bio-inspired functional devices.6–93D aqueous microdroplet networks are typically formed by either i) droplet self-assembly in microfluidic devices or ii) assisted assembly via individual droplet manipulation. Spatial confinement and capillary forces can be effectively used to direct the self-assembly of emulsion droplets in well-defined 3D networks within microfluidic devices with accurate control over droplet position and content together with high-throughput performance.10,11 However, such accurate control has only been demonstrated for droplet assemblies with a limited area (namely, no more than three droplets in the network width and depth directions).10 Even though 3D large-area multi-layered droplet networks can be self-assembled within a microfluidic device,12 at present no method exists for addressing the content of pre-selected subsets of droplets in these self-assembled large-area networks. This currently limits the complexity of the network topology attainable through microfluidics. Higher levels of network complexity can be achieved when the droplet assembly is constructed by placing individual droplets in pre-defined geometrical configurations via a printing nozzle,13 magnetically-driven beads14 or optical tweezers.15 Such assembly methods, however, are relatively slow compared to the microfluidic approaches since droplets are handled one at a time and the desired collective functions (e.g. biochemical reactions, content release, etc.) may begin before the network is fully assembled.13 Booth et al.16 have recently introduced a clever solution to the latter problem by regulating the activation of the designed functions of a 3D printed droplet network (e.g. cell-free protein expression, intra-droplet electrical communication) through an external light trigger.
In this paper, we introduce an alternative route for the formation of 3D surfactant coated droplet networks, that are not based upon droplet interface bilayers, and use an optofluidic approach, which combines the fast generation and high-throughput capabilities afforded by microfluidic fabrication and the high levels of network complexity of the assisted-assembly methods. This new strategy builds upon robust microfluidic approaches12,17 to produce self-assembled large-area highly packed multi-layered arrays of undifferentiated droplets where the size and contents of each droplet is identical. In our proof-of-concept study, the aqueous droplets contain fluorescent dye molecules caged to a photolabile protecting group, which prevents the molecules from fluorescing. Subsequently, selected groups of droplets can be differentiated into ‘specialised’ droplets by activating their content upon exposure to light, thereby leading to the production of uncaged dye molecules. As a result, 2D complex shaped patterns of activated (fluorescent) droplets could be written into the droplet fabric by using a steerable laser beam as a ‘pen’ and the 3D droplet assembly as a microdroplet display – we hence named this technique DROPLAY. The design of our system prevents cross-talk between adjacent droplets leading to biological images with regio-specific lifetimes exceeding 30 minutes. Moreover, we also show that these patterns can be subsequently erased and re-written on-demand. The proposed light responsive mechanism was selected for demonstration purposes and it can be replaced with other mechanisms through the appropriate selection of the undifferentiated droplet contents and the properties of the activating laser beam.
Experimental
The microfluidic platform
CMNB-caged fluorescein, DMSO, Span 80 and hexadecane oil were purchased from Sigma Aldrich and used as supplied. Microdroplets of an aqueous solution of 2.4 mM CMNB-caged fluorescein and 8% v/v DMSO were produced in a hexadecane and 3% w/v Span 80 solution by means of a glass microfluidic device (Dolomite 3200137) with a cross-junction 14 μm in width and 17 μm in depth. The chosen surfactant concentration assured low droplet coalescence rates and thus high droplet network stability. Higher values of concentrations were also tested but they resulted in the formation of opaque surfactant aggregates in the continuous phase which interfered with the laser-writing process. Syringe pumps (Aladdin-2000 WPI) were used to supply the droplet generator chip with the aqueous and oil phases. The flow rates of the dispersed and continuous phases were set to Qc = 1 μL min−1 and Qd = 3 μL min−1, respectively. The resulting droplet diameter was 13.5 ± 0.5 μm. After generation, droplets were transferred and stored in a separate homemade microfluidic chip with an observation chamber, which consisted of a long shallow channel 5 cm in length. This device was obtained by sandwiching a laser-cut acrylic film (Weatherall) between a pre-drilled microscope glass slide and a cover slip, joined together by double sided adhesive (3M). The high Young modulus of the glass slides assured that the rectangular cross-section of the microfluidic chamber did not deform under the effect of pressure even for chamber width/depth ratio up to 30. FEP tubing (Dolomite 3200063) was used to connect the syringes and the microfluidic devices. After droplet network formation, the flow in the observation chamber chip was stopped by using two-way microfluidic valves (Upchurch P-732) fitted at the inlet and outlet of the device.The optical set-ups
Characterisation and optimisation of microfluidic droplet generation were conducted on an inverted microscope (Olympus IX-81) equipped with a 5× 0.15 NA and 10× 0.3 NA objectives and a CCD camera (Q-Imaging Retiga EXi fast). Both fluorescence imaging and laser writing operations were performed on an inverted confocal laser scanning microscope (Zeiss LSM-510) fitted with a 10× 0.3 NA objective and a CCD camera (Zeiss AxioCam HRm). The spatially selective activation of droplet patterns was achieved by using the region and bleaching functions of the confocal microscope (see ESI†). These functions allow the user to draw regions in the objective field of view and to expose these regions to the chosen laser source. In our experiments, a diode laser (30 mW @ λ = 405 nm) was used for activating the droplets whereas an argon laser (30 mW @ λ = 488 nm) was used for exciting the fluorescein dye released in those droplets. To erase the image, the whole display was exposed to the excitation laser at full power. New patterns were subsequently re-written by performing additional passes with the activating laser as described.Results
Microfluidic generation of droplet assembly and light-induced droplet differentiation
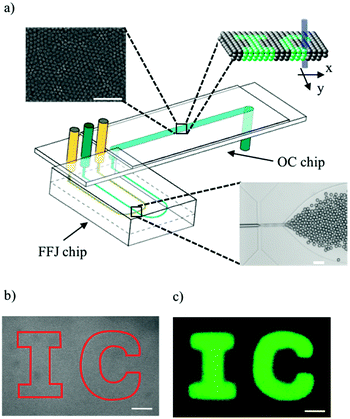
A commercially available microfluidic cross-junction device was used to generate monodisperse aqueous droplets about 1 pL in volume, containing fluorescein bis-(5-carboxymethoxy-2-nitrobenzyl) ether, dipotassium salt (CMNB-caged fluorescein), in a hexadecane solution. The CMNB groups prevent the dye molecules from fluorescing, but upon exposure to a laser beam at the appropriate wavelength, uncaged fluorescein molecules can be produced. Span 80 surfactant was added to the oil phase for stabilising droplets against coalescence. Any other surfactant or lipid molecules, which accomplish the same functions, can potentially be used. After formation, droplets were transferred into a separate downstream observation chamber chip, consisting of a long shallow channel 5 cm in length and 200 μm in depth (Fig. 1a). The density contrast between the two phases caused the droplet sedimentation and accumulation at the bottom wall of the observation channel. As a result, the droplets stacked into multiple layer assemblies, thereby forming 3D droplet networks (Fig. 1a – insets). These networks self-assembled while being simultaneously advected by the oil phase flow in the observation channel. By testing chamber chips with varying widths (i.e. 2 mm, 4 mm and 6 mm), we observed that the droplet self-assembly was not affected by this parameter and the droplet networks always extended over the full width of the channel. After stopping the flow in the observation channel by means of microfluidic valves, the laser beam was used to scan through the network in x and y directions to activate droplets in user-defined regions, as shown schematically in Fig. 1a. The depth of focus of the laser beam was much larger than the channel depth so that all layers of the 3D droplet networks were simultaneously exposed to the activating laser, as exemplified in inset of Fig. 1a. A brightfield micrograph of a 3D droplet network before activation and a fluorescence micrograph after activation are shown in Fig. 1b and c respectively. By directing the laser beam within the region defined by the solid line in Fig. 1b, a 2D pattern of fluorescent droplets, displaying the acronym ‘IC’, was obtained. It is worth noting that single-layer 2D droplet assemblies could be generated via the same approach by using observation chamber chips of 30 μm in depth (data not shown). However, 3D assemblies minimise the empty gaps between adjacent droplets, which occur in 2D architectures due to random packing defects. Therefore, to reduce the area of these inactive (‘dark’) regions of the display, 3D droplet assemblies were preferred to 2D ones.Many experimental studies have elucidated how droplet formation in cross-junction devices is governed by many parameters such as the flow rates,18 interfacial tension,19 the channel geometry20 and wettability,21 as well as the surfactant concentration.22 By exploring this parameter space, we identified the liquid flow rates and surfactant concentration leading to the formation of stable and highly packed multiple layer droplet assemblies in our microfluidic platform. These networks showed high stability against coalescence and absence of large empty gaps between neighbouring droplets (see top inset of Fig. 1a). As shown in Fig. 1b and c, the generated multiscale droplet fabric provided a good spatial resolution for the light-written patterns as well as full activation (no gaps) of the selected regions.
Light activation mechanism
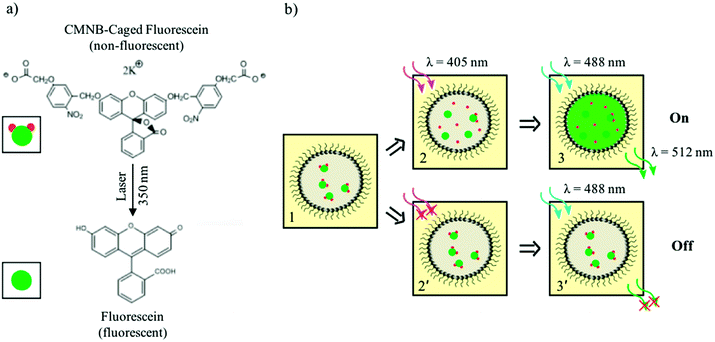
The uncaging of CMNB-caged fluorescein was used as the light sensitive mechanism which enabled the differentiation of pre-defined droplet patterns in the networks. A schematic of this reaction is shown in Fig. 2a. Fluorescein is a common fluorescent dye with an excitation wavelength around 488 nm. In the caged form, two CMNB groups (the caging groups) are bonded to the fluorescein molecule to prevent fluorescence emission. Upon exposure to a high intensity light source at wavelengths near 350 nm, the bonds between the two CMNB groups and fluorescein break, releasing the dye molecules and hence allowing emission at the fluorescein excitation wavelength. It is worth mentioning that only a fraction of the uncaged fluorescein, encapsulated in the droplets, reacts upon exposure, the total concentration of the reaction product depending on the activating laser intensity. Fig. 2b shows the droplet differentiation pathways, based on this light-induced fluorescence response mechanism. Initially, all droplets contain the same amount of caged dye (panel 1). By scanning the activating laser beam (405 nm) through the sample, the uncaged dye is produced only within the exposed droplets, remaining confined therein (panel 2). Upon sample illumination at the fluorescein excitation wavelength (488 nm), the activated droplets fluoresce (panel 3) whereas the non-exposed ones do not (panel 2′ and 3′). Both droplet activation and fluorescence imaging were performed in a laser scanning confocal microscope, equipped with two laser sources. The first laser beam (wavelength λ = 405 nm) was used as a laser pen on a droplet display by creating desired patterns through the uncaging of dye molecules. More specifically, the bleaching function of the microscope software allowed the user to direct the activating light beam at fixed power level (i.e. 30 mW) on well-defined regions having arbitrary complex shapes. The uncaging of fluorescein dye was hence induced only within the pre-selected regions, the reaction yield increasing with the electromagnetic energy delivered by the activating laser beam. For high-density droplet networks, each droplet effectively acted as a pixel of a fluorescent display by retaining the uncaged dye and producing reasonably stable and long lasting fluorescence image as illustrated in Fig. 1b. As a further level of control, the fluorescence intensity of subsets of activated pixels could also be adjusted by scanning the activating laser over the selected regions several times, thereby increasing the local concentration of released dye. The second laser (wavelength λ = 488 nm) was used for imaging the created patterns by illuminating the entire field of view and exciting the uncaged dye in the activated droplets. The wavelength of this laser source was chosen well above the activation wavelength in order to prevent accidental removal of CMNB groups during imaging. A power level of 11 mW was used for the excitation beam so that the effects of dye photobleaching were negligible.Creation of user-defined patterns
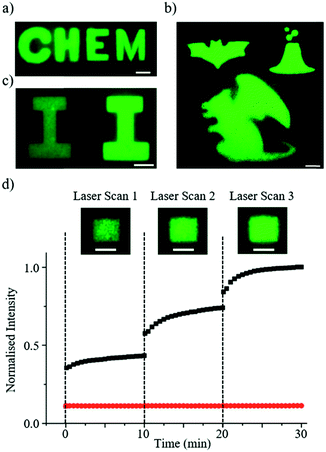
Fig. 3 shows some examples of the complex patterns achieved by the DROPLAY technique. The patterns displaying alphabetical letters (Fig. 3a and c) were obtained by selecting the photo-activated regions of interest as a combination of simple geometrical shapes (e.g. rectangles, sphere, ellipse, etc.). More complex patterns (Fig. 3b) could be achieved by manually drawing the regions of interest through the microscope software. Since the multiscale microdroplet fabric extended seamlessly for few cm across the length and few mm across the width of the observation chamber, several patterns could be created within the same sample. The control over the intensity of the fluorescent signal via the regulation of the activating laser exposure is demonstrated in Fig. 3c, where two patterns with the same shape but different intensity levels are displayed. It is worth mentioning that, occasionally, for patterns exposed to the same amount of light-activation energy the resulting fluorescence intensity might be slightly inhomogeneous in space. This might be due to either local defects of the droplet assembly or to unavoidable imperfections in the optical system.To characterise the kinetics of the activation mechanisms, we analysed the display fluorescence intensity I(t) after multiple exposures to the activating laser beam at fixed intensity. To this end, we define the relative intensity parameter  where Ieq is the fluorescence intensity achieved after completion of the uncaging reaction initiated at time t0. The parameter ε quantifies the extent of the reaction and increases from zero at the beginning of the reaction to 1 at the end. Fig. 3d shows the average intensity value I against time for an activated region about 100 μm × 100 μm in size (see insets), which was exposed to the activating laser beam at times t = 0, 10, 20 min. The constant average intensity of an un-exposed area of the display is also shown. The fast response of the light-sensitive display is demonstrated by the fact that the uncaged dye release (i.e. ε > 0) occurs immediately after laser activation and the parameter ε reaches 50% within a minute and 90% within five minutes from the exposure. In our experiments, no photobleaching of the uncaged dye molecules were observed during sample imaging (data shown in ESI†).
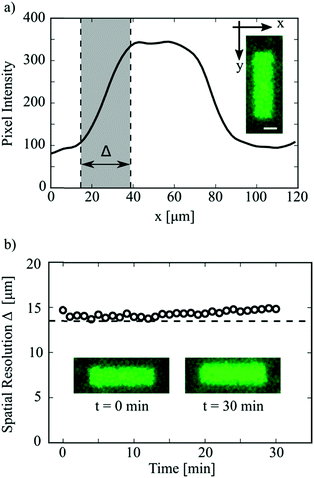
The spatial resolution of the DROPLAY technique was quantified by analysing the fluorescence intensity profile of the activated regions. Fig. 4a shows the intensity profile for a rectangular pattern (see inset), averaged over the longitudinal direction y. For droplets sitting at the boundaries of the activated area, only a fraction of their volume was exposed to the activating laser beam. As a result, a lower amount of uncaged fluorescein reacted and the corresponding fluorescent intensity was intermediate between those of fully-activated and non-activated droplets. This resulted in the formation of a transition region in the intensity profile (shaded area in Fig. 4a) whose width Δ is a measure of the spatial resolution of the laser-writing technique. The detailed procedure for the calculation of Δ is discussed in the ESI.† The variation of spatial resolution Δ over time is plotted in Fig. 4b. It is not surprising that the initial value of Δ is very close to the droplet mean diameter (dashed line in Fig. 4b), which ultimately determines the display resolution.
As shown in the insets of Fig. 4b, the overall shape of an activated region was maintained after 30 minutes from the exposure, even though a slight blurring of the pattern edges (i.e. higher values of Δ) was observed. Occasionally, the parameter Δ almost doubled after 30 minutes from activation (see ESI†). Further experiments (see ESI†) suggested that this weak blurring effect might be due to the slow leakage of the uncaged dye across adjacent droplets via the continuous oil phase. The leakage is likely mediated by the Span 80 surfactant as also reported in other studies.4,23 Nevertheless, this slight blurring of the activated regions, observed for our model system on a time scale of tens of minutes, does not affect the validity of the proposed method. If one had to prevent the blurring of the pattern boundaries over prolonged times (i.e. hours), the use of additives in the dispersed phase such as sodium chloride, Bovine Serum Albumin (BSA) and sugar24 would have to be considered.
Erasing and re-writing of user-defined patterns
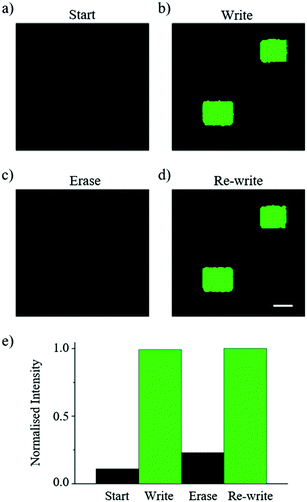
The ability to erase and re-write an image using the DROPLAY technique is demonstrated in Fig. 5. The droplet display (Fig. 5a) was patterned (Fig. 5b) using the laser as described. At this point all of the droplets in the display were exposed to the excitation laser which served to bleach the display and erase the pattern (Fig. 5c). By using the maximum available power level of the excitation laser (i.e. 30 mW), the erasing process was completed after 10 minutes of continuous exposure. In this configuration, the background signal of the whole display returns to a similar state to when the first laser activation was performed (Fig. 5e). The display ‘fall time’ (i.e. the time required to switch off the activated pixels) could be shortened by using laser sources with higher power. With a homogenous background signal across the display, excess caged dye can be released by additional laser passes and the droplet display is subsequently re-written (Fig. 5d and e). In principle this process can be repeated several times since only a fraction of the caged fluorescein reacts upon exposure to the activating laser. This capability in combination with the temporal control of droplet activation adds an additional layer of functionality to the DROPLAY technique, enabling single or multiple patterns to be constructed, modified, enhanced, erased and re-written in predefined time sequences.Discussion
The use of microfluidic approaches for the formation of self-assembled droplet networks offers several significant advantages such as accurate control over droplet size and composition, high throughput and fast construction of large droplet assemblies. The appropriate combination of surfactant concentration, channel depth and fluidic flow rates enables the formation of lattices of thousands of droplets in a close packed arrangement on a time scale of few minutes. As a consequence, the microfluidic methods outperform – in terms of fabrication speed – any assembling approach based on individual droplet manipulation. Previously, microfluidic fast assembly of large-area multi-layered droplet lattices came at the expense of a lack of control over droplet positioning and content. However, such control is essential for the formation of assemblies made of two or more droplet populations with distinct properties (e.g. composition, function, etc.). We overcome this limitation by introducing a light-controlled droplet differentiation step so that complex patterns of activated droplets could be created, erased or re-written in few minutes within droplet assemblies originally consisting of identical droplets. Despite the ease of implementation of our laser-writing technique, in this study the user-defined droplet patterns were restricted to 2D geometries. More sophisticated laser scanning techniques (e.g. adaptive optics) could be considered to enable the formation of activated regions with controllable 3D geometries.Our proof of concept work demonstrates an innovative optofluidic approach for the construction and spatial activation of re-writable centimetre-sized 3D assemblies of micron-scale droplets. As the field of bottom-up synthetic biology continues to develop, the construction of biological materials operating across multiple length scales is crucial to unlocking applications ranging from large scale biosensors, display monitors based on biological components, artificial tissues that can sense and respond to their environment and regio-specific delivery systems. To this end, 2D and 3D assemblies of lipid-coated water-in-oil microdroplets have been demonstrated as a promising platform for the construction of prototissues and micro-/nano-devices exhibiting collective functional behaviours. In our model system, Span 80 surfactant was used for the microfluidic emulsification and droplet self-assembly processes but the same results could be achieved by replacing the surfactant with lipids, as demonstrated by previous work from our group10,11,25 and others.26,27 In this context, several recent studies have proposed light stimulus as the preferred external trigger to initiate and regulate functions and activities in lipid-based artificial cell systems,16,28–32 including membrane pore formation and gene expression. Bio-compatibility, efficiency, great flexibility, fast and accurate control over spatial and temporal distributions are some of the key advantages of using light sources as an external trigger for biological and chemical systems. Furthermore, the properties of light (e.g. frequency, power, intensity distribution, etc.) can be easily tuned in order to trigger the desired response from the examined biochemical systems, which can also be re-addressed at will either to enhance, erase or to re-activate targets of interest.
The emergence of these light-activated approaches in bottom-up synthetic biology demonstrates the huge potential impact that our technique has in the field by enabling the regio-specific light activation of desired responses in bio-inspired artificial systems based on large-area droplet assemblies. By carefully selecting the photo-chemical reaction for droplet activation, the differentiation of droplet assemblies into sub-populations with varying concentrations of reaction products could be applied for high-throughput screening of biochemical reaction conditions, for barcoding as well as for highlighting those droplets where the reaction of interest (e.g. protein expression) has successfully occurred. Light-induced patterning of large-area droplet fabrics have also significant potential for use in manufacturing of artificial tissues with spatio-temporal control over contents and functions as well as biosensing applications for detection and amplification of biological signals.
Conclusions
In summary, DROPLAY is a novel optofluidic technique for the formation of user-defined, re-writable, light-activated patterns on a large-area multiscale biological display. Complex shaped patterns of activated droplets can be written, erased and re-written in a spatio-temporally controlled manner onto droplet fabrics with the latter acting as a fluorescent monitor. The proposed method also enables control of the intensity level of the activated areas, which is analogous to the regulation of the pixel shades of grey in a monochromatic LCD monitor. The ease of implementation of our technique, which relies on commercial instrumentation such as a microfluidic droplet generator and a laser scanning confocal microscope, will facilitate the adoption of DROPLAY to a wide range of applications, including large scale biosensors, biological displays and artificial tissues.Acknowledgements
Confocal microscopy experiments were conducted at the Facility for Imaging by Light Microscopy (FILM) of Imperial College London. This research was funded by EP/J017566/1, EP/L015498/1 and EP/K503733/1 grants. All data created during this research are openly available from Imperial College London, please see contact details at www.imperial.ac.uk/membranebiophysics.References
- H. W. H. van Roekel, B. J. H. M. Rosier, L. H. H. Meijer, P. A. J. Hilbers, A. J. Markvoort, W. T. S. Huck and T. F. A. de Greef, Chem. Soc. Rev., 2015, 44, 7465–7483 RSC.
- A. C. Hatch, J. S. Fisher, A. R. Tovar, A. T. Hsieh, R. Lin, S. L. Pentoney, D. L. Yang and A. P. Lee, Lab Chip, 2011, 11, 3838 RSC.
- A. R. Abate, K. Ahn, A. C. Rowat, C. Baret, M. Marquez, A. M. Klibanov, A. D. Grif, D. A. Weitz and G. A. L. Aga, Proc. Natl. Acad. Sci. U. S. A., 2010, 107, 6550 CrossRef PubMed.
- Y. Bai, X. He, D. Liu, S. N. Patil, D. Bratton, A. Huebner, F. Hollfelder, C. Abell and W. T. S. Huck, Lab Chip, 2010, 10, 1281–1285 RSC.
- S. H. Kim, S. J. Jeon, G. R. Yi, C. J. Heo, J. H. Choi and S. M. Yang, Adv. Mater., 2008, 20, 1649–1655 CrossRef CAS.
- H. Bayley, B. Cronin, A. Heron, M. A. Holden, W. L. Hwang, R. Syeda, J. Thompson and M. Wallace, Mol. BioSyst., 2008, 4, 1191–1208 RSC.
- M. A. Holden, D. Needham and H. Bayley, J. Am. Chem. Soc., 2007, 129, 8650–8655 CrossRef CAS PubMed.
- G. Maglia, A. J. Heron, W. L. Hwang, M. A. Holden, E. Mikhailova, Q. Li, S. Cheley and H. Bayley, Nat. Nanotechnol., 2009, 4, 437–440 CrossRef CAS PubMed.
- G. Villar, A. J. Heron and H. Bayley, Nat. Nanotechnol., 2011, 6, 803–808 CrossRef CAS PubMed.
- C. E. Stanley, K. S. Elvira, X. Z. Niu, A. D. Gee, O. Ces, J. B. Edel and A. J. Demello, Chem. Commun., 2010, 46, 1620–1622 RSC.
- Y. Elani, A. J. Demello, X. Niu and O. Ces, Lab Chip, 2012, 12, 3514–3520 RSC.
- L. Shui, E. Stefan Kooij, D. Wijnperlé, A. van den Berg and J. C. T. Eijkel, Soft Matter, 2009, 5, 2708 RSC.
- G. Villar, A. D. Graham and H. Bayley, Science, 2013, 340, 48–52 CrossRef CAS PubMed.
- T. Wauer, H. Gerlach, S. Mantri, J. Hill, H. Bayley and K. T. Sapra, ACS Nano, 2014, 8, 771–779 CrossRef CAS PubMed.
- M. S. Friddin, G. Bolognesi, Y. Elani, N. J. Brooks, R. V. Law, J. M. Seddon, M. A. A. Neil and O. Ces, Soft Matter, 2016, 12, 7731–7734 RSC.
- M. J. Booth, V. R. Schild, A. D. Graham, S. N. Olof and H. Bayley, Light-activated communication in synthetic tissues, Sci. Adv., 2016, 2, e1600056 Search PubMed.
- J. Wang, M. Jin, T. He, G. Zhou and L. Shui, Micromachines, 2015, 6, 1331–1345 CrossRef.
- E. K. Tan and L. L. Chan, Acta Neurol. Scand., 2006, 113, 350–352 CrossRef CAS PubMed.
- T. Cubaud and T. G. Mason, Capillary threads and viscous droplets in square microchannels, Phys. Fluids, 2008, 20, 053302 CrossRef.
- W. Lee, L. M. Walker and S. L. Anna, Phys. Fluids, 2009, 21, 32103 CrossRef.
- W. Li, Z. Nie, H. Zhang, C. Paquet, M. Seo, P. Garstecki and E. Kumacheva, Langmuir, 2007, 23, 8010–8014 CrossRef CAS PubMed.
- J.-C. Baret, F. Kleinschmidt, A. El Harrak and A. D. Griffiths, Langmuir, 2009, 25, 6088–6093 CrossRef CAS PubMed.
- P. A. Sandoz, A. J. Chung, W. M. Weaver and D. Di Carlo, Langmuir, 2014, 30, 6637–6643 CrossRef CAS PubMed.
- K. Short, P. Gruner, B. Riechers, B. Semin, J. Lim, A. Johnston and J. C. Baret, Controlling molecular transport in minimal emulsions, Nat. Commun., 2016 DOI:10.1038/ncomms10392.
- P. Carreras, R. V. Law, N. Brooks, J. M. Seddon and O. Ces, Microfluidic generation of droplet interface bilayer networks incorporating real-time size sorting in linear and non-linear configurations, Biomicrofluidics, 2014, 8, 054113 CrossRef CAS PubMed.
- S. Thutupalli, S. Herminghaus and R. Seemann, Soft Matter, 2010, 10 Search PubMed.
- P. H. King, G. Jones, H. Morgan, M. R. R. de Planque and K.-P. Zauner, Lab Chip, 2014, 14, 722–729 RSC.
- A. Yavlovich, B. Smith, K. Gupta, R. Blumenthal and A. Puri, Mol. Membr. Biol., 2010, 27, 364–381 CrossRef CAS PubMed.
- S. Punnamaraju, H. You and A. J. Steckl, Langmuir, 2012, 28, 7657–7664 CrossRef CAS PubMed.
- A. Diguet, M. Yanagisawa, Y. J. Liu, E. Brun, S. Abadie, S. Rudiuk and D. Baigl, J. Am. Chem. Soc., 2012, 134, 4898–4904 CrossRef CAS PubMed.
- D. Miller, P. J. Booth, J. M. Seddon, R. H. Templer, R. V. Law, R. Woscholski, O. Ces and L. M. C. Barter, J. R. Soc., Interface, 2013, 10, 20130496 CrossRef PubMed.
- S. Ma, T. Ogata, S. Kim, K. Kanie, A. Muramatsu and S. Kurihara, Photo-Responsive Properties of Phospholipid Vesicles Including Azobenzene-Containing Amphiphilic Phosphates, Trans. Mater. Res. Soc. Jpn., 2015, 40, 153–158 CrossRef.
Footnote |
| † Electronic supplementary information (ESI) available. See DOI: 10.1039/c6lc01219a |
| This journal is © The Royal Society of Chemistry 2016 |

