 Open Access Article
Creative Commons Attribution 3.0 Unported Licence
Fully automated chemiluminescence detection using an electrified-Lab-on-a-Disc (eLoaD) platform
Saraí M. Torres
Delgado
*a,
David J.
Kinahan
b,
Fralett Suárez
Sandoval
c,
Lourdes Albina Nirupa
Julius
b,
Niamh A.
Kilcawley
b,
Jens
Ducrée
b and
Dario
Mager
d
aLaboratory for Simulation, Department of Microsystems Engineering (IMTEK), University of Freiburg, Georges-Koehler-Allee 103, Freiburg im Breisgau 79110, Germany. E-mail: sarai.torres@imtek.uni-freiburg.de
bSchool of Physical Sciences, Dublin City University, Glasnevin, Dublin 9, Ireland
cLaboratory for Microactuators, Department of Microsystems Engineering (IMTEK), University of Freiburg, Georges-Koehler-Allee 102, Freiburg im Breisgau 79110, Germany
dInstitute of Microstructure Technology, Karlsruhe Institute of Technology, Hermann-von-Helmholtz-Platz 1, Eggenstein-Leopoldshafen 76344, Germany
First published on 6th September 2016
Abstract
Typical Lab-on-a-Disc (LoaD) platforms cannot make a continuous measurement while the disc is spinning; this drawback means that the disc usually must be stopped and aligned with a sensor. This can result in measurement errors in time-dependent assays along with inaccuracies due to liquid displacement and bubble formation in the absence of a stabilising centrifugal field. This paper presents a novel concept for a wirelessly electrified-Lab-on-a-Disc (eLoaD) platform that allows continuous measurement of experimental parameters while the disc is spinning. This platform incorporates all the components needed for measurement within the rotating frame of reference, and bidirectional transmission of data outside this reference frame, thus allowing for online measurement independent of the rotation of the disc. The eLoaD platform is conceived in a modular manner whereby an interchangeable and non-disposable ‘Application Disc’ can be fitted to the eLoaD platform and so the system can be adapted for a range of optical, electrochemical and other measurement types. As an application example, optical readout, using the Application Disc fitted with a silicon photomultiplier, is demonstrated using a tagged chemiluminescent antibody, which is commonly used, for instance, in ELISA assays. The precision of the eLoaD platform is >94%, while its accuracy, when compared to a commercial benchtop luminometer, is higher than 96%. The modular design of this platform will permit extension of this technology to many other LoaD applications.
1 Introduction
1.1 Centrifugal microfluidics
Over the last two decades, centrifugal LoaD analysis has seen tremendous development.1 Today, it offers a unique way to handle and automatically process small sample volumes2,3 in a manner which is particularly useful for ‘point-of-care’ and ‘point-of-use’ applications. The centrifugal field, which provides the inherent capability to process blood,4,5 simplifies on-disc sample preparation, while the absence of external pumps means ‘world-to-chip’ interfacing with these non-pressurised discs. Over the years, a suite of technologies have been invented to perform laboratory unit operations (LUOs) such as metering, valving, and mixing, that when combined, allow automation of multi-step biomedical assays2,6 such as nucleic acid purification,7 liver function,8 and CTC (circulating tumour cell) detection,9 alongside other applications such as environmental monitoring.10 The additional functionality added to the support instrumentation, such as temperature control next to the disc, also permits temperature-dependent reactions like PCR (polymerase chain reaction) to be achieved.11 One of the big challenges in centrifugal platforms is the immanent need for signal detection. Many of these reports have an on-disc sample preparation but the subsequent output signal detection is typically not performed with the disc in motion. There are mainly three different approaches used for detection, all with their corresponding advantages and drawbacks. The first method is ‘off-disc’ detection which implies the removal of the sample at the end of the experiment and its insertion into a commercial device in order to perform the measurement. The second method, ‘spin-stop’, stops the disc with the detection chamber aligned next to a sensor, thereby stopping all centrifugal force-driven actions. The third, a ‘discontinuous’ approach, does not stop the disc; therefore, the experiment can continue, but it delivers a discontinuous signal acquisition.1.2 Signal detection
An extensive review on the diverse detection methods and platforms existing for antibody detection can be found in Vashist et al.12 Also, more specific overviews of the different applicable LoaD techniques and their working principles have been reviewed.2,3,13–15 Many of the most common LoaD experiments use optical detection. Methods such as visual inspection and absorption detection, despite their simplicity, cannot reach high levels of sensitivity, leading to ambiguities in the results. Fluorescence offers greater sensitivity, but typically the disc must be stopped and aligned with a sensor. While not challenging, this means that there can be minimal or no ‘real-time’ monitoring of the assay; only endpoint measurements are practical. Similarly, fluorescence and chemiluminescence detection can also be implemented during disc motion using stroboscopic systems; however as a typical reservoir (5 mm wide on a 12 cm diameter disc) spends less than 3% of its time in view of the sensor, this approach requires highly-sensitive and specialised off-chip optical systems. Our new eLoaD platform removes these limitations by permitting simple, reliable, time-independent and direct measurement while the disc is in motion.2 eLoaD concept – an electrified platform with bidirectional communication
2.1 LoaD platforms with direct interaction
Thanks to the research focus LoaD technology has experienced during the past few decades, nowadays a microfluidic disc features high levels of fluidics integration with the implementation of a large variety of LUOs. These LUOs, normally controlled by variations in the disc spin-rate, are typically paired with stationary sensors to implement sample-to-answer assays in spin-stop solutions. These sensors are typically non-contact optical devices. However, some applications like electrochemical detection don't allow strict separation between the disc and the sensor and require a physical contact between the sensor and the sample. While this can be implemented using spin-stop solutions8 there are also solutions that bridge that gap, e.g., using slip ring contacts, to allow a continuous electrochemical measurement during spinning.16 These slip rings allow a direct access into the spinning system but they are mechanically complicated and tend to wear quickly. A much more reliable method is having a sensor on the spinning disc that allows a rotation-independent wireless readout as previously demonstrated using a temperature sensor.172.2 eLoaD platforms
eLoaD on-disc sensing is a paradigm change in centrifugal microfluidics which allows for a much more sophisticated and closer interaction between the sensor and the sample. The key to this new approach is the transfer of energy to the disc. This can be implemented by energy harvesting18 or, as previously proposed,19,20 through the use of wireless power transfer. This approach proves to be simpler, cheaper and more reliable. The previously reported prototypes involved the inclusion of two concentric, inductively coupled coils, one of which was attached to the rotating platform, demonstrating the possibility of transferring more than 2 W of power in ref. 19 and more than 8 W with the addition of a split core in ref. 20, which resulted in a spinning frequency-independent power supply. Such a stable and continuous power supply not only allows for a much more sophisticated on-disc setup than just a sensor, but has potential towards an embedded system that permits complex sensing and actuation schemes with integrated control and bidirectional communication.2.3 The new freedom gained using an electrified disc
Supplying power to the centrifugal platform allows the direct interaction of a microcontroller (μC) and several sensors on the disc with the sample fluid. This offers the potential to transform the LoaD concept into a platform more akin to the conventional Lab-on-a-Chip (LOC), where direct sensing and closed loop control are regularly implemented, but with the added advantage of simple world-to-chip integration, disposable cartridge and the inherent centrifugal force. It allows the system to perform interactive protocols like measurement-triggered actions, since the on-board μC can directly acquire data from sensors and has access to any actuators built into the eLoaD. Similarly, feedback from the disc via wireless communication to the spin-stand controller can be used to control the rate of disc rotation. This feedback can greatly increase the reliability of conventional ‘burst-valves’ on the LoaD as the correct and timed delivery of liquids about the disc can be ensured. Another advantage of the eLoaD concept is the ability to locate Micro Electro-Mechanical Sensors (MEMS) on the disc and close to the sample volume. In the experiment described here, a silicon photomultiplier (SiPM) can be directly mounted next to the mixing chamber, while being used off-disc would need an optic setup that should guide the light from the sample to the sensor.2.4 Electrical and computational power of eLoaD
A major advantage of this work is that, within the smartphone industry, wireless charging21 has become more and more ubiquitous. Indeed, wireless power transfer to supply energy to many sensors and microsystems, in some cases over significant distances, is seen as a fundamental enabling technology for the ‘Internet of Things’ model. Thus we can use largely pre-existing technology for both power transmission and reception. Similarly, we can use the widely available Arduino platform22 to provide a low cost, modern μC which has an abundance of computational power for most envisaged applications. As many LoaD developers and users have a background in life sciences, we chose the Arduino platform for its usability for non-software engineers and the wide support community who use the platform. The Arduino Platform is an ‘open-hardware’ and has become one of the standard programming and implementation technologies for rapid prototyping development. Its programming interface keeps most complexity away from the user and yet, gives freedom to the design.The eLoaD platform shown in Fig. 1b) comprises the necessary circuitry for it to behave as a power receiver compatible with the Qi standard23 for wireless power transfer. This energy-transferring technique is more commonly used to wirelessly charge mobile devices such as smartphones and tablets by placing them next to the transmitter. According to the specifications given by the standard, a commercially available Qi-compliant transmitter should be able to deliver a maximum of 5 W of power to any Qi-compliant receiver. Nevertheless, the design and fabrication of the receiver coil and its corresponding circuitry will determine the maximum power that the transmitter's counterpart is capable of receiving.
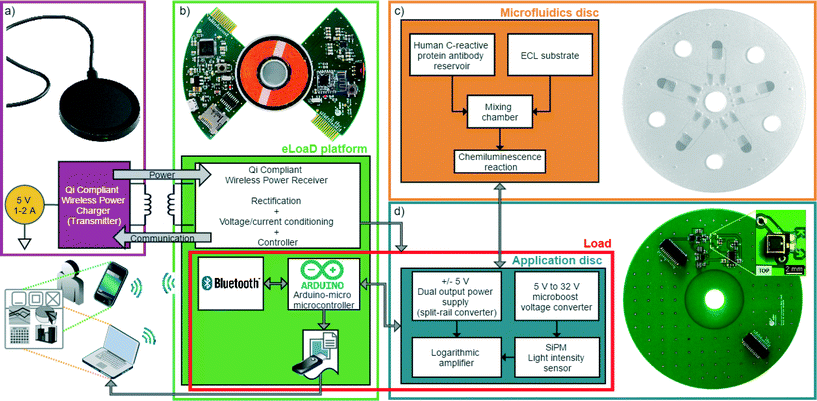 | ||
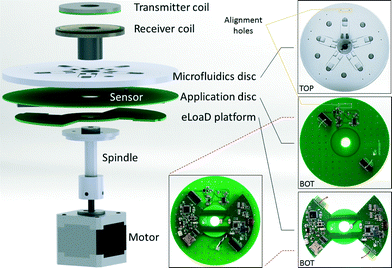
| Fig. 1 Each block represents one level from those presented in Fig. 3. a) A commercially available transmitter compliant with the Qi standard. From its input of 5 V, 1.5 A is able to provide 5 V, 1 A of output power. b) Our eLoaD platform that is supplied through electromagnetic induction from the transmitter of a). The eLoaD platform was conceived as a fully integrated, active and externally communicated platform that is able to control sensors and actuators for enhanced LoaD applications. c) Microfluidic disc used for chemiluminescent reaction. d) Application Disc with the circuitry needed to supply to a silicon photomultiplier that senses the chemiluminescence intensity. The disc also includes an amplification stage of the detected signal. The reusable Application Disc is introduced in order to provide a generic framework to the eLoaD platform. | ||
2.5 Design of the Qi-compliant receiver stage of the eLoaD
The circuit schematic shown in Fig. 2 corresponds to the designed Qi-compliant receiver available on the eLoaD. The integrated circuit, BQ51013A,24 is part of the 5 W-series of Qi-compliant receivers with a 5 V output. The receiver stage was designed under the Qi specification v1.1.2,23 which establishes that in order to enhance the efficiency of the transferred power, as well as to enable a transmission method based on resonance, it is necessary to configure the resonant capacitors Cs and Cd and the receiver coil into a dual resonant circuit with fs and fd as the resonance frequencies, in a way that | (1) |
 | (2) |
 is the self-inductance measured under the influence of a power transmitter. To ensure maximum power transmission, the quality factor, at a frequency of 1 MHz, of the dual resonant circuit connected, as shown in Fig. 2, should satisfy
 | (3) |
 with 0 ≤ θ ≤ 2π·N) with a litz wire of 45 strands with 70 μm diameter resulting in a combined conductor width of 0.6 mm. The dimensions of the Archimedean spiral can be observed in Table 1. Prior designs of spiral coils on printed circuit boards with copper thickness in the range of 35–105 μm and diverse geometries were tested; nevertheless, the quality factor of these did not fulfil the specification of eqn (3).
| Physical characteristics | Electrical characteristics | |||
|---|---|---|---|---|
| Internal diameter | d i | 19.8 mm | L s | 15.83 μH |
| External diameter | d o | 43.4 mm | R DC | 0.61 Ω |
| Number of turns | N | 15 |

|
18.32 μH |
| Conductor width | w | 0.6 mm | Q | 162.83 |
| Turns' spacing | s | 0.186 mm | C s | 138 nF |
| Flexible ferrite thickness25 | t Fe | 0.3 mm | C d | 1.62 nF |
The electrical characteristics of the receiver coil were characterised with the use of a vector network analyser (ZVL, Rohde & Schwarz GmbH & Co KG, Germany) after a Short, Open, Load (SOL) calibration. A logarithmic frequency sweep from 1 kHz to 10 MHz over 2405 measurement points was employed to retrieve the electrical characteristics of the spiral. By measuring the reflection coefficient of the one-port network, the real and complex components of the spiral's impedance were extracted; these characteristics are summarised in Table 1, as well as the capacitance needed to configure the receiver circuit into dual resonance. The typical application schematic of the integrated circuit, BQ51013A, was used as a base circuit for the receiver stage of the eLoaD. According to the datasheet, the current limiting resistor R1 is calculated by
 | (4) |
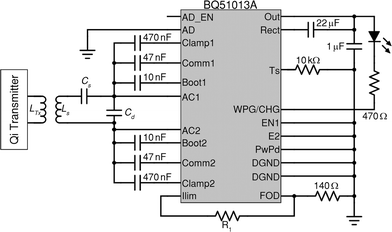 | ||
| Fig. 2 Schematic of the implemented Qi-compliant receiver of the eLoaD based on the integrated circuit, BQ51013A24 from Texas Instruments. | ||
All the components were specified and configured so that the receiver was able to accept as much power as available. However, after transmission and losses through all conditioning stages, such as rectification and regulation, the maximum available power to sustain the platform is 4 W. The already approved new Qi-specification will transmit 15 W, thereby delivering enough energy for most possible eLoaD applications. The Qi-transmitter already uses a coil that has a centre cut-out; hence only small modifications are needed to be made to fit it onto a conventional spin-stand.
2.6 Generic framework
The general idea behind the design of the eLoaD platform is to provide the LoaD community with a portable, compact and low cost platform that integrates all necessary modules to interact with their experiments while the disc is spinning. This includes, besides the already mentioned 4 W of power and the Arduino platform with all its interface options, an SD-Card for data acquisition, a Bluetooth module for real-time bidirectional communication purposes, and a micro-USB port to load the code for every specific application. The total power consumption of these modules is less than 500 mW, leaving over 3.5 W for the application, thereby allowing the integration of a variety of sensors and actuators. Since this generic framework always stays the same and only the application-specific sensors and actuators need to be varied, a modular design approach is taken where the system-specific components are on one PCB (the eLoaD platform) (Fig. 1b)) while the application-specific components are placed on an interchangeable, reusable PCB called the Application Disc (Fig. 1d)). A scheme and a block-diagram of the setup of the platform are depicted in Fig. 3 and 1, respectively. The only requirement for implementing different LoaD applications is the exchange of the last two blocks, the Application Disc and the microfluidic disc.3 Experimental setup
3.1 Chemiluminescence in LoaD
Chemiluminescence is a very selective optical detection method; the simplicity of its working principle and the absence of an external light source make it a very attractive analytical tool. Nevertheless, the need for a highly sensitive photodetector attached to the luminescent sample and the detection of the signal in a rotating platform has resulted in quite few publications in this subject. For example, as early as 2006, one of us succeeded in integrating this detection method to a centrifugal microfluidic platform26 for the parallel detection of cardiac markers. They developed a spin-stop method to capture the chemiluminescent reaction caused by the coupling of antigen beads with HRP-labelled detection antibodies. For the signal readout, an X–Y drive had to position a high-bandwidth photomultiplier tube (PMT) that captured the chemiluminescence intensity in a discontinuous mode (once per revolution). The PMT's position was given relative to the reaction chamber on the disc. Furthermore, the PMT was connected to its respective electronics' box for voltage gain adjustment.In order to measure luminescence intensities as a final stage of the integration of spore-based, genetically engineered whole-cell sensing systems into a microfluidic platform, Date et al.27 used a fluorescence spectrophotometer equipped with a fibre optic system. After mixing the reagents with the help of a five-stage stepper motor, the same was turned off and the microfluidic disc was manually rotated and held, with every detection chamber centred over the fiber optic probe perpendicularly positioned underneath (spin-stop mode).
A fully automated, nonetheless discontinuous chemiluminescence detection method for determination of human C-reactive protein (CRP) on a centrifugal platform was reported in ref. 28. Czilwik et al. performed the processing steps for a magnetic chemiluminescence immunoassay in a LabDisk player (Qiagen Lake Constance GmbH, Germany) with programmable centrifugation protocols. The LabDisk was equipped with the chemiluminescence detection unit, Fluo Sens (QIAGEN Lake Constance, Stockach, Germany).
To the best of our knowledge, this work reports for the first time chemiluminescence detection fully integrated into a microfluidic platform. The eLoaD framework allows this kind of measurement to be performed without any human interaction or even the need to stop the disc during the measurement.
3.2 Microfluidic disc: design and fabrication
The centrifugal microfluidic disc employed to test the system is a 14 cm diameter disc made of multiple layers29 of poly(methyl methacrylate) (PMMA) and pressure sensitive adhesive (PSA) tape, which comprises five identical structures microfabricated using a CO2 laser and a cutter-plotter. Each of the microfluidic structures on the disc consists of two reagent reservoirs intended to store two reagents: the detection antibody and the chemiluminescent solution, connected through channels to the mixing and detection chambers as depicted in Fig. 4. The release of fluids is controlled by capillary burst valves which allow the fluids to flow from the reagent reservoirs to the mixing chamber once the disc is rotated at high angular frequencies. The mixing chamber is located on the mid layer and there is an opening through the bottom layer, right underneath the chamber. This opening allows the photodetector, situated on the top side of the Application Disc (see Fig. 1c) and d)), to have a close and direct optical access to the luminescent reaction that has been carried out inside the mixing chamber.There are four holes in both the microfluidic and the Application disc meant for alignment purposes as shown in Fig. 3. The microfluidic disc has multiple mixing chambers that are envisioned for parallel sensing. The circuitry on the Application Disc can be easily expanded to as many sensing channels as needed. In the meantime, for the validation of the proposed platform, only one sensing channel is implemented.
3.3 Application Disc: sensing a chemiluminescent reaction
As shown in the last section, the design of the microfluidic disc, the number and the position of layers, channels, valves and chambers (fluidic compartments) will depend on the desired assay to be accomplished. Therefore, the quantity, type and orientation of external components will follow the same way.While the core of the eLoaD platform (power, computation, data storage and communication) is not affected by that, the application-specific disc is. In order to perform all the required measurements at the positions that are determined by the application, the Application Disc will carry the corresponding components and it is linked via two pin headers to the eLoaD platform (Fig. 3).
3.4 Application Disc for optical detection: design and fabrication
On-disc chemiluminescence detection demands the usage of an extremely sensitive, compact, with low power consumption, and preferably, low cost photodetector. As already mentioned in section 1, measuring luminescence intensities is sometimes done off-disc using bench-top commercial luminometers or with either discontinuous or spin-stop methods using devices like PMTs. Table 2 shows a comparison between different types of photodetectors.37 The chosen SiPM is not ideal in all aspects, but it has an exceptional combination of features. For instance, it does not have as low operating voltage levels as a PIN diode, but its gain factor is in the order of 106 as it is for a PMT,30 and it comes all together in a single small sensor. For daily usage, aspects like its stray light exposure durability and its electronics complexity are nice add-ons. The sensor ASD-NUV1S-P (AdvanSiD) seems the ideal choice for this specific application. The near-ultraviolet version of this device was selected because its spectral response matches quite close to the chemiluminescence spectrum to be detected during the experiments. Since one of the main targeted application areas for this eLoaD platform is in point-of-care scenarios in rural areas of under-resourced countries,31 the fact that the price of a SiPM is more than one order of magnitude less expensive than a PMT32 also suits the concept.| PIN diode | Avalanche diode | Photomultiplier tube | Silicon photomultiplier | |
|---|---|---|---|---|
| Gain | 1 | 102 | 106 | 106 |
| Operating voltage | 0 V to 5 V | 100 V to 1 kV | 800 V to 200 kV | 30 V to 40 V |
| Temperature sensitivity | Low | High | Low | Low |
| Mechanical robustness | High | High | Low | High |
| Damage by stray light | No | Yes | Yes | No |
| Spectral range | UV-VIS-NIR | UV-VIS-NIR | Blue/UV | UV-VIS-NIR |
| Readout electronics complexity | Complex | Complex | Simple | Simple |
| Form factor | Small | Small | Bulky | Small |
| System cost | Medium | Medium | High | Lowest |
| Scalable technology | Yes | No | No | Yes |
| Electromagnetic immunity | Yes/No | Yes/No | No | Yes |
| Sensor noise | Low | Medium | Low | Lowest |
| Response time | Fast | Slow | Fast | Fastest |
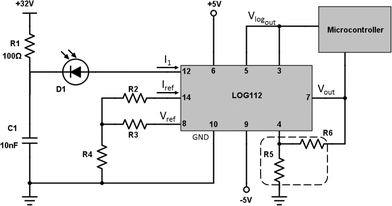
The schematic of the ASD-NUV1S-P, as recommended in the device's datasheet, was merged with the schematic of the logarithmic amplifier, LOG112 (Texas Instruments),33 to form the base circuit of the light detection stage of the Application Disc.
The reference resistors R2–R4 from the circuit shown in Fig. 5 were selected in such a way that:
1. The current flowing through pin 14 is held constant to become the reference current, Iref, with which the current generated by the photodetector, Ipd, is compared.
2. The circuit is capable of measuring the 7.5 decades of current that the logarithmic amplifier accepts (100 pA–3.5 mA).
3. Its output voltage, Vlogout, is in the acceptable range (0–5 V) for the subsequent analogue to digital converter (ADC) input of the μC.
The values were computed based on the ideal transfer function given by the manufacturer of the logarithmic amplifier:
 | (5) |
In accordance with the voltage and current laws applied at the node shared by R2, R3 and R4, it can be deduced that
 | (6) |
After the logarithmic amplifier performs the current-to-voltage conversion, Vlogout is inserted to one analogue input of the μC. Each analogue input is capable of measuring voltages from ground to 5 V and provides a resolution of 10 bits, i.e. 1024 different values or 4.8876 mV. The data is read and then, can be either saved into a text file (e.g., .csv) or sent through the Bluetooth module, and displayed in real time.
In order to analyse, as well as to visualise the data collected from the reader, it is necessary to know Ipd, which is proportional to the luminescence intensity and in this case, to the concentration of the antibody in the sample. Rearranging eqn (5), we get
 | (7) |
4 Experiments
4.1 Platform's calibration
For characterisation and subsequent calibration of the system and because the experiment is focused on detecting a low luminescence intensity triggered by a chemiluminescent reaction, it is important to know the zero and offset levels of the system to have certain reference values for comparison and validation purposes.In order to detect and subsequently eliminate or mitigate sources of ambient noise, a spin protocol was programmed to accelerate and decelerate the disc either with an empty mixing chamber or filling it with a buffer solution with zero concentration of the antibody. If the value of Ipd recorded by the platform remained constant, but at a high level, it meant that there was an homogeneous light source making the net ambient luminous intensity brighter than the desirable to act as a zero level. If the recorded signal changed according to the rotation frequency, it meant that there were light spots, illuminating the sensor distinctively depending on its orientation.
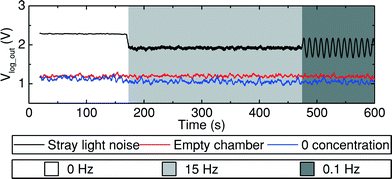
In order to reduce the noise and light levels, the experiment was performed in an enclosed dark environment. Fig. 6 shows the measurement results taken before and after a series of tests performed to optimise the ambient conditions. The black curve ‘straight light noise’ was taken before any corrections were implemented, therefore, stray light and inconvenient external light sources such as indicating LEDs from the equipment that was being used interfered with the measurement results. The chart ‘straight light noise’ from Fig. 6 shows that after 180 s of data recording, right after the disc starts spinning at 15 Hz and the mixing chamber is filled with the reagents, there is a sudden decrease in magnitude of the recorded signal. This decrease indicates that there was light going into the enclosure, whose intensity was diminished by the mixture of reagents that had just covered the sensor. Moreover, when the disc is decelerated to 0.1 Hz, according to the recorded signal response, it can be observed that the sensor was facing towards a light source at every turn (from the indicating LED of the commercial Qi-compliant transmitter). In order to optimise the measurements, the stray light sources were removed, if not, they were covered and sealed so that the ambient conditions improved as much as possible. The red chart, ‘empty chamber’, shows that after removing most of the noise, a constant level was observed regardless of the frequency of rotation. A slight reduction in the luminescence intensity is detected by the SiPM and shown by the chart ‘0 concentration’ after filling the mixing chamber with a solution of zero concentration of the antibody; this happens after the first 150 s.
The remaining ambient light level does not affect the validation of the measured data, as long as it is taken into account during the calibration procedure. Since this level is a constant offset to the luminescence intensity of interest it can be directly subtracted from the measured values. Although this calibration method might seem cumbersome at first, it is important to remember that any other ultra-sensitive, high-precision instrument performs a calibration step on its own or requires the user to perform one or more calibration steps before starting the actual measurements in order to ensure the measurements' reproducibility. This calibration procedure will be necessary independently of the way that a dark environment (an entire room or a small hermetic box made of an opaque material) is provided. Changes in the zero and reference levels can occur due to other factors such as temperature or fluctuations in the input voltage because of line variations, power consumption, distance between the transmitter and receiver coils depending on the final setup or thickness of the microfluidic disc.
The second calibration step refers to retrieving a reference value to which all measurements will be normalised. This step is of particular importance when comparing the measurement results of the eLoaD platform to those of a commercial apparatus. In order to have a more convenient depiction of the measurement results, we set this reference value as the mean value of the highest measured concentration.
4.2 Measurements
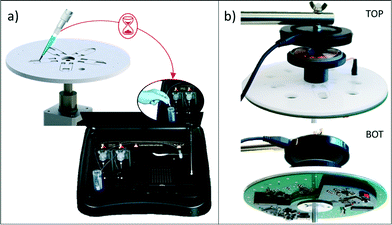
First the results of serial dilutions of the antibody were measured using a highly sensitive bench-top luminometer (GloMax, Promega Corporation, USA) shown in Fig. 7a), which has a PMT as its internal detector, and the eLoaD platform from Fig. 7b) with its SiPM mounted in the Application Disc.Human C-reactive protein (CRP) antibody (1 mg mL−1) was diluted in an assay buffer 5× (Thermo Fisher Scientific) in a dilution range between 0 ng mL−1 and 100 ng mL−1 as shown in Fig. 9. Once all concentrations have been prepared, they are stored at 4 °C in the dark for later use. In order to create the enhanced chemiluminescence (ECL) substrate, equal parts of ECL sub-straight component A and ECL sub-straight component B were mixed and shielded from light.
To begin the chemiluminescent reaction experiment, 50 μL of the prepared dilution of the detection antibody was loaded on one of the chambers of the disc and 50 μL of the freshly prepared ECL reagent was loaded on the second chamber (see Fig. 8a), i)). Mixing times and timing of the reagent release are controlled by the disc spin-rate protocol shown in Fig. 8b. The disc is held stationary for about 180 s, which allows for the background noise to be detected; thereafter the disc is accelerated and the spin-rate is switched between 15 Hz and 30 Hz every 2 s for a total duration of 600 s for the mixing of the two solutions (Fig. 8a), ii) to iv)).
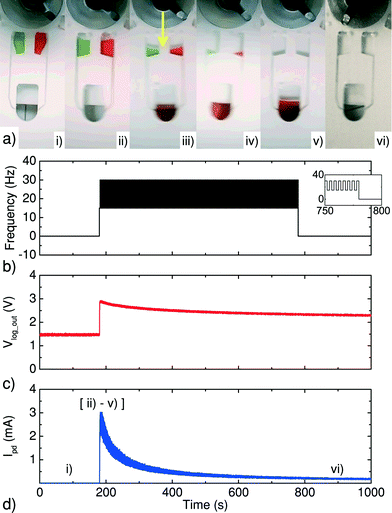 | ||
| Fig. 8 Implemented protocol for chemiluminescence detection with our eLoaD and the microfluidic platform presented in section 3. a) Sequential photos of the protocol. b) Spin-rate protocol. c) Raw data recorded for the μC, when 50 μL of the detection antibody (at 10 μg mL−1) was added to 50 μL of the ECL reagent. d) A typical processed signal, when applying eqn (7) to the data from c). | ||
Once the disc is accelerated and the reagents are released into the mixing chamber, the chemiluminescent reaction begins (Fig. 8a), ii) to v)). The light signal (chemiluminescence response) produced by the chemical reaction is then captured by the sensor below the chamber and the data is saved (Fig. 8c)).
5 Results
In order to ensure the reliability and reproducibility of the results, a serial dilution experiment was carried out three times with each device. The mean values obtained from each instrument can be observed in Table 3.| Concentration [ng mL−1] | Glomax luminometer [a.u.] | eLoaD [μA] |
|---|---|---|
| 100 | 9![[thin space (1/6-em)]](https://www.rsc.org/images/entities/char_2009.gif) 494 494![[thin space (1/6-em)]](https://www.rsc.org/images/entities/char_2009.gif) 416.5 416.5 |
12.3157 |
| 66.67 | 4![[thin space (1/6-em)]](https://www.rsc.org/images/entities/char_2009.gif) 936 936![[thin space (1/6-em)]](https://www.rsc.org/images/entities/char_2009.gif) 937.75 937.75 |
7.24354 |
| 50 | 3![[thin space (1/6-em)]](https://www.rsc.org/images/entities/char_2009.gif) 310 310![[thin space (1/6-em)]](https://www.rsc.org/images/entities/char_2009.gif) 335.75 335.75 |
4.68829 |
| 33.33 | 1![[thin space (1/6-em)]](https://www.rsc.org/images/entities/char_2009.gif) 850 850![[thin space (1/6-em)]](https://www.rsc.org/images/entities/char_2009.gif) 909 909 |
2.77962 |
| 20 | 590![[thin space (1/6-em)]](https://www.rsc.org/images/entities/char_2009.gif) 072.75 072.75 |
1.66049 |
| 16.67 | 238![[thin space (1/6-em)]](https://www.rsc.org/images/entities/char_2009.gif) 257.5 257.5 |
1.18471 |
| 0 | 4242.75 | 0.82482 |
As described in section 3.4, the used current-to-voltage converter for this application is a logarithmic amplifier capable of measuring 7.5 decades of current in the range of 100 pA to 3.5 mA. As can be expected by the measured concentration range of 100 ng mL−1 down to 16.67 ng mL−1, the variation at the output current, Ipd, is about one decade, that is, from 12.3157 μA to 1.18471 μA.
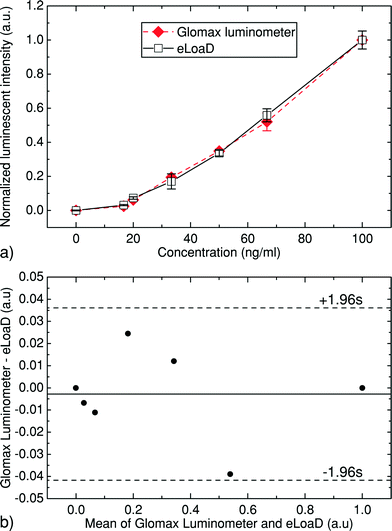
After normalisation and subtraction of the zero level from all values, the results shown in Fig. 9a) were obtained. The Y axis of this figure represents the mean value of the three trials performed for each concentration and the error bars represent the standard deviation. The error bars reveal a maximum standard deviation of 5.3% for both instruments. It was further observed that the maximum error among all measurements performed by the eLoaD was less than 6%, while for the commercial luminometer it was 8%. These errors can be attributed to the instruments themselves or to human error while preparing the dilutions or loading them into the disc.
When observing the performance between the eLoaD platform and the commercial luminometer, it is evident that comparable results can be obtained with both instruments. Furthermore, the Bland–Altman plot34 shown in Fig. 9b) depicts the agreement between both instruments, in which the difference between the standardised values obtained from both instruments (Y axis) is plotted against the average of these two (X axis). The analysis of the standard deviation of the differences establishes a ±0.039 interval of agreement, within which 95% of the differences fall.
One of the big advantages of performing the measurements on the disc is the time independence. As depicted by the curve in Fig. 8, the first seconds after starting the mixing process for a chemiluminescent reaction are crucial, because of the fast decay of the intensity response. Conducting an off-disc measurement by removing the sample after performing an entire protocol on-disc might lead to serious time-dependent uncertainties.
6 Conclusions and outlook
This work introduced a wirelessly electrified Lab-on-a-Disc (eLoaD) platform that incorporates all the components needed for chemiluminescence detection within the rotating reference frame of centrifugal microfluidics. The Qi mobile phone charging standard was employed to transfer power to the rotating platform through electromagnetic induction. The co-rotation of the eLoaD and the microfluidic platform allows for uninterrupted measurements to be performed on-disc and without the need for sample extraction. The photodetector of the eLoaD platform is a silicon photomultiplier that was chosen for its easy implementation, small size, low power consumption, price, and sensitivity.To demonstrate the efficacy of the new system, chemiluminescence measurements from samples were acquired using a highly sensitive, commercial instrument (GloMax luminometer, Promega Corporation, USA) and our eLoaD platform. The measurement results showed an excellent comparison between the two platforms. For the reported concentration range, the eLoaD platform disclosed a precision >94% and an accuracy higher than 96% when compared to the commercial benchtop luminometer.
Furthermore, the detection and amplification components and their corresponding circuitry were designed to measure within a range of 7.5 decades (100 pA–3.5 mA) of output current. Although a higher luminescence intensity (about 4 orders of magnitude above the concentration levels reported here) is straightforward to measure with the current circuit design, lower intensities might require a filtering stage of the sensed signal before undergoing amplification. A decrease of 2.5 orders of magnitude below the concentration levels reported here is theoretically possible to reach, in order to match the requirements of a wide range of given chemiluminescence assays. For example, achieving a lower detection limit will allow for more sensitive experiments to be performed, such as the detection of CRP on conjugated beads adapted from a commercial assay.
The eLoaD concept offers the capability to make continuous measurements, either optical or non-optical, from the centrifugal platform while requiring minimal modification of the core simplicity of the Lab-on-a-Disc. The lightweight, low-cost and re-usable eLoaD co-rotates with the disc and, aside from a mount to hold a wireless power transmitter, requires no modification to the architecture of a spin-stand or portable LoaD instrument. As all communication and power transfer is wireless, an electrical slip-ring is not required while, by co-rotating the sensors with the discs, no stroboscopic system (discontinuous measurements) or external sensing and alignment system (spin-stop) is needed.
The electrical and computational power of our platform allows for parallel experiments, so several sensors, looking into several reaction chambers, would allow a direct parallel implementation of several reactions.
The ability to measure during centrifugation can keep the liquid in the read chambers stabilised without bubbles or sloshing; thus attenuating measurement and time-dependent errors. Alongside chemiluminescence, this advantage can be applied to many other applications. For example, filtered LEDs and photodiodes can be fitted to an Application Disc to enable fluorescence detection while sputtering a reflective coating (i.e. silver or aluminium) onto a disc could permit absorbance measurements. A particular feature of this sensing approach is the ability to make continuous measurements which are advantageous, and in some cases critical, for applications such as continuous monitoring of on-disc DNA amplification methods (e.g., qPCR, LAMP, RPA, etc.), DNA fluorescence melting curve analysis35 and measurement of kinetic absorbance, such as liver assays. This capability can also open up new application fields for the LoaD; for example, measurements from tagged cells as they sediment past a sensor could result in a low cost cytometer for HIV diagnostics or CTC detection.
The greatest potential of the eLoaD platform is that, aside from purely sensing applications, it can provide the advantages of non-centrifugal Lab-on-a-Chip that have, so far, been largely missing from Lab-on-a-Disc. The ability to power MEM components such as actuators and micro-pumps,36 alongside sensors, with all controlled and integrated with an on-disc microcontroller and with access to off-disc systems via Bluetooth, opens up the possibility of closed-loop control of the centrifugal system. Thus, with its ease of implementation, modular design, advanced sensing capabilities and potential for autonomous feedback and control, the eLoaD platform represents a first step towards the next generation of centrifugal microfluidic systems.
Acknowledgements
The authors would like to acknowledge the National Council of Science and Technology, CONACyT (Mexico), the University of Freiburg, the Karlsruhe Institute of Technology, the European Union (FP7-KBBE-2013-7-613908-DECATHLON), and the Science Foundation of Ireland (10/CE/B1821) for their financial support. The authors are also thankful to Prof. Dr. Ulrike Wallrabe for providing access to her laboratories at the University of Freiburg and to Brian Henderson and Dr. Triona M. O′Connell of DCU for providing advice and guidance on the biological aspects of this work.References
- L. X. Kong, A. Perebikovsky, J. Moebius, L. Kulinsky and M. Madou, J. Lab. Autom., 2016, 21, 323–355 CrossRef PubMed.
- J. Ducrée, S. Haeberle, S. Lutz, S. Pausch, F. von Stetten and R. Zengerle, J. Micromech. Microeng., 2007, 17, S103 CrossRef.
- O. Strohmeier, M. Keller, F. Schwemmer, S. Zehnle, D. Mark, F. von Stetten, R. Zengerle and N. Paust, Chem. Soc. Rev., 2015, 44, 6187–6229 RSC.
- D. J. Kinahan, S. M. Kearney, N. A. Kilcawley, P. L. Early, M. T. Glynn and J. Ducrée, PLoS One, 2016, 11, 1–13 Search PubMed.
- D. J. Kinahan, S. M. Kearney, M. T. Glynn and J. Ducrée, Sens. Actuators, A, 2014, 215, 71–76 CrossRef CAS.
- R. Gorkin, J. Park, J. Siegrist, M. Amasia, B. S. Lee, J.-M. Park, J. Kim, H. Kim, M. Madou and Y.-K. Cho, Lab Chip, 2010, 10, 1758–1773 RSC.
- T.-H. Kim, J. Park, C.-J. Kim and Y.-K. Cho, Anal. Chem., 2014, 86, 3841–3848 CrossRef CAS PubMed.
- C. E. Nwankire, A. Venkatanarayanan, T. Glennon, T. E. Keyes, R. J. Forster and J. Ducrée, Biosens. Bioelectron., 2015, 68, 382–389 CrossRef CAS PubMed.
- J.-M. Park, M. S. Kim, H.-S. Moon, C. E. Yoo, D. Park, Y. J. Kim, K.-Y. Han, J.-Y. Lee, J. H. Oh, S. S. Kim, W.-Y. Park, W.-Y. Lee and N. Huh, Anal. Chem., 2014, 86, 3735–3742 CrossRef CAS PubMed.
- H. Hwang, Y. Kim, J. Cho, J. yoon Lee, M.-S. Choi and Y.-K. Cho, Anal. Chem., 2013, 85, 2954–2960 CrossRef CAS PubMed.
- M. Amasia, M. Cozzens and M. J. Madou, Sens. Actuators, B, 2012, 161, 1191–1197 CrossRef CAS.
- S. K. Vashist, A. Venkatesh, E. M. Schneider, C. Beaudoin, P. B. Luppa and J. H. Luong, Biotechnol. Adv., 2016, 34, 272–290 CrossRef CAS PubMed.
- M. J. Madou and G. J. Kellogg, BiOS ‘98 International Biomedical Optics Symposium, 1998, pp. 80–93 Search PubMed.
- M. Madou, J. Zoval, G. Jia, H. Kido, J. Kim and N. Kim, Annu. Rev. Biomed. Eng., 2006, 8, 601–628 CrossRef CAS PubMed.
- J. Gilmore, M. Islam and R. Martinez-Duarte, Micromachines, 2016, 7, 52 CrossRef.
- K. Abi-Samra, T.-H. Kim, D.-K. Park, N. Kim, J. Kim, H. Kim, Y.-K. Cho and M. Madou, Lab Chip, 2013, 13, 3253–3260 RSC.
- J. Burger, A. Gross, D. Mark, F. Von Stetten, R. Zengerle and G. Roth, International Solid-State Sensors, Actuators and Microsystems Conference, 2011, pp. 2867–2870 Search PubMed.
- K. Joseph, F. Ibrahim, J. Cho, T. H. G. Thio, W. Al-Faqheri and M. Madou, PLoS One, 2015, 10, e0136519 Search PubMed.
- J. Höfflin, S. M. Torres Delgado, F. Suarez Sandoval, J. G. Korvink and D. Mager, Lab Chip, 2015, 15, 2584–2587 RSC.
- G. Wang, H.-P. Ho, Q. Chen, A. K.-L. Yang, H.-C. Kwok, S.-Y. Wu, S.-K. Kong, Y.-W. Kwan and X. Zhang, Lab Chip, 2013, 13, 3698–3706 RSC.
- S. Y. Hui, Proc. IEEE, 2013, 101, 1290–1301 CrossRef.
- Arduino and Genuino products, https://www.arduino.cc/en/Main/ArduinoBoardMicro, (accessed July 2016).
- WPC Qi Specification version 1.2.2, https://www.wirelesspowerconsortium.com/downloads/download-wireless-power-specification.html, (accessed July 2016).
- Texas Instruments BQ51013A datasheet, http://www.ti.com/lit/ds/symlink/bq51013a.pdf, (accessed July 2016).
- Wuert Elektronik WE-FSFS Flexible Sintered Ferrite Sheet datasheet, http://katalog.we-online.de/en/pbs/WE-FSFS, (accessed July 2016).
- L. Riegger, J. Steigert, M. Grumann, S. Lutz, G. Olofsson, M. Khayyami, W. Bessler, K. Mittenbühler, R. Zengerle and J. Ducrée, Proc. of the 10th International Conference on Miniaturized Systems for Chemistry and Life Sciences, MicroTAS, 2006, pp. 819–821 Search PubMed.
- A. Date, P. Pasini and S. Daunert, Anal. Bioanal. Chem., 2010, 398, 349–356 CrossRef CAS PubMed.
- G. Czilwik, S. K. Vashist, V. Klein, A. Buderer, G. Roth, F. von Stetten, R. Zengerle and D. Mark, RSC Adv., 2015, 5, 61906–61912 RSC.
- D. J. Kinahan, S. M. Kearney, N. Dimov, M. T. Glynn and J. Ducrée, Lab Chip, 2014, 14, 2249–2258 RSC.
- NUV SiPMs, http://advansid.com/attachment/get/up_54_1432731416.pdf, (accessed July 2016).
- S. Smith, D. Mager, A. Perebikovsky, E. Shamloo, D. Kinahan, R. Mishra, S. Torres Delgado, H. Kido, S. Saha, J. Ducrée, M. Madou, K. Land and J. Korvink, Micromachines, 2016, 7, 22 CrossRef.
- Hamamatsu microPMT, http://www.hamamatsu.com/resources/pdf/etd/MicroPMT_TPMZ1019E.pdf, (accessed July 2016).
- Texas Instruments LOG112 datasheet, http://www.ti.com/lit/ds/symlink/log2112.pdf, (accessed July 2016).
- J. M. Bland and D. Altman, Lancet, 1986, 327, 307–310 CrossRef.
- D. J. Kinahan, T. M. Dalton and M. R. D. Davies, Biomed. Microdevices, 2009, 11, 747–754 CrossRef CAS PubMed.
- L. Clime, D. Brassard, M. Geissler and T. Veres, Lab Chip, 2015, 15, 2400–2411 RSC.
- SensL Technology Update, http://sensl.com/documentation/academic-research-library/, (accessed July 2016).
| This journal is © The Royal Society of Chemistry 2016 |

