
 Open Access Article
 This Open Access Article is licensed under a Creative Commons Attribution-Non Commercial 3.0 Unported Licence
Ultrasensitive microfluidic analysis of circulating exosomes using a nanostructured graphene oxide/polydopamine coating†
Peng
Zhang
a,
Mei
He
bc and
Yong
Zeng
*ad
aDepartment of Chemistry, University of Kansas, Lawrence, KS 66045, USA. E-mail: yongz@ku.edu
bDepartment of Biological and Agricultural Engineering, Kansas State University, Manhattan, KS 66506, USA
cTerry C. Johnson Cancer Research Center, Kansas State University, Manhattan, KS 66506, USA
dUniversity of Kansas Cancer Center, Kansas City, KS 66160, USA
First published on 22nd March 2016
Abstract
Exosomes are cell-derived nano-sized vesicles that have been recently recognized as new mediators for many cellular processes and potential biomarkers for non-invasive disease diagnosis and the monitoring of treatment response. To better elucidate the biology and clinical value of exosomes, there is a pressing need for new analytical technologies capable of the efficient isolation and sensitive analysis of such small and molecularly diverse vesicles. Herein, we developed a microfluidic exosome analysis platform based on a new graphene oxide/polydopamine (GO/PDA) nano-interface. To the best of our best knowledge, we report for the first time, the GO-induced formation of a 3D nanoporous PDA surface coating enabled by the microfluidic layer-by-layer deposition of GO and PDA. It was demonstrated that this nanostructured GO/PDA interface greatly improves the efficiency of exosome immuno-capture, while at the same time effectively suppressing non-specific exosome adsorption. Based on this nano-interface, an ultrasensitive exosome ELISA assay was developed to afford a very low detection limit of 50 μL−1 with a 4![[thin space (1/6-em)]](https://www.rsc.org/images/entities/char_2009.gif) log dynamic range, which is substantially better than the existing methods. As a proof of concept for clinical applications, we adapted this platform to discriminate ovarian cancer patients from healthy controls by the quantitative detection of exosomes directly from 2 μL plasma without sample processing. Thus, this platform could provide a useful tool to facilitate basic and clinical investigations of exosomes for non-invasive disease diagnosis and to aid precision treatment.
log dynamic range, which is substantially better than the existing methods. As a proof of concept for clinical applications, we adapted this platform to discriminate ovarian cancer patients from healthy controls by the quantitative detection of exosomes directly from 2 μL plasma without sample processing. Thus, this platform could provide a useful tool to facilitate basic and clinical investigations of exosomes for non-invasive disease diagnosis and to aid precision treatment.
1. Introduction
Exosomes are small extracellular vesicles (EVs) of 30–150 nm in size secreted by most eukaryotic cells and have been recently found to play important roles in many cellular processes, such as cell communication and immune response, namely, via delivering various effectors or signaling molecules such as RNA, antigens, and infectious particles.1 Tumor-derived exosomes have been found to accumulate in human blood and malignant effusions2 and to be enriched in a set of biomolecules reflecting the states of cells.3 Thus, targeting exosomes could provide a promising tool for tumor biology and for early disease detection without the need for an invasive biopsy. However, the isolation and analysis of exosomes from biofluids is still very challenging. Standard ultracentrifugation isolation is time-consuming and yields low recovery and low purity.4 Conventional tools for exosome analysis, such as Western blot and enzyme-linked immunosorbent assays (ELISA), are limited by their low sensitivity, lengthy processes, and high sample demand. These technical challenges severely impede extensive biological and clinical studies of exosomes. Microfluidic technology has been adapted to address the challenges around the isolation5–9 and molecular analysis of exosomes.10–15 Compared to benchtop methods, these microsystems have greatly improved the limit of detection down to ∼106 vesicles per mL and have substantially reduced sample consumption and analysis time. The concentrations of EVs, including exosomes, have been reported to vary dramatically in various biological fluids, such as from 104 to 1010 mL−1 in plasma16–18 and even lower in cerebrospinal fluid (CSF).19,20 The quantitative analysis of low-abundance exosomes and the subtypes of interest in biofluids remains challenging.17 Moreover, highly sensitive exosome analysis is critical for many emerging studies, such as for the single-vesicle profiling of exosomal heterogeneity21 and the single-cell analysis of exosome secretion,22 to better elucidate exosome functions. Thus, there has been increasing interest in developing new microfluidic technologies with better sensitivity to meet the needs of the rapidly expanding exosome research and applications.Nanostructured materials are rapidly evolving as enabling interfaces for bioanalysis due to their unique physical and chemical properties. A variety of functional nanomaterials, including nanowires,23 nanoparticles,10,24 and graphene-based materials,25–27 have been intensively explored as novel transducers and recognition interfaces to improve the performance of molecular and cellular analysis. Combined with microfluidic technology, these nano-interfaces can not only substantially improve analytical techniques, but can also enable the probing of biological events previously inaccessible.28 For instance, the functionalization of microfluidic devices with nanostructured surfaces or polymeric coatings has been reported to greatly improve the capture of circulating tumor cells (CTCs) with or even without using affinity capture probes.29–31 Despite the advantages of nano-interfaces for bioanalysis, their applications to exosome analysis have not been demonstrated.
Herein, we report a nano-interfaced microfluidic exosome (nano-IMEX) platform based on a unique coating of graphene oxide (GO) and polydopamine (PDA) for ultrasensitive exosome detection (Fig. 1). We adapted the method of the mussel-inspired self-polymerization of dopamine because of the following reasons: it provides a very simple surface coating method applicable to virtually any material;32,33 its amine and catechol functional groups ease surface modification and bioconjugation;34 its highly hydrophilic PDA coating possesses excellent biocompatibility and resistance to biofouling;35 and lastly, the kinetics of PDA coating can be well controlled by tuning the reaction conditions such as pH, temperature, choice of oxidants and incubation time.36,37 However, most existing PDA coating methods are slow and require tens of hours to produce relatively thick surface coatings.37,38 Compared to these methods, our microfluidic coating approach markedly expedites the PDA deposition kinetics, which could promote the greater application of this promising coating material.37,38
 | ||
| Fig. 1 The nano-interfaced microfluidic exosome platform (nano-IMEX). (A) Schematic of a single-channel PDMS/glass device, with the exploded-view highlighting the coated PDMS chip containing an array of Y-shaped microposts. (B) Surface of the channel and microposts coated with graphene oxide (GO) and polydopamine (PDA) as a nanostructured interface for the sandwich ELISA of exosomes with enzymatic fluorescence signal amplification. (C) The procedure for surface functionalization of the microfluidic chips. | ||
While GO,25,27,39 PDA,33,40,41 or PDA-modified GO42 have been reported for the surface functionalization of biochips and sensors, our technology is distinct from these methods in terms of device design, coating method, and sensing mechanism. For instance, Yoon et al. developed a micropost-free CTC capture chip in which GO was absorbed onto the surface-patterned gold microarray for the non-covalent immobilization of antibodies.27 In contrast, our nano-IMEX chip contains Y-shaped microposts and is functionalized with a GO-induced, nanostructured PDA film by microfluidic layer-by-layer coating, which permits simple covalent protein conjugation via PDA chemistry. Recently, an electrochemical immunosensor was developed by modifying the electrode with a Prussian blue (PB)-GO nanocomposite coated with PDA to mainly stabilize the PB nanoparticles and to enhance charge transport.42 Differing from this sensor and other existing GO/PDA-based methods, the main function of the GO/PDA coating in our sensing platform is to create a 3D nanostructured interface to enhance the affinity capture of the target. To the best of our knowledge, this is the first report of a PDA-induced spontaneous formation of a 3D nanostructured PDA morphology.
Based on this new GO/PDA nanocoating, we devised a nano-IMEX chip that greatly enhances the efficiency of exosome immuno-isolation, while at the same time effectively suppressing the non-specific background. Compared to other microfluidic methods10,12,43 and to benchtop ELISA, our nano-IMEX chip substantially improves the detection sensitivity and dynamic range, as detailed in Table 1. Such high sensitivity enabled the quantitative detection of circulating exosomes directly from unprocessed plasma samples of minimal volume (2 μL), which is a key challenge in the clinical development of exosomal biomarkers. As a proof of concept, we used the nano-IMEX to successfully distinguish ovarian cancer cases from healthy controls. These results demonstrate the potential of the nano-IMEX platform for exosome research and for clinical disease diagnosis and treatment.
| Ref. | Device functionalities | ||
|---|---|---|---|
| Exosome isolation | Analysis | Sensitivity (LOD) | |
| 5 | Immuno-capture (IC) on channel surface | N/A | N/A |
| 6 | Size filtration | N/A | N/A |
| 7 | IC on beads with inertial sorting | Flow cytometry | N/A |
| 8 | Size-selective trapping on ciliated microposts | N/A | N/A |
| 10 | Off-chip ultracentrifugation | Immunomagnetic tagging & μNMR | >104 (sample volume: 1 μL) |
| 11 | IC on microchannel surface | Lipophilic dye staining | 0.5 pM |
| 12 | IC on nano-array | Nanohole-SPR | 670 aM |
| 13 | Immunomagnetic capture (IMC) | ELISA of intra-vesicular protein | ∼104 μL−1 |
| 14 | IMC | Immunostaining | 750 μL−1 |
| 15 | IMC | RT-PCR of mRNA | N/A |
| 43 | Electrohydrodynamic flow assisted IC | Colorimetric ELISA | 2760 μL−1 |
| This work | IC on GO/PDA nano-interface | Fluorogenic ELISA | 50 μL−1 (80 aM) |
2. Experimental
2.1. Chip fabrication and surface coating
The microfluidic chips were fabricated using standard photolithography (Fig. S1A†). In brief, a silicon wafer was cleaned with piranha solution and coated with a SU-8 2010 layer of 30 μm thickness by spin-coating at 4500 rpm for 60 s. The wafer was prebaked at 65 °C for 2 min and at 95 °C for 4 min and exposed to UV for a total energy dose of 110 mJ cm−2. The wafer was post-baked at 65 °C for 1 min and 95 °C for 4 min, followed by a 2 min development and hard-baking at 165 °C for 30 min. All the SU-8 molds were treated with trimethylchlorosilane under vacuum for 4 h. For PDMS chip fabrication, a 30 g mixture at a 10 (base):1 (curing agent) ratio was poured on the mold and cured in the oven at 70 °C for 4 h. PDMS pieces were cut and peeled off from the mold and holes were punched in. After surface cleaning with UV Ozone (UVO-Cleaner®42, Jelight Company Inc.), the glass slide and PDMS slab were bonded permanently.
For surface modification of the PDMS chips, 5% (3-aminopropyl)triethoxysilane (APTES) in anhydrous ethanol was pumped through the channels for 1 h at room temperature. After washing with water three times, GO solution (0.5 mg mL−1) flowed through the channels and GO nanosheets were adsorbed onto the APTES-coated surface via electrostatic interaction. The subsequent PDA coating was carried out on a 50 °C heating plate. Dopamine was dissolved in 10 mM Tris buffer (2 mg mL−1, pH 9.5) and flowed through the GO-coated channels under a constant flow rate (0.5 μL min−1) using a syringe pump. Upon completion of the coating, the channel was washed with water carefully to remove excess PDA solution. For antibody immobilization, the coated channel was filled with Protein G in PBS (0.2 mg mL−1) and reacted for 16 h at room temperature. Excess protein was washed away and the anti-CD81 capture antibody (20 μg mL−1) was immobilized via Protein G-IgG interaction. Prior to use, the prepared PDA-GO microchip was blocked with 5% BSA and 1% human IgG for 1 h. To assess the immobilization performance, we used FITC-labelled CD81 (50 μg mL−1) to react with Protein G following the same process and then measured the resultant fluorescence signal. The prepared GO/PDA microchip was stored at 4 °C in a refrigerator before use.
2.2. Chip characterization with exosome standards
Lyophilized exosome standard from a COLO-1 cell culture supernatant was purchased from HansaBioMed, Ltd (Tallinn, Estonia). Exosome pellets were suspended in water and measured by NTA to determine the concentration. The stock solution was aliquoted and stored at −80 °C. Exosome standards for the calibration experiments were freshly prepared from the aliquots by serial 10× dilution in PBS. 20 μL of the standards with different concentrations were pumped into the microchips using a syringe pump. After exosome capture, unbound exosomes were washed away with 20 μL PBS. The on-chip-captured exosomes were then detected by a mixture of three biotinylated detection antibodies for CD63, CD81 and EpCAM (20 μg mL−1 each). The chip was washed with 10 μL PBS again and 7.5 μL 20 ng mL−1 streptavidin conjugated β-galactosidase (SβG) prepared in the PBS working solution (PBSW, 0.5 mM DL-dithiothreitol, 2 mM MgCl2, and 5% BSA) was introduced as the reporter enzyme. Subsequently, 7.5 μL di-β-D-galactopyranoside (FDG) (500 μM) in the PBSW buffer was introduced and reacted for 0.5 h in the dark. Fluorescence images were acquired using an inverted epifluorescence microscope equipped with a 20× (N.A. = 0.35) Zeiss objective and a scientific CMOS camera (OptiMOS, QImaging) controlled by the open source software Micro-Manager 1.4.2.3. Clinical exosome analysis
Human plasma samples were collected from healthy donors and ovarian cancer patients. De-identified samples were obtained from the Biospecimen Repository Core Facility at the University of Kansas Cancer Center after approval from the internal Human Subjects Committee. Following the protocols that we reported in the previous studies,13 circulating exosomes in plasma samples were purified by differential ultracentrifugation and then characterized by NTA sizing and quantification, Bradford assay, and Western blot. The purified exosomes in PBS were stored in a −80 °C freezer. In the direct analysis of plasma samples from patients and healthy controls, we diluted a 2 μL plasma sample by 10 times with PBS first to ease injection using a 50 μL microsyringe. Then, 20 μL of the diluted plasma samples was injected through the microchips for exosome capture and fluorescent ELISA detection using a syringe pump. The processes for the exosome assay and data acquisition were the same as that for the colon cancer exosome standards discussed above. In this case, we used CD81 mAb for the capture and a cocktail of biotinylated mAbs (20 μg mL−1 each) for CD9 and CD81 and EpCAM as the detection antibody. The measured signals were corrected by the background levels measured in parallel for data analysis. To statistically assess the data from the patient and healthy control groups, a two-sample Welch's t-test with unequal variances was performed and all the P-values, unless otherwise specified, were calculated at a significance level of 0.05.3. Results & discussion
3.1. Principles of the device design and functionalization
The complete method is schematized in Fig. 1. Our microfluidic design features an array of Y-shaped microposts, as illustrated in Fig. 1A, which was designed to enhance the capture efficiency for the exosomes flowing through the microchannel. This improvement could be attributed to the following reasons. First, compared to the commonly used cylindrical microposts, the Y-shaped geometry provides a larger surface area at the same footprint. Second, the array of Y-shaped microposts constructs a channel network in which a flow is bifurcated and mixed with adjacent streams periodically. Finite element simulations of the flow velocity profile inside the micropost array (Fig. S1B†) show asymmetric flow bifurcation at the upstream arms of the Y-shaped microposts, as indicated by the length of the arrows that represent the local fluid flow strength. Such flow bifurcation and merging enhance the mass transfer of relatively large exosomal vesicles to the surface for affinity capture. Last, the curved channels defined between the concaved microposts could further enhance the mixing efficiency due to the secondary Dean flow.44In addition to flow manipulation, surface properties are the critical factors to improve solid-phase affinity assays. In our device, the surface of the channel and microposts was coated with a nanostructured GO/PDA film to increase the surface area and antibody immobilization density. Based on this biorecognition nano-interface, we developed a sandwich exosome ELISA assisted with enzymatic signal amplification for the immunological capture and detection of specific exosomes (Fig. 1B). The nanostructured GO/PDA film was prepared by a layer-by-layer coating method, as detailed in Fig. 1C. This started with the APTES silanization of UV-activated PDMS and the glass surfaces. A film of GO nanosheets was then deposited on the silanized surface via electrostatic interaction.45 The self-polymerization of dopamine under microfluidic control is performed at pH 9.5 and at 50 °C, creating a nanostructured PDA coating onto the GO film. Reactive sites on the PDA coating allow easy covalent coupling of Protein G to immobilize the capture antibodies in an oriented fashion. Additional information regarding chip fabrication, surface modification, and the assay operation is provided in the ESI.†
3.2. Microfluidic GO/PDA coating
We first characterized the microfluidic GO/PDA coating method. Our method yielded uniform surface coating as shown by the image of a coated multi-channel chip and the scanning electron microscopy (SEM) image of the PDMS micropost channel (Fig. 2A). The image displays different colors of the coatings prepared with various conditions, as discussed below. First, surface modification with GO nanosheets by simple and robust electrostatic deposition45 created a microscale 3D surface landscape due to the high flexibility of the thin GO film (Fig. 2B).46 We then used a single-step microfluidic method to coat the GO surface with a highly hydrophilic and biocompatible PDA layer via the bioinspired polymerization of dopamine32 under constant laminar flow conditions (0.5 μL min−1). As expected, the PDA coating grew with the polymerization time, showing an increasingly darker brown color (Fig. 2B and C, insets). The averaged GO/PDA coating thickness estimated by SEM increased from ∼70 nm for the 1 h reaction to ∼230 nm for the 3 h reaction. For comparison, it was reported that the conventional processes under static or shaking conditions required >24 h to form a PDA coating thicker than 60 nm.37,38 The microfluidic deposition rate was comparable with that of a rapid PDA coating method using vigorous stirring at 60 °C.38 In contrast to the dynamic microfluidic coating, we conducted static dopamine polymerization in microchannels for 10 h, which deposited a much thinner PDA film (<50 nm). These results verify that the microfluidic hydrodynamic coating was able to greatly enhance the PDA deposition kinetics, which could facilitate the biomedical applications of this bioinspired coating and adhesive material.33 | ||
| Fig. 2 Characterization of microfluidic GO/PDA coating. (A) SEM image and digital image (inset) of a GO/PDA-coated chip containing the Y-shaped PDMS microposts. (B) SEM image of a GO-coated channel (inset) showing the microscale 3D surface topology formed by GO coating. (C, D) SEM of the GO/PDA-coated channels with different reaction time for PDA deposition (inset) showing distinct morphologies of the GO/PDA interface. (E) SEM image of the PDA-coated channel (inset) showing a much smoother and more solid PDA film formed on the surface without GO coating. (F) Raman spectra of the coatings. Inset: Red shift of the G band of GO after PDA coating. The GO/PDA plot is offset for comparison. | ||
The unexpected phenomenon that we observed was the morphological change of PDA coatings with the polymerization time. As observed in Fig. 2C, a wrinkled solid PDA film was formed on the GO layer after a 2 h reaction and then grew into a 3D monolith-like structure with micro-/nanoscale pores after the 3 h reaction (Fig. 2D and S2A†). In addition to the reaction time, we also tested different flow and temperature conditions that affect the PDA deposition kinetics. Static microfluidic coating for 10 h only produced a wrinkled solid PDA film (Fig. S2B†) and a similar morphology was yielded from the reaction at a lower temperature of 37 °C and 0.5 μL min−1 for 3 h. These results suggest the importance of fast PDA deposition kinetics for obtaining the nanostructured morphology. To investigate the role of GO in the formation of this unique GO/PDA morphology, we performed a microfluidic PDA coating of chips without GO treatment under otherwise identical conditions. As evident in Fig. 2E, a much smoother solid PDA film was yielded, which was consistent with the previous reports.36,38 The lack of surface priming by GO also resulted in a thinner PDA coating than those formed with GO coating, as indicated by the lighter brown color of the chip (Fig. 2E, inset). These findings suggest that the GO coating is another critical factor in inducing the nanostructured PDA morphology in addition to the expedited microfluidic deposition kinetics discussed above.
Such GO-induced 3D nanostructured morphology is distinct from the smooth or granular PDA morphologies formed on GO nanosheets26 and various substrates36,38,47,48 previously reported with the conventional methods. Based on our results and the previously reported results, we speculate that the effects of GO on the PDA deposition and the unique morphology could be attributed to three factors. First, the large surface area and hydrophobicity of the GO coating could absorb more dopamine oligomers and PDA nanoaggregates. It has been reported that coating the Si surface with hydrophobic polymers largely increases the PDA deposition rate owing to the higher surface roughness and stronger interactions between dopamine and the polymer coatings.36 Second, the 3D microscale topology of the GO coating may afford local mixing to further promote the mass transfer of dopamine and PDA nanoaggregates in solution. Lastly, the GO coating may facilitate PDA deposition as a surface-bound oxidant because the deposition kinetics have been found to depend on dopamine oxidation.48,49 We studied the Raman spectra of a GO-coated chip before and after PDA coating (Fig. 2F). Both spectra exhibited the characteristic peaks of GO at 1373 cm−1 (D band) and 1592 cm−1 (G band). A slight red shift of the G band was observed after PDA coating, which confirms the reduction of GO by dopamine self-polymerization.50 The polymerization and deposition behavior of PDA on various surfaces are not clearly understood and various mechanisms have been proposed.32,36,48,49 Systematic studies are still needed to elucidate the formation process of the nanostructured PDA film on the GO coating observed here. Moreover, this study has developed a simple method to prepare a new PDA surface coating with a substantially increased surface area and 3D porous structure. Such features make the new GO/PDA coating a promising nano-interface for ultrasensitive exosome analysis.
3.3. Characterization of exosome detection and profiling
Using the GO/PDA interface, we developed and characterized an on-chip, solid-phase sandwich exosome ELISA using commercially available exosome standards purified from the colon cancer cell line COLO-1 culture medium. The PDA coating provides numerous reactive sites for the easy covalent coupling of Protein G to immobilize monoclonal antibodies (mAbs) in an oriented fashion to preserve the activity of the antibodies. We validated the immobilization approach with 50 μg mL−1 FITC-labeled CD81 mAb and observed very low non-specific protein adsorption in the absence of Protein G and a strong fluorescent signal from Protein G-linked mAbs (Fig. S3†). To assess non-specific exosome adsorption on the GO/PDA interface, we compared exosome capture on the nano-IMEX chip with and without anti-CD81 mAb. A very low non-specific adsorption of COLO-1 exosomes on the GO/PDA interface was observed in the absence of CD81 mAb, as exemplified by the typical SEM image in Fig. 3A, which can be attributed to the high hydrophilicity of the PDA coating.32 In the presence of the capture antibody, a high density of COLO-1 exosomes captured on the GO/PDA nano-interface was visualized (Fig. 3B), indicating that our method confers a high exosome capture efficiency. A round-cup morphology typical of exosomes was observed, with the majority being smaller than 150 nm, in contrast to the broader size range of the ultracentrifugation-purified exosomes measured by nanoparticle tracking analysis (NTA, Fig. S4†). The narrow size distribution observed herein is consistent with that of the bead-based method,13 suggesting an improved isolation specificity than the ultracentrifugation methods.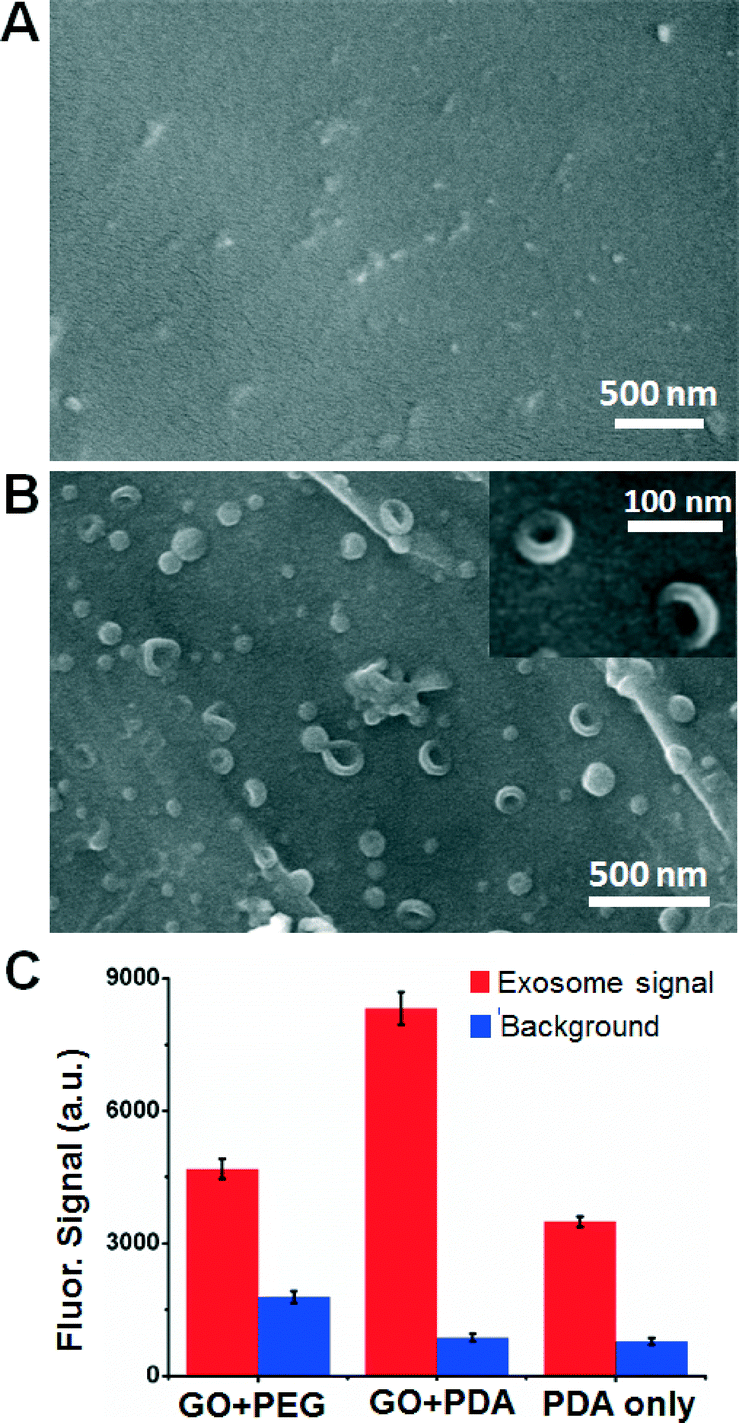 | ||
| Fig. 3 Evaluation of the specificity of exosome capture by the GO/PDA chip. (A) SEM examination of non-specific exosome capture on a GO/PDA interface without an antibody. (B) SEM image showing densely captured COLO-1 cell exosomes on a GO/PDA surface coated with the CD81 antibody. Inset: Cup-shaped morphology of the exosomes. (C) Comparison of exosome ELISA readout and non-specific background levels obtained with the chips coated by GO/PEG, GO/PDA and PDA only, respectively. The exosome concentration was 5 × 10⁴ μL−1. | ||
To evaluate the effects of surface functionalization on exosome ELISA, we compared the GO/PDA nano-interface with the commonly used GO/PEG and PDA-only coatings for detecting COLO-1 exosomes under the same assay conditions (see the ESI,† Methods). It was observed that the GO/PDA nano-interface yielded a significantly higher assay signal and lower non-specific background than the GO/PEG-coated surface (Fig. 3C). Such an improvement may be attributed to the collective effects of the better surface coverage, the 3D nanoporous structure, and the larger surface area that the thick PDA film affords, as opposed to the PEG monolayer formed on the GO surface. The GO/PDA nano-interface and the PDA-only coating exhibited almost the same level of background because of the anti-fouling property of the PDA coating. However, the GO/PDA nano-interface yielded a much higher signal intensity than that of the PDA-only coating, which can be explained by its substantially larger surface area and 3D porous structure, which improve the density of the capture antibody and the hydrodynamic interactions between the exosomes and the surface.
The nano-IMEX chip was then characterized for quantitative exosome detection. To this end, we used anti-CD81 mAb for capture and a mixture of detection mAbs specific to the two common exosome markers (tetraspanins CD63 and CD81) and a tumor-associated marker, the Epithelial cell adhesion molecule (EpCAM). The calibration curve obtained under an optimized flow rate of 0.5 μL min−1 showed quantitative detection over a 4log dynamic range, with a very low limit of detection (LOD) of ∼50 exosomes μL−1, as calculated from the blank signal plus three standard deviations (Fig. 4A). For comparison, parallel measurements were conducted on the control chips modified by a common silanization and by antibody-linking chemistry using 3-MPS and GMBS (see the ESI,† Methods). These control chips yielded lower signal intensity and much higher background, which resulted in a LOD of ∼103 μL−1, which is 20-fold worse than that of the nano-IMEX chip (Fig. 4A). This comparison demonstrates the advantage of the GO/PDA nano-interface in substantially improving the analytical performance of the microfluidics-based immuno-capture and detection of exosomes. As shown in Table 1, the obtained LOD in a concentration of 80 aM was nearly one order of magnitude higher than that of the most sensitive microfluidic methods reported to date10,12 and 103-fold higher than that of benchtop chemiluminescence ELISA. Moreover, the dynamic range was expanded by about two orders of magnitude.
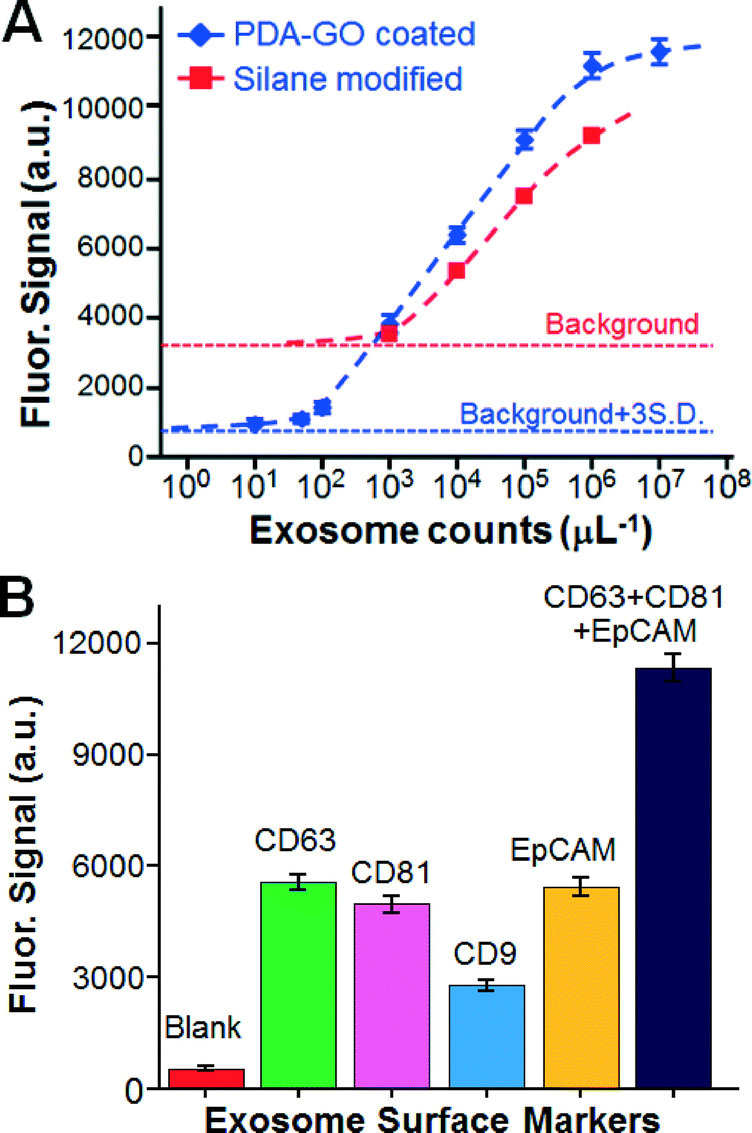 | ||
| Fig. 4 Characterization of the nano-IMEX chip using COLO-1 exosome standards. (A) Comparing the GO/PDA interfaced and silane-treated chips for quantitative exosome detection. (B) Surface protein profiling of COLO-1 cell exosomes (106 μL−1) captured by CD81 mAb. | ||
The surface composition of exosomes is important for their inter-cellular transfer and biological functions and may provide specific biomarkers to diseases.10,12,51 To demonstrate the quantitative surface profiling of exosomes, we measured individual COLO-1 exosome subpopulations expressing CD9, CD63, CD81 or EpCAM (Fig. 4B). We found that the exosomal expression of these surface proteins appeared to be different, with the CD9 level being much lower than the others. This observed expression pattern for the tetraspanins (CD9, CD63, and CD81) is consistent with that characterized by the manufacturer of the exosome standards. Quantification of the total exosomes captured by the CD81 antibody was attempted using a mixture of detection antibodies. As expected, a significantly higher fluorescent signal was obtained, which should improve the detection sensitivity for specifically captured exosome subpopulations. Our results demonstrate the feasibility of our technology for not only the sensitive quantification of total exosomes but also for exosome profiling to identify potential exosomal fingerprints associated with diseases. The five-channel chip devised herein (Fig. 2A) allowed us to conduct five measurements in parallel, which helped to reduce the chip-to-chip variation. The multiplicity of exosome profiling can be readily improved by scaling up the chip design.
3.4. Clinical analyses of circulating exosomes
To assess our method for clinical application, we examined circulating exosomes in clinical plasma samples collected from ovarian cancer (OvCa) patients. The overexpression of total plasma-borne exosomes52 and certain subpopulations in ascites fluid10 has been reported in OvCa. In addition, our previous molecular profiling study observed the increased abundance of both total exosomes and the subpopulations harboring individual proteins CD9, CD63, CD81 and EpCAM in OvCa plasma samples compared to in the cancer-free controls.14 These findings established a good model to validate our platform for the sensitive and quantitative detection of exosomal biomarkers in clinical samples. Therefore, this proof-of-concept study was focused on the detection of the overall expression level of generic exosome markers (CD9 and CD81) and disease markers (EpCAM) rather than on molecular profiling, while individual exosomal biomarkers could also provide molecular signatures for disease diagnosis. For each subject tested herein, the exosomes were purified from a portion of the plasma sample by ultracentrifugation and quantified by NTA to determine the exosome concentration in plasma. For microfluidic analysis using the five-channel chip, a negative control measurement was conducted in parallel with the other four measurements on each chip to correct both for the non-specific background and for the chip-to-chip variation.The nano-IMEX platform was first calibrated using dilutions of both pre-purified exosomes and the plasma sample from the same patient (Fig. 5A). Our system conferred high detection sensitivity for exosomes purified from OvCa, with a LOD consistent with that for COLO-1 cell-derived exosomes. Higher signals were detected for the plasma dilutions than for the dilutions of pre-purified exosomes at the nominally same exosome concentrations. This is due to the fact that the ultracentrifugation-based protocols only recover a fraction of exosomes, thus underestimating the true exosome levels in plasma.4 This result underscores the importance of developing tools for the direct analysis of clinical specimens to mitigate sample processing-caused variance.
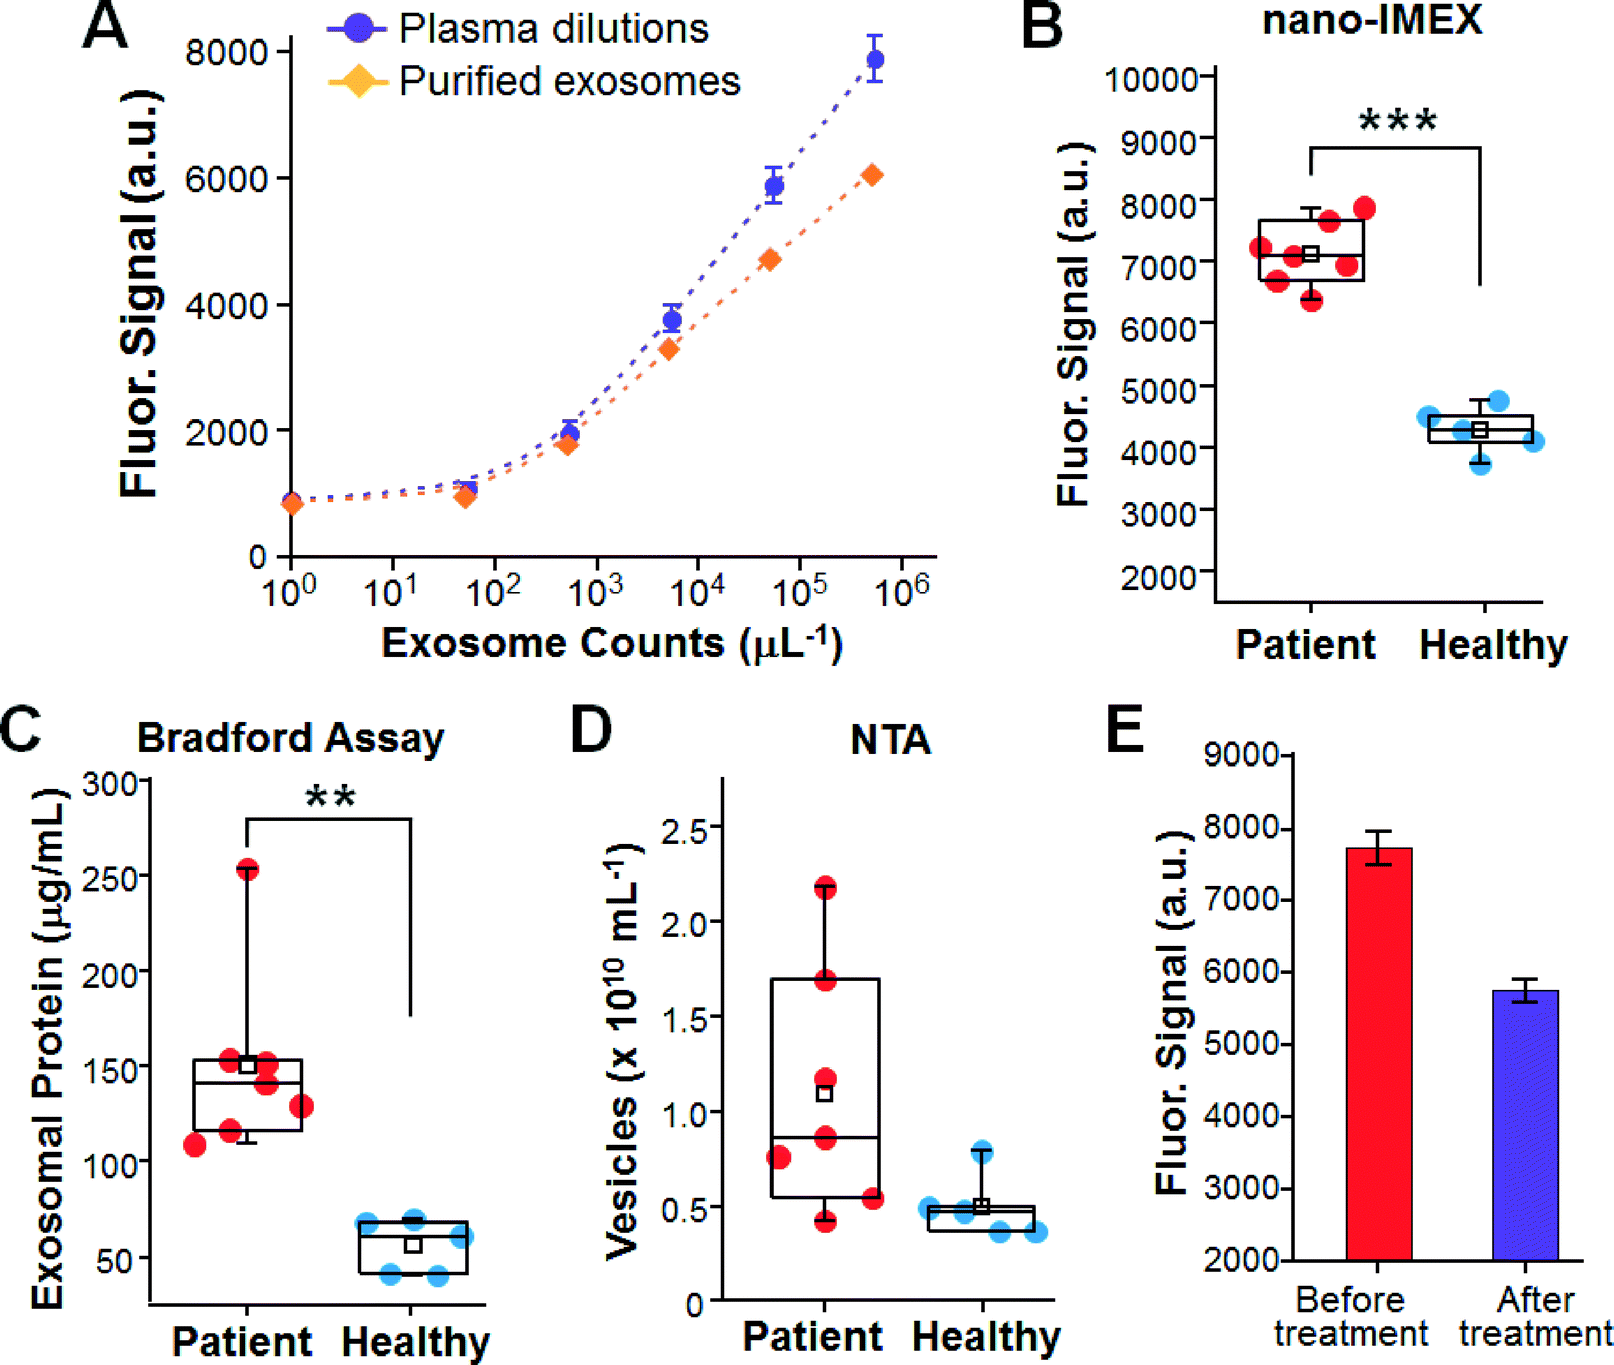 | ||
| Fig. 5 Clinical analyses of plasma-borne exosomes in ovarian cancer (OvCa). (A) Calibration curves for detecting exosomes pre-purified and directly from patient plasma. (B) Boxplots overlaid with dot plots for clinical sample analysis by nano-IMEX chips. (C) Bradford assay of the total exosomal proteins and (D) NTA counting of exosomes purified from the same samples used in (B). (***, p < 0.001; **, p < 0.01). (E) Detection of plasma exosomes in an OvCa patient before and after treatment. | ||
We then attempted to detect exosomes directly from clinical plasma samples collected from seven OvCa patients and five healthy donors. A small volume of each plasma sample (2 μL) was diluted by 10 times to avoid clogging of the microchannels and to ease sample injection into the channels with a syringe pump. Fig. 5B shows that the OvCa group was well discriminated from the cancer-free controls (p < 0.001) by detecting the plasma-borne exosomes. The significantly higher expression level detected by the nano-IMEX could be attributed to the increased expression of both generic exosome markers (CD9 and CD81) and tumor-associated EpCAM, as observed in our previous study.14 The microfluidic measurements were then compared to the standard assays of exosomes purified and enriched from the same plasma samples. A significant overexpression of total exosomal protein in OvCa was observed by the standard Bradford assay (p < 0.01, Fig. 5C), which is consistent with the microfluidic results and the previously reported observations.52 NTA counting of the purified exosomes also detected an increase in the averaged exosome level in the patients, but the large variation observed for the patient samples confounds cancer diagnosis based on the overall abundance of exosomes only (p = 0.051, Fig. 5D). Compared to NTA counting, the microfluidic analysis yielded better diagnostic performance by quantitatively detecting exosome markers. Previous studies have also shown that counting exosomes alone was insufficient for cancer diagnose and that targeting specific exosome markers could markedly improve the clinical sensitivity and specificity for disease diagnosis.12,51 Those findings, together with ours, support the necessity of developing sensitive, quantitative and rapid technologies for molecular exosome analysis to facilitate their clinical utilization. In addition to cancer diagnosis, exosomes have been studied as a new tool for therapy monitoring.10 We attempted to use the nano-IMEX chip to quantitatively detect the expression of exosomal markers in an OvCa patient in response to cancer treatment. We observed a ∼10-fold decrease in the expression level for the post-treatment sample than that found at the time of diagnosis (Fig. 5E), which is presumably due to the reduced expression levels of all three markers (CD9, CD81 and EpCAM), as discussed for Fig. 5B above. SEM inspection of the chips after the assays showed a substantially lower density of exosomes captured from the post-treatment sample on the nano-interface than from the pre-treatment sample (Fig. S5A†), thus verifying the quantitative detection by the microfluidic exosome ELISA. Lower levels of total exosomal protein and exosome number were observed for the post-treatment sample by the measurements of NTA and the Bradford assay, respectively (Fig. S5B†). These results should verify that our on-chip exosome ELISA is able to quantitatively detect the expression of exosomal markers. A more systematic clinical evaluation is required to validate our technology for clinical disease diagnosis and monitoring patients, which is beyond the scope of this study. Moreover, the proof-of-concept studies on sensitive and quantitative exosome detection in clinical samples presented in Fig. 5 should demonstrate the potential applications of our nano-IMEX platform to cancer diagnosis and monitoring treatment response.
4. Conclusions
We developed a simple microfluidic approach to prepare a GO-induced nanostructured PDA coating. Based on this unique biocompatible nano-interface, we also developed a new microfluidic exosome sensing platform. We showed that the nano-interface greatly enhances the immuno-isolation efficiency, while at the same time effectively suppressing the effects of non-specific exosome adsorption. This novel interface enables the development of an ultrasensitive and specific ELISA assay for molecular analysis of exosomes. We demonstrated the applications of this nano-IMEX platform in molecular profiling and in the quantitative detection of exosomes purified from a colon cancer cell line or directly in plasma samples from ovarian cancer patients. The chip is scalable for the multiplexed analysis of exosomes and for the high-throughput screening of clinical samples. Therefore, this platform should provide a useful tool to facilitate exosome research and the clinical utilization of exosomes for disease detection and treatment.Acknowledgements
We acknowledge the microfabrication core facility at the KU COBRE Center for Molecular Analysis of Disease Pathways for device fabrication and KU Cancer Center's Biospecimen Repository Core Facility for human specimens. We thank Nasir Merchant from the University of California, Berkeley, USA, for assistance in COMSOL simulation. This study was supported by the J. R. and Inez Jay Award (KU), the grants 1R21CA186846 (NCI) and P20GM103638 (NIGMS) from the NIH. P. Z. is supported by the postdoc award and M. H. is supported by the Developmental Research Project Award, both from the Kansas IDeA Network of Biomedical Research Excellence (K-INBRE) under the grant P20GM103418 from NIH/NIGMS.References
- P. D. Robbins and A. E. Morelli, Nat. Rev. Immunol., 2014, 14, 195–208 CrossRef CAS PubMed.
- V. Huber, S. Fais, M. Iero, L. Lugini, P. Canese, P. Squarcina, A. Zaccheddu, M. Colone, G. Arancia, M. Gentile, E. Seregni, R. Valenti, G. Ballabio, F. Belli, E. Leo, G. Parmiani and L. Rivoltini, Gastroenterology, 2005, 128, 1796–1804 CrossRef CAS.
- C. Yang and P. D. Robbins, Clin. Dev. Immunol., 2011, 2011, 842849 Search PubMed.
- B. J. Tauro, D. W. Greening, R. A. Mathias, H. Ji, S. Mathivanan, A. M. Scott and R. J. Simpson, Methods, 2012, 56, 293–304 CrossRef CAS PubMed.
- C. Chen, J. Skog, C. H. Hsu, R. T. Lessard, L. Balaj, T. Wurdinger, B. S. Carter, X. O. Breakefield, M. Toner and D. Irimia, Lab Chip, 2010, 10, 505–511 RSC.
- R. T. Davies, J. Kim, S. C. Jang, E. J. Choi, Y. S. Gho and J. Park, Lab Chip, 2012, 12, 5202–5210 RSC.
- J. S. Dudani, D. R. Gossett, H. T. Tse, R. J. Lamm, R. P. Kulkarni and D. D. Carlo, Biomicrofluidics, 2015, 9, 014112 CrossRef PubMed.
- Z. Wang, H. J. Wu, D. Fine, J. Schmulen, Y. Hu, B. Godin, J. X. Zhang and X. Liu, Lab Chip, 2013, 13, 2879–2882 RSC.
- K. Lee, H. Shao, R. Weissleder and H. Lee, ACS Nano, 2015, 9, 2321–2327 CrossRef CAS PubMed.
- H. Shao, J. Chung, L. Balaj, A. Charest, D. D. Bigner, B. S. Carter, F. H. Hochberg, X. O. Breakefield, R. Weissleder and H. Lee, Nat. Med., 2012, 18, 1835–1840 CrossRef CAS PubMed.
- S. S. Kanwar, C. J. Dunlay, D. M. Simeone and S. Nagrath, Lab Chip, 2014, 14, 1891–1900 RSC.
- H. Im, H. Shao, Y. I. Park, V. M. Peterson, C. M. Castro, R. Weissleder and H. Lee, Nat. Biotechnol., 2014, 32, 490–495 CrossRef CAS PubMed.
- M. He, J. Crow, M. Roth, Y. Zeng and A. K. Godwin, Lab Chip, 2014, 14, 3773–3780 RSC.
- Z. Zhao, Y. Yang, Y. Zeng and M. He, Lab Chip, 2016, 16, 489–496 RSC.
- H. Shao, J. Chung, K. Lee, L. Balaj, C. Min, B. S. Carter, F. H. Hochberg, X. O. Breakefield, H. Lee and R. Weissleder, Nat. Commun., 2015, 6, 6999 CrossRef CAS PubMed.
- E. van der Pol, A. G. Hoekstra, A. Sturk, C. Otto, T. G. van Leeuwen and R. Nieuwland, J. Thromb. Haemostasis, 2010, 8, 2596–2607 CrossRef CAS PubMed.
- J. I. Zwicker, H. A. Liebman, D. Neuberg, R. Lacroix, K. A. Bauer, B. C. Furie and B. Furie, Clin. Cancer Res., 2009, 15, 6830–6840 CrossRef CAS PubMed.
- Y. Yuana, T. H. Oosterkamp, S. Bahatyrova, B. Ashcroft, P. Garcia Rodriguez, R. M. Bertina and S. Osanto, J. Thromb. Haemostasis, 2010, 8, 315–323 CrossRef CAS PubMed.
- K. W. Witwer, E. I. Buzas, L. T. Bemis, A. Bora, C. Lasser, J. Lotvall, E. N. Nolte-'t Hoen, M. G. Piper, S. Sivaraman, J. Skog, C. Thery, M. H. Wauben and F. Hochberg, J. Extracell. Vesicles, 2013, 2, 20360 Search PubMed.
- J. M. Street, P. E. Barran, C. L. Mackay, S. Weidt, C. Balmforth, T. S. Walsh, R. T. Chalmers, D. J. Webb and J. W. Dear, J. Transl. Med., 2012, 10, 5 CrossRef CAS PubMed.
- Z. J. Smith, C. Lee, T. Rojalin, R. P. Carney, S. Hazari, A. Knudson, K. Lam, H. Saari, E. Lazaro Ibañez, T. Viitala, T. Laaksonen, M. Yliperttula and S. Wachsmann-Hogiu, J. Extracell. Vesicles, 2015, 4, 28533 Search PubMed.
- K. J. Son, A. Rahimian, D. S. Shin, C. Siltanen, T. Patel and A. Revzin, Analyst, 2016, 141, 679–688 RSC.
- S. K. Lee, G. S. Kim, Y. Wu, D. J. Kim, Y. Lu, M. Kwak, L. Han, J. H. Hyung, J. K. Seol, C. Sander, A. Gonzalez, J. Li and R. Fan, Nano Lett., 2012, 12, 2697–2704 CrossRef CAS PubMed.
- H. J. Chung, C. M. Castro, H. Im, H. Lee and R. Weissleder, Nat. Nanotechnol., 2013, 8, 369–375 CrossRef CAS PubMed.
- Y. Liu, X. Dong and P. Chen, Chem. Soc. Rev., 2012, 41, 2283–2307 RSC.
- W. Hu, G. He, H. Zhang, X. Wu, J. Li, Z. Zhao, Y. Qiao, Z. Lu, Y. Liu and C. M. Li, Anal. Chem., 2014, 86, 4488–4493 CrossRef CAS PubMed.
- H. J. Yoon, T. H. Kim, Z. Zhang, E. Azizi, T. M. Pham, C. Paoletti, J. Lin, N. Ramnath, M. S. Wicha, D. F. Hayes, D. M. Simeone and S. Nagrath, Nat. Nanotechnol., 2013, 8, 735–741 CrossRef CAS PubMed.
- B. P. Helmke and A. R. Minerick, Proc. Natl. Acad. Sci. U. S. A., 2006, 103, 6419–6424 CrossRef CAS PubMed.
- W. Li, E. Reategui, M. H. Park, S. Castleberry, J. Z. Deng, B. Hsu, S. Mayner, A. E. Jensen, L. V. Sequist, S. Maheswaran, D. A. Haber, M. Toner, S. L. Stott and P. T. Hammond, Biomaterials, 2015, 65, 93–102 CrossRef CAS PubMed.
- W. Chen, S. Weng, F. Zhang, S. Allen, X. Li, L. Bao, R. H. Lam, J. A. Macoska, S. D. Merajver and J. Fu, ACS Nano, 2013, 7, 566–575 CrossRef CAS PubMed.
- S. Wang, K. Liu, J. Liu, Z. T. Yu, X. Xu, L. Zhao, T. Lee, E. K. Lee, J. Reiss, Y. K. Lee, L. W. Chung, J. Huang, M. Rettig, D. Seligson, K. N. Duraiswamy, C. K. Shen and H. R. Tseng, Angew. Chem., Int. Ed., 2011, 50, 3084–3088 CrossRef CAS PubMed.
- H. Lee, S. M. Dellatore, W. M. Miller and P. B. Messersmith, Science, 2007, 318, 426–430 CrossRef CAS PubMed.
- Y. Liu, K. Ai and L. Lu, Chem. Rev., 2014, 114, 5057–5115 CrossRef CAS PubMed.
- H. Lee, J. Rho and P. B. Messersmith, Adv. Mater., 2009, 21, 431–434 CrossRef CAS PubMed.
- B. D. McCloskey, H. B. Park, H. Ju, B. W. Rowe, D. J. Miller, B. J. Chun, K. Kin and B. D. Freeman, Polymer, 2010, 51, 3472–3485 CrossRef CAS.
- J. H. Jiang, L. P. Zhu, L. J. Zhu, B. K. Zhu and Y. Y. Xu, Langmuir, 2011, 27, 14180–14187 CrossRef CAS PubMed.
- V. Ball, D. Del Frari, V. Toniazzo and D. Ruch, J. Colloid Interface Sci., 2012, 386, 366–372 CrossRef CAS PubMed.
- P. Zhou, Y. Deng, B. Lyu, R. Zhang, H. Zhang, H. Ma, Y. Lyu and S. Wei, PLoS One, 2014, 9, e113087 Search PubMed.
- E. Morales-Narvaez and A. Merkoci, Adv. Mater., 2012, 24, 3298–3308 CrossRef CAS PubMed.
- Y. Wan, D. Zhang, Y. Wang, P. Qi and B. Hou, Biosens. Bioelectron., 2011, 26, 2595–2600 CrossRef CAS PubMed.
- M. E. Lynge, P. Schattling and B. Stadler, Nanomedicine, 2015, 10, 2725–2742 CrossRef CAS PubMed.
- R.-z. Zhang, B.-g. Pan, H.-n. Wang, J.-m. Dan, C.-l. Hong and H.-l. Li, RSC Adv., 2015, 5, 38176–38182 RSC.
- R. Vaidyanathan, M. Naghibosadat, S. Rauf, D. Korbie, L. G. Carrascosa, M. J. Shiddiky and M. Trau, Anal. Chem., 2014, 86, 11125–11132 CrossRef CAS PubMed.
- A. P. Sudarsan and V. M. Ugaz, Proc. Natl. Acad. Sci. U. S. A., 2006, 103, 7228–7233 CrossRef CAS PubMed.
- S. Yang, X. Feng, S. Ivanovici and K. Mullen, Angew. Chem., Int. Ed., 2010, 49, 8408–8411 CrossRef CAS PubMed.
- D. R. Dreyer, A. D. Todd and C. W. Bielawski, Chem. Soc. Rev., 2014, 43, 5288–5301 RSC.
- R. A. Zangmeister, T. A. Morris and M. J. Tarlov, Langmuir, 2013, 29, 8619–8628 CrossRef CAS PubMed.
- V. Ball, D. D. Frari, V. Toniazzo and D. Ruch, J. Colloid Interface Sci., 2012, 386, 366–372 CrossRef CAS PubMed.
- F. Bernsmann, V. Ball, F. Addiego, A. Ponche, M. Michel, J. J. Gracio, V. Toniazzo and D. Ruch, Langmuir, 2011, 27, 2819–2825 CrossRef CAS PubMed.
- Z. Hu, Y. Huang, C. Zhang, L. Liu, J. Li and Y. Wang, J. Mater. Chem. B, 2014, 2, 8587–8597 RSC.
- S. A. Melo, L. B. Luecke, C. Kahlert, A. F. Fernandez, S. T. Gammon, J. Kaye, V. S. LeBleu, E. A. Mittendorf, J. Weitz, N. Rahbari, C. Reissfelder, C. Pilarsky, M. F. Fraga, D. Piwnica-Worms and R. Kalluri, Nature, 2015, 523, 177–182 CrossRef CAS PubMed.
- D. D. Taylor and C. Gercel-Taylor, Gynecol. Oncol., 2008, 110, 13–21 CrossRef CAS PubMed.
Footnote |
| † Electronic supplementary information (ESI) available: More detailed experimental procedures and supporting results are provided. See DOI: 10.1039/c6lc00279j |
| This journal is © The Royal Society of Chemistry 2016 |