
 Open Access Article
 This Open Access Article is licensed under a Creative Commons Attribution-Non Commercial 3.0 Unported Licence
Polydimethylsiloxane (PDMS) modulates CD38 expression, absorbs retinoic acid and may perturb retinoid signalling
Kathryn
Futrega
*a,
Jianshi
Yu
c,
Jace W.
Jones
c,
Maureen A.
Kane
c,
William B.
Lott
a,
Kerry
Atkinson
a and
Michael R.
Doran
*ab
aStem Cell Therapies Laboratory, Queensland University of Technology at the Translational Research Institute, 37 Kent Street Brisbane, QLD 4102, Australia. E-mail: k.futrega@qut.edu.au; michael.doran@qut.edu.au
bMater Medical Research – University of Queensland, Translational Research Institute, 37 Kent Street Brisbane, QLD 4102, Australia
cDepartment of Pharmaceutical Sciences, University of Maryland School of Pharmacy, Baltimore, MD 21201, USA
First published on 15th March 2016
Abstract
Polydimethylsiloxane (PDMS) is the most commonly used material in the manufacture of customized cell culture devices. While there is concern that uncured PDMS oligomers may leach into culture medium and/or hydrophobic molecules may be absorbed into PDMS structures, there is no consensus on how or if PDMS influences cell behaviour. We observed that human umbilical cord blood (CB)-derived CD34+ cells expanded in standard culture medium on PDMS exhibit reduced CD38 surface expression, relative to cells cultured on tissue culture polystyrene (TCP). All-trans retinoic acid (ATRA) induces CD38 expression, and we reasoned that this hydrophobic molecule might be absorbed by PDMS. Through a series of experiments we demonstrated that ATRA-mediated CD38 expression was attenuated when cultures were maintained on PDMS. Medium pre-incubated on PDMS for extended durations resulted in a time-dependant reduction of ATRA in the medium and increasingly attenuated CD38 expression. This indicated a time-dependent absorption of ATRA into the PDMS. To better understand how PDMS might generally influence cell behaviour, Ingenuity Pathway Analysis (IPA) was used to identify potential upstream regulators. This analysis was performed for differentially expressed genes in primary cells including CD34+ haematopoietic progenitor cells, mesenchymal stromal cells (MSC), and keratinocytes, and cell lines including prostate cancer epithelial cells (LNCaP), breast cancer epithelial cells (MCF-7), and myeloid leukaemia cells (KG1a). IPA predicted that the most likely common upstream regulator of perturbed pathways was ATRA. We demonstrate here that ATRA is absorbed by PDMS in a time-dependent manner and results in the concomitant reduced expression of CD38 on the cell surface of CB-derived CD34+ cells.
Introduction
Polydimethylsiloxane (PDMS) is a silicone-based elastomer that is widely used to fabricate custom-made lab-on-a-chip cell culture devices.1,2 PDMS is an attractive material for cell culture, as its use for device fabrication is relatively inexpensive; it is considered non-cytotoxic, is gas permeable, and optically transparent. Previous reports suggest that cells cultured in the presence of PDMS can behave differently to those cultured in traditional tissue culture polystyrene (TCP).1,3,4 Possible artefacts that might modify cell behaviour include uncured PDMS oligomers leaching into culture medium or absorption of hydrophobic molecules from the media into the PDMS. The small dimensions commonly used in microfluidic bioreactors and related culture systems result in a high PDMS surface area to medium volume ratio,5 which can potentially amplify these artefacts.PDMS has been shown to absorb small hydrophobic molecules including pharmaceuticals such as ciprofloxacin and paclitaxel.6 Nile red, a hydrophobic fluorophore, was shown to strongly absorb into PDMS and could not be washed away from PDMS microchannels using detergent and/or water.4 After incubating media containing 1 nM estrogen in the presence of PDMS, 50% of the estrogen had absorbed after 1 hour and 90% was lost from the medium after 24 hours.7 The absorption of molecules by PDMS was shown to be related to the logarithm of the octanol–water partition coefficient (log P) of the molecule.8 Molecules having a log P < 2.5 were minimally absorbed (<10% in 4.5 hours) into PDMS channels, while molecules with log P > 2.5 were extensively absorbed into PDMS channels (≥75% after 0.5 hours). Fat-soluble media components such as lipid soluble vitamins and lipid-derived hormones have high log P values (≥6) and would be expected to absorb readily into PDMS.9
Herein, we show that when umbilical cord blood (CB)-derived CD34+ cells were cultured in the presence of PDMS, there was a significant increase in the proportion of cells that lost CD38 expression and thus an increase in the number of CD38− cells. CD38 cell surface expression has been routinely used to separate CD34+ progenitor cells into subpopulations that are likely (CD38−) or not likely (CD38+) to contain subpopulations of haematopoietic stem cells (HSC).10 CD38 is a cyclic ADP ribose hydrolase whose expression can be induced by all-trans retinoic acid (ATRA) via a retinoic acid (RA) response element contained within the first intron of the gene.11 As ATRA is both hydrophobic and it up-regulates CD38 expression,9,11 we reasoned that ATRA absorption into PDMS and depletion from culture medium might be causing the observed increased yield of CD38− cells in PDMS cultures.
We performed the following five studies to better characterize the influence of PDMS on cell cultures. (1) We quantified CD38 surface expression on human CB-derived CD34+ cells cultured in the presence of PDMS or TCP; (2) we sorted fresh CB cells into CD34+CD38− and CD34+CD38+ cell populations, and cultured them in ATRA-supplemented medium in the presence of PDMS or TCP; (3) we cultured CD34+ cells in ATRA-supplemented medium that had been pre-incubated for different durations of time in the presence of PDMS or TCP; (4) we measured the relative ATRA concentration in ATRA-supplemented medium that had been pre-incubated for different durations of time in the presence of PDMS or TCP; and (5) we used the Upstream Regulator Analysis tool in Ingenuity Pathway Analysis (IPA) software to predict the likely cause of gene expression changes observed when cells were cultured in standard base medium in the presence of PDMS or TCP. IPA analysis was performed for CD34+ haematopoietic progenitor cells, mesenchymal stromal cells (MSC), normal human epidermal keratinocytes (NHEK), prostate cancer epithelial cells (LNCaP), breast cancer epithelial cells (MCF-7), and myeloid leukaemia cells (KG1a).
Materials and methods
CD34+ cell isolation and culture
CB-derived CD34+ cells were either isolated in our laboratory or purchased from StemCell Technologies (Cat#: 70008). Fresh CB was collected at the Mater Hospital in Brisbane from full-term births after obtaining informed consent from mothers. Ethics approval was granted by the Mater Health Services Human Research Ethics Committee and the Queensland University of Technology Human Ethics Committee (Ethics number: 1100000210). CD34+ cell isolation from CB was performed within 24 hours of collection. To isolate the mononuclear cell fraction, CB was diluted 1![[thin space (1/6-em)]](https://www.rsc.org/images/entities/char_2009.gif) :2 with PBS/2 mM EDTA, layered onto 15 mL of Ficoll-Paque Plus (GE Healthcare) and centrifuged at 420 × g for 30 minutes. Mononuclear cells were collected from the Ficoll-plasma interface and diluted with PBS/2 mM EDTA and centrifuged at 300 × g for 10 minutes. CD34+ cells were isolated using the CD34 MicroBead Kit (Miltenyi) as per manufacturer's instructions. CD34+ cell purity was assessed by flow cytometry after staining cells with conjugated mouse anti-CD34 antibody (Miltenyi) and analysing them on a LSRII flow cytometer (BD). CD34+ cell purity was always >90%.
:2 with PBS/2 mM EDTA, layered onto 15 mL of Ficoll-Paque Plus (GE Healthcare) and centrifuged at 420 × g for 30 minutes. Mononuclear cells were collected from the Ficoll-plasma interface and diluted with PBS/2 mM EDTA and centrifuged at 300 × g for 10 minutes. CD34+ cells were isolated using the CD34 MicroBead Kit (Miltenyi) as per manufacturer's instructions. CD34+ cell purity was assessed by flow cytometry after staining cells with conjugated mouse anti-CD34 antibody (Miltenyi) and analysing them on a LSRII flow cytometer (BD). CD34+ cell purity was always >90%.
CB-derived CD34+ cells were cultured in X-VIVO 15 media (Lonza, Cat#: 04-418Q) supplemented with human recombinant cytokines: 100 ng mL−1 stem cell factor (SCF, Amgen), 100 ng mL−1 thrombopoietin peptide (TPO peptide,12 Auspep Pty), and 50 ng mL−1 FMS-like tyrosine kinase 3 (Flt-3) ligand, (Miltenyi), with or without 10% fetal bovine serum (FBS; Gibco), as specified. CD34+ cells were expanded in 2% O2 and 5% CO2 at 37 °C, or as specified.
Flow cytometry characterization of CD34+ expansion cultures
Expansion of CB-derived CD34+ cells and cell surface marker expression was evaluated for cells grown on TCP or PDMS, after 7 days. Fluorescence conjugated mouse anti-human antibodies including CD34-APC and CD38-PE (both from Miltenyi) were used for cell-surface marker analysis and stained 1:10 in 50 μL of MACS buffer (Miltenyi) at 4 °C for 15 minutes. Unstained and single colour control tubes were prepared to aid in flow cytometry cell gating and to adjust for spectral overlap. Conjugated isotype controls were used to ensure staining specificity. Cells were enumerated using fluorospheres (Beckman Coulter, Cat#: 7547053), which were added to the cell tubes before analysis. Flow cytometry was performed on a LSRII. The following formula was used to calculate cell numbers: total cells = [(cells counted)/(fluorospheres counted)] × fluorospheres/μL × μL of cell suspension. Flow cytometry data was analysed using FlowJo software (TreeStar, Oregon, USA).
Retinoic acid (RA) quantification
ATRA was purchased from Sigma-Aldrich (St. Louis, MO) and 4,4-dimethyl-RA (internal standard) was purchased from Toronto Research Chemicals. Optima LC/MS grade water, acetonitrile, and formic acid were purchased from Fisher Scientific (Pittsburgh, PA). RA was extracted from media under yellow lights as previously described using a liquid–liquid extraction.13–15 RA was quantified using fast LC-multistage tandem mass spectrometry (LC-MRM3) using a Shimadzu Prominence UPLC coupled to an AB Sciex 5500 QTRAP with atmospheric pressure chemical ionization operated in positive ion mode.16Study 1: influence of PDMS on CD38 surface expression in CD34+ cell expansion cultures
Here we contrasted the expression of CD38 on CD34+ cells following 7 day expansion on either TCP or PDMS. PDMS culture plates were prepared by casting PDMS (Sylgard 184, Dow Corning) into the bottom of culture wells in well plates. PDMS polymer was prepared by combining the polymer and curing agent at a 10:1 ratio, mixed vigorously and degassed to remove air bubbles. 25 μL of liquid PDMS was added to cover the bottom of wells in a 96 well plate (Corning). The PDMS plates were cured overnight in an 80 °C oven. PDMS-containing plates were sterilized by submerging in 70% ethanol for 1 hour, followed by repeated rinses of wells with PBS as described previously.17
Replicate cultures were maintained in atmospheres of 2%, 10% or 20% O2, all with 5% CO2 and at 37 °C. CD34+ cell cultures were initiated with 2 × 10³ CD34+ cells per 96-well (5 × 10³ cells per mL), harvested at day 7 and analysed by flow cytometry as described above. Cell expansion and CD38 expression were characterized for all oxygen concentrations, and in the presence or absence of PDMS.
Study 2: behaviour of sorted CD38− and CD38+ cells on PDMS
Here we sorted fresh CD34+ cells into CD38− and CD38+ sub-populations (MoFlo Astrios, Beckman Coulter) and evaluated their phenotype following 7 days of expansion on TCP or PDMS. Replicate cultures were supplemented with 1 nM ATRA.PDMS plates were fabricated similarly to above, with the exception of using 48 well plates. PDMS volumes were increased to 100 μl to cover the bottom surfaces of 48-well plates (Nunc) prior to curing. Two different medium conditions were evaluated: (1) control medium, X-VIVO 15, and (2) X-VIVO 15 medium supplemented with 1 nM ATRA. All medium contained cytokines. Cells were harvested at day 7 and counted as well as characterized for CD34 and CD38 surface expression by flow cytometry.
Study 3: effect of ATRA on CD38 cell surface expression and the impact of medium pre-incubation on TCP or PDMS over time
To further understand the temporal process of ATRA absorption in PDMS, we pre-incubated ATRA-supplemented medium on TCP or PDMS, and then used this medium to expand CD34+ cells. X-VIVO 15 medium was supplemented with various concentrations of ATRA including 0 nM (control, 0.1% DMSO) or 0.01, 0.1, 1, 10, 100 nM ATRA, and pre-incubated for a specified number of days, prior to cell expansion. A replicate study was performed where the X-VIVO 15 medium was additionally supplemented with 10% FBS.All medium formulations were pre-incubated in 48-well plates in the absence or presence of PDMS (cured at the bottom of wells). Each well was filled with 600 μL of the specified medium. The wells in the outer-most layer of the 48-well plates were filled with sterile water to minimise evaporation of medium during the incubation period. All media were pre-incubated for 1, 2, 3, or 5 days in a 2% O2 and 5% CO2 incubator at 37 °C, in the dark. All subsequent cell expansion was performed in fresh 48-well TCP plates (Nunc) that did not contain PDMS. 500 μL of the TCP or PDMS pre-incubated medium was transferred to fresh 48-well plates. 50 μL of cell suspension, containing 6 × 10³ CD34+ cells, was added to 500 μL of pre-incubated media along with a concentrated cytokine cocktail. Cells were harvested at day 7 and counted and characterized for CD34 and CD38 surface expression by flow cytometry.
Study 4: measurement of ATRA concentration in medium after pre-incubation on PDMS or TCP
To confirm the reduction of ATRA concentration as a result of PDMS absorption, ATRA was measured in medium pre-incubated on TCP or PDMS using fast LC-MRM3 as described above. Medium was spiked with varying concentrations of ATRA and incubated on TCP or PDMS for the indicated number of days, as described in study 3 above. Pre-incubated medium was collected and frozen prior to analysis. The relative distribution of other RA isomers including 9-cis-RA, 9,13-di-cis-RA, and 9-cis-RA was also determined in both media.Study 5: upstream regulator prediction for TCP versus PDMS cell cultures
To gain further insight into what pathways might be perturbed in PDMS-containing cultures, we performed microarray gene expression and pathway analysis across a range of different cell types. We used CD34+ haematopoietic cells from two different CB donors, bone marrow (BM)-derived mesenchymal stromal cells (MSC) from two donors (MSC donor-1 = 55 year old male at passage 3 and MSC donor-2 = 42 year old female at passage 4), normal human epithelial keratinocyte population (NHEK), prostate cancer epithelial cells (LNCaP), breast cancer epithelial cells (MCF-7), and myeloid leukaemia cells (KG1a).All cell populations were cultured in their respective base medium. Any ATRA present in the culture would have been derived from FBS or human serum albumin supplementation contained within these standard medium formulations. Parallel cultures were maintained for 4 days in the presence or absence of PDMS. CD34+ cells were cultured in X-VIVO 15, supplemented with cytokines as described above, and additionally analysed on day 6 of culture. Four replicate wells were prepared for each time point and for each CB donor. MSC were isolated from BM aspirates as described previously.17 The Mater Health Services Human Research Ethics Committee and the Queensland University of Technology Human Ethics Committee approved aspirate collection (Ethics number: 1541 A). NHEK were purchased from Lonza (Cat# 00192906) and cultured in the KBM-Gold Keratinocyte Basal Medium (Lonza, Cat#: 00192151) supplemented with KGM-Gold BulletKit (Lonza, Cat# 00192060) (used at passage 4). MCF-7, LNCaP and KG1a were obtained from the American Type Culture Collection (ATCC). MSC, LNCaP, and MCF-7 were cultured in low glucose DMEM containing 10% FBS and PenStrep. KG1a were cultured in RPMI medium containing 10% FBS and PenStrep. Three replicate wells were prepared for each MSC donor and cell line. CD34+ cells and MSC were cultured in 2% O2 and 5% CO2 and all other cells were cultured in 20% O2 and 5% CO2, all at 37 °C.
To rule out confounding effects associated with differential cell attachment to PDMS versus TCP, adherent cells were prepared differently than the previous non-adherent CD34+ cell cultures. For this study, all adherent cells were permitted to attach to TCP plates overnight first. All adherent cells were seeded at 50 × 103 cells per well in 6 well plates with 4 ml of media. KG1a cells were seeded at two densities, 5 × 10³ and 50 × 103 cells per well (6 well plates), and prepared like the adherent cultures. On the following day a sterile PDMS disk with a diameter of 2 cm and a thickness of 2 mm was gently placed on top of the culture medium in the PDMS test cultures. The PDMS discs continued to float over the 4 day experiment without sinking. Following the culture period, cells were washed with PBS and total RNA was isolated using the RNeasy Mini kit (Qiagen) with an on-column DNAse (Qiagen) digestion step as per manufacturer's instructions. RNA quality was assessed using a 2100 Bioanalyzer and RNA 6000 Nano Kit (both from Agilent Technologies) as per manufacturer's instruction.
Microarray gene expression analysis was performed by the Australian Genome Research Facility (AGRF, Melbourne, Australia) as follows. The quality and quantity of human total RNA was confirmed on the Agilent Bioanalyzer 2100 by the AGRF. A total of 500 ng of total RNA was then prepared for hybridisation to the Illumina HumanHT-12 Expression BeadChip by preparing a probe cocktail (cRNA at 0.05 μg μl−1) that included GEX-HYB Hybridisation Buffer (supplied with the BeadChip). A total hybridisation volume of 15 μL was prepared for each sample and loaded into a single array on the BeadChip. The chip was then hybridised at 58 °C for 16 hours with rocking. Following hybridisation, the chip was washed as per manufacturer's manual. Chips were then coupled with Cy3 and scanned in the Illumina iScan Reader. The scanner operating software, GenomeStudio version 1.9.0, was used to convert the signal on the array into a TXT file for analysis. The sample probe profile and control probe profile files were read into the statistical programming language R (version 3.1.2)18 and underwent quality control, using the Bioconductor19 packages lumi20 and arrayQualityMetrics.21 All samples passed QC. The data were processed using the Bioconductor package limma,22,23 and underwent normexp background correction using negative controls, quantile normalization and were then log2 transformed. The control probes were removed. All probes not expressed in the samples of interest were removed. A linear model was fitted contrasting the different sets, resulting in all differentially expressed genes under a false discovery rate of 5%. The relative reliability of each array was estimated as described previously.23 Contrasts were carried out to compare the differential gene expression of the various cell types grown in the absence or presence of PDMS.
Significantly differentially expressed genes (P < 0.05; log fold change of greater or less than 0.2) were subsequently uploaded to Ingenuity Pathway Analysis (IPA; Qiagen) and the Upstream Regulator Analysis tool was used to identify upstream regulators that were significantly changed across the different cell types. Predicted upstream regulators with positive z-scores greater than 2 were considered activated and those with negative z-scores less than −2 were considered inhibited. Z-scores were exported from IPA and used to create a heat map using GENE-E software (Broad Institute, MIT Cambridge, United States) for upstream regulator pathways in the absence of PDMS (i.e. regulator pathways that were perturbed in the presence of PDMS have a positive z-score).
Statistical analysis
Data were presented as the mean ± standard deviation (SD) for 4 replicate samples, or as specified. Statistical significance of data between different conditions was evaluated using ANOVA in Graphpad Prism software. A significance level was set at 0.05, with asterisk representing the P value obtained in each comparison (*P < 0.05, **P < 0.01, ***P < 0.001, and ****P < 0.0001). Statistical analysis for microarray gene expression studies were performed by the AGRF and described in the relevant sections.Results and discussion
Results from each of the five studies are described in the relevant sections below.Study 1: influence of PDMS on CD38 surface expression in CD34+ cell expansion cultures
While we had previously observed that there was differential CD38 cell surface expression in CD34+ expansion cultures maintained on TCP or PDMS in 2% O2 atmospheres, we were uncertain if this artefact was associated with hypoxia or PDMS itself. We considered hypoxia as a potential effector due to the pooling of cells observed on PDMS, which we reasoned could result in an altered local hypoxic microenvironment. Replicate cultures were maintained at three different O2 concentrations, 2%, 10% and 20% O2, on either TCP or PDMS. We characterized total cell expansion, the percentage of CD34+ progenitor cells, and the percentage of CD38− cells resulting in each culture (Fig. 1). Total cell expansion was sensitive to O2 concentration, with the greatest expansion observed in a 2% O2 atmosphere (Fig. 1A). This is consistent with previous reports showing improved haematopoietic progenitor cell expansion in hypoxic atmospheres.24,25 There was a modest inverse correlation between total fold expansion and the percentage of CD34+ cells within the expanded populations (Fig. 1A & B). This is consistent with the general loss of hematopoietic progenitor cells, marked by CD34+, during CB expansion.26 A profound difference was observed in the percentage of CD38− cells derived from cultures maintained on TCP versus PDMS (Fig. 1C). In all cases, when CD34+ cells were expanded on PDMS, more than 80% of the cells were CD38 negative. In contrast, when CD34+ cells were expanded on TCP only, approximately 55% of the cells were CD38−. These data indicated that PDMS, not oxygen, caused the observed reduction in CD38 expression, and the increased yield of CD38− cells. | ||
| Fig. 1 CD34+ cell expansion on TCP versus PDMS. (A) Total cell expansion, (B) percentage of expanded cells that were CD34+, and (C) percentage of expanded cells that were CD38−. Bars represent the means ± SD of 6 replicate wells (*P < 0.05, **P < 0.01, ***P < 0.001). | ||
Study 2: behaviour of sorted CD38− and CD38+ cells on PDMS
Our first study used CB cells enriched for CD34+ expression. CD34+ cell populations derived from CB contain subpopulations that are either CD38− or CD38+. Previous studies have reported that long-term engrafting cells are contained within the CD38− fraction of CD34+ cells (∼1–10% of CD34+ cells in CB).27 It was unclear if the greater number of CD38− cells generated from PDMS cultures were being derived from the original CD38− cell population, or if the PDMS was causing a greater number of CD38− cells to be generated from the starting fraction of CD38+ cells. To delineate this mechanism we sorted the CB cells into CD34+CD38− and CD34+CD38+ populations and cultured these cells on either TCP or PDMS. In this experiment we also included media supplemented with ATRA. This control was included because ATRA is known to up-regulate CD38 expression,11 and because it is a hydrophobic molecule that could potentially be absorbed by PDMS.9The percentage yield of CD34+ and CD38− cells, which were generated from the sorted CD34+CD38− and CD34+CD38+ populations, is summarized in Fig. 2. In control cultures, which did not include exogenously added ATRA, virtually all of the sorted CD34+CD38− cells remained CD38− when cultured on either TCP or PDMS. In contrast, sorted CD34+CD38+ cells produced populations which were ∼75% and ∼85% CD38− when cultured on TCP or PDMS, respectively. These data suggested that the presence of PDMS accelerated the derivation of CD38− cells from the originally CD38+ sorted cell population. This pattern of CD38− cell derivation is consistent with previous studies that have shown that serum-free culture of CD34+ cells results in the generation of a largely CD38− cell population.10 As serum-free cultures of CD34+ cell populations generally converge to become CD38−, it is logical to assume that the starting CD34+CD38− cell population (∼1–10% of CD34+ cells in CB27) remains CD38−, and the starting CD34+CD38+ (∼90–99% of CD34+ cells in CB) is the population that undergoes phenotype change and becomes CD38−. In standard culture medium (without added ATRA), CD38 loss occurred more rapidly on PDMS, yielding a greater number of CD38− cells.
 | ||
| Fig. 2 Expansion of CD34+CD38− cells (A) and CD34+CD38+ cells (B) on TCP or PDMS. Expansion cultures were performed in 2 different culture media, as specified on the x-axis. Control medium contained X-VIVO 15 medium plus cytokines. +ATRA medium contained X-VIVO 15 medium plus cytokines and supplemented with 1 nM ATRA. Bars represent the means ± SD of 4 replicate wells (*P < 0.05, **P < 0.01, ***P < 0.001). | ||
The addition of 1 nM ATRA to TCP cultures of CD34+CD38− cells or CD34+CD38+ cells drove a significant increase in CD38 surface expression, with virtually no cells remaining that were CD38− at the end of the culture period (Fig. 2, black bars in boxed area), compared to controls (no exogenous ATRA added). In contrast, when 1 nM ATRA supplemented cultures were maintained on PDMS this effect was attenuated, and a significant CD38− population was present at the end of the culture period, relative to TCP (Fig. 2, grey bars versus black bars in boxed area). These data suggest that PDMS modulated the ATRA effect on CD38 surface expression in these cultures. As previously mentioned, ATRA is a hydrophobic molecule that could absorb into PDMS,9 and ATRA depletion would be expected to dampen ATRA-sensitive CD38 expression.11
Study 3: effect of ATRA on CD38 cell surface expression and the impact of medium pre-incubation on TCP or PDMS over time
The data from Fig. 2 suggested that PDMS absorbed ATRA, and that depletion of ATRA from the medium could be modulating CD38 expression in PDMS cultures. We expected that extended durations of pre-incubation of medium on PDMS would further reduce CD38 cell surface expression.To determine if the duration of time that medium was exposed to PDMS influenced subsequent CD38 surface expression in CD34+ expansion cultures, medium was pre-incubated either on TCP or PDMS for 1, 2, 3, or 5 days. Medium preparations were also spiked with varying concentrations of ATRA (0, 0.01, 0.1, 1, 10, or 100 nM), with or without FBS, to determine the degree of hydrophobic molecule absorption that could be expected on PDMS. Pre-incubation of medium on PDMS, particularly medium supplemented with low concentrations of ATRA (up to 1 nM), or FBS, incrementally attenuated CD38 surface expression (Fig. 3 and 4, boxed regions).
 | ||
| Fig. 3 Impact of serum-free medium pre-incubation on TCP or PDMS. (A) CD34+ cells cultured in X-VIVO 15 medium that had been pre-incubated on TCP for the specified number of days, and (B) as in (A), but pre-incubated on PDMS for the specified number of days. Cells were cultured for 7 days on TCP after the pre-incubation period, and characterized for the percentage of cells with phenotype CD38−. Bars represent the mean ± SD of 4 replicate wells (*P < 0.05, **P < 0.01, ***P < 0.001). Each PDMS bar in (B) was greater than the equivalent TCP bar in (A) at P < 0.05. | ||
 | ||
| Fig. 4 Impact of serum supplemented medium pre-incubation on TCP or PDMS. (A) CD34+ cells cultured in X-VIVO 15 medium plus 10% FBS that had been pre-incubated on TCP for the specified number of days, and (B) as in (A), but pre-incubated on PDMS for the specified number of days. Cells were cultured for 7 days on TCP after the pre-incubation period, and characterized for the percentage of cells with phenotype CD38−. Bars represent the mean ± SD of 4 replicate wells (*P < 0.05, **P < 0.01, ***P < 0.001). Each PDMS bar in (B) was greater than the equivalent TCP bar in (A) (P < 0.05). | ||
The boxed region in Fig. 3 highlights the percentage of CD38− cells in cultures where the medium had been supplemented with 0.1 nM ATRA and pre-incubated for either 1, 2, 3 or 5 days on TCP or PDMS. While extended pre-incubation on TCP had minimal effect on the percentage of CD38− cells in cultures (Fig. 3A), the percentage of CD38− cells increased significantly the longer that medium was pre-incubated on PDMS (Fig. 3B – 17% for 1 day pre-incubated, increasing to 30% for 5 days pre-incubated). When ATRA supplementation was increased to 10 nM, even 5 days pre-incubation on PDMS was insufficient to attenuate CD38 surface expression. This suggested that at these higher ATRA concentrations, there was sufficient ATRA, not pre-absorbed by PDMS, to stimulate CD38 expression and completely deplete cultures of CD38− cells. Cumulatively, these results indicated that ATRA was increasingly absorbed by PDMS over time.
The control FBS medium in Fig. 4 contained no exogenously added ATRA. Nevertheless, there was a substantial increase in the percentage of CD38− cells in response to extended pre-incubation of control medium on PDMS (17% for 1 day pre-incubated, increasing to 30% for 5 days pre-incubated). There was no temporal effect of pre-incubation of the FBS supplemented medium on TCP. We interpreted this larger change in CD38− percentage in FBS-containing media as an indication that the FBS-containing media contained a greater initial quantity of hydrophobic molecules that might induce CD38 surface expression than the serum-free media. Previous studies have shown that medium supplementation with FBS caused an increase in CD38 surface expression and depleted cultures of CD38− cells.10 While our data do not indicate what FBS components are being absorbed into the PDMS, FBS is known to contain an assortment of hydrophobic molecules, including retinoic acid isoforms and precursors,28,29 which could be depleted in a manner similar to that of the exogenously added ATRA.
TCP and PDMS pre-incubation of medium supplemented with 0.1 nM ATRA (boxed areas in Fig. 4A and B) gave a similar pattern of results as seen for serum-free medium (Fig. 3). Again, extended pre-incubation of FBS-containing medium on TCP resulted in minimal changes in CD38− cell yield, while extended pre-incubation on PDMS substantially increased the number of CD38− cells. This reinforced the notion that ATRA was being absorbed into the PDMS, and that hydrophobic molecules from the FBS did not appear to be saturating the PDMS or obstructing the absorption process.
Study 4: measurement of ATRA concentration in medium after pre-incubation on PDMS or TCP
We quantified ATRA remaining in cell-free culture media incubated on TCP or PDMS using fast LC-MRM3.16 As shown in Fig. 5, the rate of ATRA depletion was greater in media incubated on PDMS, relative to TCP controls, supporting the notion that ATRA was absorbed by PDMS over time. In media that was initially spiked with 1 nM of ATRA or greater, we observed that on day 1, 2, and 3, ATRA concentrations in PDMS incubated medium averaged 20.4 ± 11.7% less than TCP incubated medium (P < 0.05). After 5 days of media incubation, the percentage of ATRA was approximately 10.6 ± 4.5% lower in the PDMS incubated media than TCP incubated media, but this difference was only statistically significant for the 100 nM ATRA condition (P < 0.05). These results show that in addition to the natural conversion of ATRA into different isomers under cell-free culture conditions over time,30 PDMS contributes to the increased rate of ATRA depletion from the culture medium via absorption.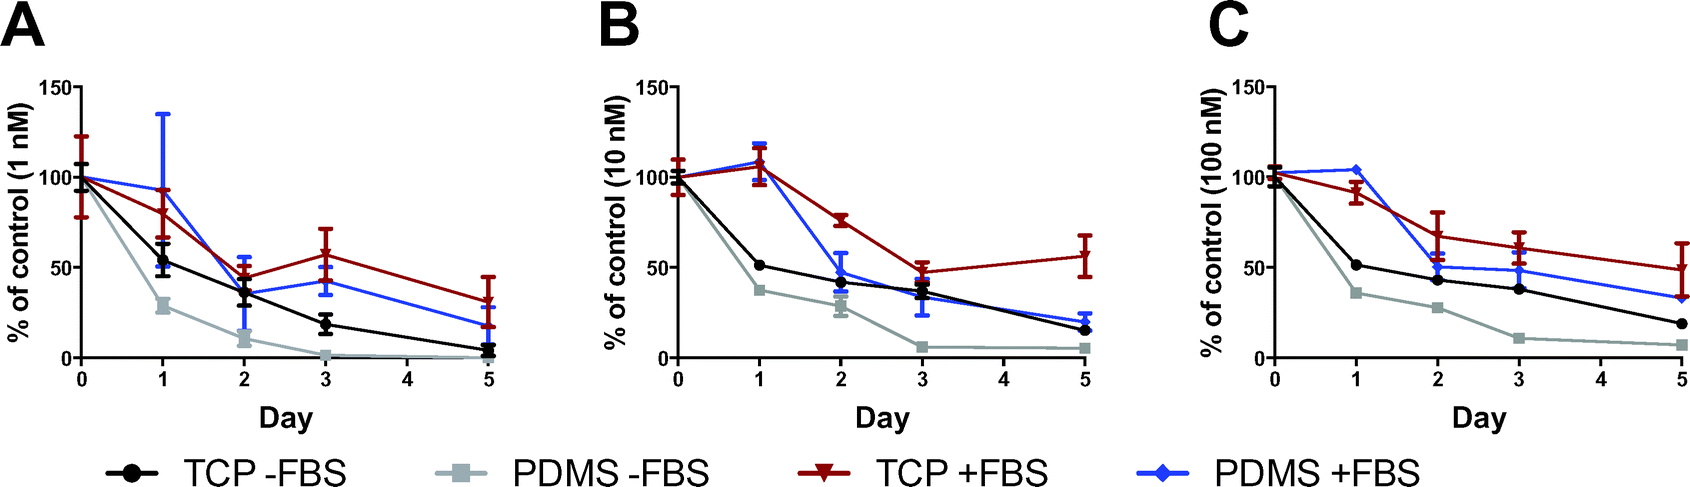 | ||
| Fig. 5 The percentage of ATRA retrieved from media after pre-incubation on TCP or PDMS over time. Graphs are shown for serum-free and 10% FBS-containing media that had been spiked at time zero with (A) 1 nM ATRA, (B) 10 nM ATRA, and (C) 100 nM ATRA. Percentages were normalised to the initial ATRA added (% of control). Differences between TCP and PDMS values were statistically significant (P < 0.05) for day 1, 2, and 3 for serum-free media (−FBS) and on day 5 for 10 nM ATRA supplemented condition. | ||
The addition of FBS to media appeared to reduce the rate of ATRA depletion from the medium into PDMS. While a trend toward lower ATRA concentrations was observed in PDMS incubated media supplemented with FBS, compared to TCP, this difference was not statistically significant. FBS also protected ATRA from isomerization into less biologically active isomers (Fig. 6). Isomerization was extensively observed in media without FBS, with 13-cis-RA being the predominant isomer to accumulate as ATRA concentrations decreased. 13-cis-RA is considered to be an inactive form of RA, and must be converted to RA receptor binding isomers by cellular mechanisms.30
 | ||
| Fig. 6 Retinoic acid (RA) isomer distribution in media after pre-incubation on TCP or PDMS over time. Serum-free and FBS containing media were analysed for the percentage of total RA that was in the form of (A) ATRA, (B) 9-cis-RA, (C) 9,13-di-cis-RA, and (D) 13-cis-RA. The % ATRA of total RA was significantly decreased at all measured time points compared to time zero supplemented media in (A) (P < 0.001). | ||
Using our detection method, media supplemented with 10% FBS contained low levels of ATRA (0.03 ± 0.03 nM), while the levels of ATRA in the commercial serum-free media (X-VIVO 15) were below detectable levels.
PDMS-based absorption model
Based on our data, we conceptually model how PDMS absorbs ATRA and how this modulates CD38 expression (Fig. 7). In this model, trace amounts of ATRA in the culture medium drive an increase in CD38 expression on CD34+ cells. In this model, there is no depletion of ATRA into or on to the TCP culture vessel, and the trace ATRA remains in the culture medium and maintains CD38 expression on cultured CD34+ cells. By contrast, ATRA is absorbed into PDMS and is depleted from the culture medium, resulting in a down regulation of CD38 and an increased number of CD38− cells. Therefore, in addition to the chemical and cellular conversion of ATRA into less biologically active RA isomers, the time-dependent depletion of ATRA from cell culture medium is accelerated by its absorption into PDMS. | ||
| Fig. 7 Model of ATRA absorption into PDMS and influence on CD38 expression. In studies 1–4 we demonstrated that PDMS absorbed ATRA, resulting in a corresponding decrease in CD38 surface expression on culture expanded CD34+ cells. This figure shows schematically how ATRA absorption into PDMS (right panel), but not TCP (left panel), correlates with an increase in the number of CD38− cells. | ||
Data from studies 1–4 suggest that the model proposed in Fig. 7 is plausible. In study 1 we demonstrated that the culture of CD34+ cells on PDMS resulted in an increased percentage of CD38− cells. In study 2 we demonstrated that PDMS increased the percentage of CD38− cells from sorted populations of CD34+CD38+ cells, relative to TCP. Critically, study 2 also demonstrated that the addition of ATRA to culture medium drove an increase in CD38 expression on CB CD34+ cells, but that this was attenuated by maintaining the cultures on PDMS. The first two studies indicated that culture in the direct presence of PDMS affected cell phenotype. However, if the absorption of hydrophobic molecules into PDMS was affecting CD38 expression, then pre-incubation of medium on PDMS surfaces would be sufficient to elicit a similar phenotype change. We tested this premise in study 3 by pre-incubating medium supplemented with different concentrations of ATRA on PDMS or TCP and then cultured CD34+ cells in the pre-incubated medium. At ATRA concentrations of ≤1 nM, pre-incubation of medium on PDMS for extended time periods (1–5 days) resulted in an incremental attenuation of the ATRA-driven CD38 surface expression. In other words, more CD38− cells were derived from cultures where the medium had been pre-incubated for longer periods of time on PDMS. This suggests, as shown in Fig. 7, that ATRA was being absorbed into the PDMS over time and that direct contact with the PDMS was not necessary to elicit the change in CD38 phenotype.
Study 5: upstream regulator prediction for TCP versus PDMS cell cultures
Because PDMS has become the material of choice for lab-on-a-chip devices, we were interested to see if PDMS culture would have a similar effect across a range of different cell types. We used microarray gene expression and pathway analysis to find potential upstream regulators that might be identified by prediction software in IPA. In this analysis, we included the following cell types: CD34+ haematopoietic cells from two different CB donors (cultured for 4 and 6 days), as well as 4 day cultures from two different BM-derived MSC donors, NHEK, LNCaP, MCF-7, and KG1a. Parallel TCP and PDMS cultures were analysed. We evaluated log fold change (logFC) for differentially expressed genes (P < 0.05) in the absence and presence of PDMS. LogFC values (>0.2 and ≤0.2; P < 0.05) for each cell type were uploaded to IPA and the Upstream Regulator Analysis tool was used to identify potential upstream regulator molecules in response to PDMS culture. This analysis tool predicts upstream regulators from gene expression data reported in the literature and compiled in the Ingenuity Knowledge base.31
Fig. 8 shows a heatmap of z-scores from IPA software for predicted upstream regulators based on associated gene networks that were activated (positive z-score) or inhibited (negative z-score) in the absence of PDMS (i.e. when regulator is not ‘absorbed’). IPA ranked tretinoin (ATRA) as the most probable upstream regulator perturbed on PDMS across cell types when all the differentially expressed genes were uploaded (Fig. 8A). However, the z-scores were not always ≥2 (value cut-off for significantly activated). The tretinoin (ATRA)-network associated z-scores were as follows: MSC donor-1, 2.6; MSC donor-2, not significant; MCF-7, 2.9; NHEK, 1.4; LNCaP, 3.3; KG1a at high density, 0.3; KG1a at low density, −0.4; CD34+ expanded cells from CB donor-1 on day 4, 2.3 and on day 6, 4.7; and CD34+ expanded cells from CB donor-2 on day 4, 1.2 and on day 6, 0.7. We also repeated the analysis in IPA, entering only up-regulated genes or down-regulated genes, as it has been suggested that analysing these gene changes separately may affect pathway predicted outcomes.32 Using only up-regulated genes, the tretinoin (ATRA) activation z-scores were ≥2 for all cell types, except for KG1a (Fig. 6B).
 | ||
| Fig. 8 Heatmap of Upstream Regulator Analysis predicted on TCP relative to PDMS. Upstream regulators predicted by IPA based on up- and down-regulated genes (A), or based on up-regulated genes only (B). MSC were derived from two donors (MSC 1 and MSC 2). KG1a were seeded at two densities (KG1a high and KG1a low). CB CD34+ cells were derived from two donors (CB1 and CB2) and analysed at day 4 and 6 of culture (4 replicate wells each). All other cell cultures were analysed at day 4 of culture (3 replicate wells each). Z-scores are shown where at least one cell type had a z-score >2 or ≤2 and appear in the order of z-score rank (highest ranked to lowest ranked, from top to bottom). Activated networks have a positive z-score (red boxes) and inhibited networks have a negative z-score (blue boxes); non-significant networks appear as grey boxes. | ||
All cell populations used in this gene pathway analysis experiment were cultured in standard medium without exogenous ATRA addition. All of the media used in these studies would be expected to contain trace amounts of ATRA. The serum-free media (X-VIVO 15) contained human serum albumin, which would be expected to carry small quantities of retinoids.28,29 The FBS, utilized in most of the medium formulations in this study, is known to contain a range of retinoic acid isoforms and precursors.28,29
Other upstream regulators predicted by IPA that were changed in the presence of PDMS included cholesterol and calcitriol (active form of vitamin D) (Fig. 6B). This is not surprising as both molecules contain relatively hydrophobic regions,33,34 which could bind PDMS and make these molecules less available to cells. Upstream regulators that were not contained in the culture media, but ranked as potential upstream regulators (e.g. transcription factors HIF1A, SREBF1, and SREBF2, and chromatin-binding protein NUPR1), must be indirectly affected by other exogenous molecules.
Conclusion
While PDMS is the most common material used in the fabrication of custom built culture devices, an increasingly recognized artefact of PDMS culture is the propensity of this material to absorb small hydrophobic molecules from the culture medium.4 Such artefacts would be expected to be amplified in microfluidic devices where the surface area to volume ratio is large.5 Herein, we demonstrated that CD38 surface expression on cultured CD34+ cells was attenuated when these cells were cultured in the presence of PDMS.ATRA is known to be a chemically unstable molecule in cell culture media, even in the absence of viable cells. ATRA is subject to photoreactivity and chemical conversion to other forms of RA that may be less biologically active.30 As ATRA is both hydrophobic and up-regulates CD38 surface expression,11 we reasoned that ATRA absorption into PDMS might be the cause of the increased down regulation of CD38 expression in PDMS cultures. Based on this hypothesis, we conceptually modelled this process as shown in Fig. 7. In this model, trace amounts of ATRA in the culture medium drive an increase in CD38 expression on CD34+ cells. In both TCP and PDMS-containing culture vessels, ATRA is subject to chemical conversion to other RA isomers. However, on TCP ATRA is retained in the culture medium to a greater extent and up-regulates CD38 expression on cultured CD34+ cells. By contrast, ATRA is absorbed into PDMS and is depleted from the culture medium, resulting in a more rapid down regulation of CD38 and an increased number of CD38− cells. As a result of absorption, exposure of culture media to PDMS exacerbates the loss of ATRA in culture medium and results in an altered cell phenotype.
Different cell populations would be expected to differ in their sensitivity to retinoid signalling, and thus the impact of PDMS might be expected to be variable depending on the cell type. Even within a single lineage, retinoid signalling can change with cell maturation. For example, primitive bone marrow haematopoietic progenitor cells (CD34+CD38−) have been characterised by muted retinoic acid signalling, despite having functional retinoic acid biosynthesis machinery.35 Retinoid signalling is known to play a role in developmental and biological processes involving embryonic stem cells,36,37 MSC38,39 and HSC.11,35
PDMS-based microdevices and bioreactors offer powerful tools to interrogate biological processes in vitro,40 and thus their use in this area is likely to continue to increase. Our data clearly demonstrate that PDMS can perturb retinoid signalling, and influence gene expression over a range of cell types. Retinoid depletion and conversion is further afflicted by the chemical instability of retinoids, which are sensitive to light and conditions used for cell culture. Microdevices are often exposed to light during real-time microscopic analysis and medium is fed through lengthy tubes and PDMS channels. The depletion of retinoids in microdevices, and other molecules with similar chemical properties, can significantly perturb biological outcomes, as compared to traditional static cultures in TCP dishes. We recommend that PDMS-mediated retinoid signalling perturbation be considered as a possible culture artefact when interpreting biological data from PDMS-based cell culture devices.
Acknowledgements
The authors would like to thank the National Health and Medical Research Council (NHMRC) of Australia and Inner Wheel Australia for their Support. The authors would also like to thank the Australian Genome Research Facility for their assistance with the gene expression analysis.References
- M. Mehling and S. Tay, Microfluidic cell culture, Curr. Opin. Biotechnol., 2014, 25, 95–102 CrossRef CAS PubMed.
- Y. Xia and G. M. Whitesides, Soft Lithography, Annu. Rev. Mater. Sci., 1998, 28, 153–184 CrossRef CAS.
- J. M. Lopacinska, J. Emneus and M. Dufva, Poly(dimethylsiloxane) (PDMS) affects gene expression in PC12 cells differentiating into neuronal-like cells, PLoS One, 2013, 8(1), e53107 CAS.
- M. W. Toepke and D. J. Beebe, PDMS absorption of small molecules and consequences in microfluidic applications, Lab Chip, 2006, 6(12), 1484–1486 RSC.
- A. Bange, H. B. Halsall and W. R. Heineman, Microfluidic immunosensor systems, Biosens. Bioelectron., 2005, 20(12), 2488–2503 CrossRef CAS PubMed.
- G. Theodoridisa, et al., Study of multiple solid-phase microextraction combined off-line with high performance liquid chromatography: Application in the analysis of pharmaceuticals in urine, Anal. Chim. Acta, 2004, 516, 197–204 CrossRef.
- K. J. Regehr, et al., Biological implications of polydimethylsiloxane-based microfluidic cell culture, Lab Chip, 2009, 9(15), 2132–2139 RSC.
- J. D. Wang, et al., Quantitative analysis of molecular absorption into PDMS microfluidic channels, Ann. Biomed. Eng., 2012, 40(9), 1862–1873 CrossRef PubMed.
- S. Halldorsson, et al., Advantages and challenges of microfluidic cell culture in polydimethylsiloxane devices, Biosens. Bioelectron., 2015, 63, 218–231 CrossRef CAS PubMed.
- C. Dorrell, et al., Expansion of human cord blood CD34(+)CD38(−) cells in ex vivo culture during retroviral transduction without a corresponding increase in SCID repopulating cell (SRC) frequency: dissociation of SRC phenotype and function, Blood, 2000, 95(1), 102–110 CAS.
- H. Kishimoto, et al., Molecular mechanism of human CD38 gene expression by retinoic acid. Identification of retinoic acid response element in the first intron, J. Biol. Chem., 1998, 273(25), 15429–15434 CrossRef CAS PubMed.
- S. E. Cwirla, et al., Peptide agonist of the thrombopoietin receptor as potent as the natural cytokine, Science, 1997, 276(5319), 1696–1699 CrossRef CAS PubMed.
- M. A. Kane and J. L. Napoli, Quantification of endogenous retinoids, Methods Mol. Biol., 2010, 652, 1–54 CAS.
- M. A. Kane, et al., Quantitative profiling of endogenous retinoic acid in vivo and in vitro by tandem mass spectrometry, Anal. Chem., 2008, 80(5), 1702–1708 CrossRef CAS PubMed.
- M. A. Kane, et al., Quantification of endogenous retinoic acid in limited biological samples by LC/MS/MS, Biochem. J., 2005, 388(Pt 1), 363–369 CrossRef CAS PubMed.
- J. W. Jones, et al., Use of fast HPLC multiple reaction monitoring cubed for endogenous retinoic acid quantification in complex matrices, Anal. Chem., 2015, 87(6), 3222–3230 CrossRef CAS PubMed.
- K. Futrega, et al., The microwell-mesh: A novel device and protocol for the high throughput manufacturing of cartilage microtissues, Biomaterials, 2015, 62, 1–12 CrossRef CAS PubMed.
- R. C. Team, R: A language and environment for statistical computing, 2014, Available from: http://www.r-project.org/ Search PubMed.
- R. C. Gentleman, et al., Bioconductor: open software development for computational biology and bioinformatics, Genome Biol., 2004, 5(10), R80 CrossRef PubMed.
- P. Du, W. A. Kibbe and S. M. Lin, Lumi: a pipeline for processing Illumina microarray, Bioinformatics, 2008, 24(13), 1547–1548 CrossRef CAS PubMed.
- A. Kauffmann, R. Gentleman and W. Huber, ArrayQualityMetrics–a bioconductor package for quality assessment of microarray data, Bioinformatics, 2009, 25(3), 415–416 CrossRef CAS PubMed.
- W. Shi, A. Oshlack and G. K. Smyth, Optimizing the noise versus bias trade-off for Illumina whole genome expression BeadChips, Nucleic Acids Res., 2010, 38(22), e204 CrossRef PubMed.
- M. E. Ritchie, et al., Empirical array quality weights in the analysis of microarray data, BMC Bioinf., 2006, 7, 261 CrossRef PubMed.
- G. H. Danet, et al., Expansion of human SCID-repopulating cells under hypoxic conditions, J. Clin. Invest., 2003, 112(1), 126–135 CrossRef CAS PubMed.
- Z. Ivanovic, et al., Simultaneous maintenance of human cord blood SCID-repopulating cells and expansion of committed progenitors at low O2 concentration (3%), Stem Cells, 2004, 22(5), 716–724 CrossRef PubMed.
- T. C. Lund, et al., Advances in umbilical cord blood manipulation-from niche to bedside, Nat. Rev. Clin. Oncol., 2015, 12(3), 163–174 CrossRef PubMed.
- M. Bhatia, et al., Purification of primitive human hematopoietic cells capable of repopulating immune-deficient mice, Proc. Natl. Acad. Sci. U. S. A., 1997, 94(10), 5320–5325 CrossRef CAS.
- J. L. Napoli, Quantification of physiological levels of retinoic acid, Methods Enzymol., 1986, 123, 112–124 CAS.
- C. N. N'Soukpoe-Kossi, et al., Retinol and retinoic acid bind human serum albumin: stability and structural features, Int. J. Biol. Macromol., 2007, 40(5), 484–490 CrossRef PubMed.
- C. Lanvers, et al., Chemically induced isomerization and differential uptake modulate retinoic acid disposition in HL-60 cells, FASEB J., 1998, 12(15), 1627–1633 CAS.
- A. Kramer, et al., Causal analysis approaches in Ingenuity Pathway Analysis, Bioinformatics, 2014, 30(4), 523–530 CrossRef PubMed.
- G. Hong, et al., Separate enrichment analysis of pathways for up- and downregulated genes, J. R. Soc., Interface, 2014, 11(92), 20130950 CrossRef PubMed.
- A. Kessel, N. Ben-Tal and S. May, Interactions of cholesterol with lipid bilayers: the preferred configuration and fluctuations, Biophys. J., 2001, 81(2), 643–658 CrossRef CAS PubMed.
- Y. Guo, et al., All-trans retinol, vitamin D and other hydrophobic compounds bind in the axial pore of the five-stranded coiled-coil domain of cartilage oligomeric matrix protein, EMBO J., 1998, 17(18), 5265–5272 CrossRef CAS PubMed.
- G. Ghiaur, et al., Regulation of human hematopoietic stem cell self-renewal by the microenvironment's control of retinoic acid signaling, Proc. Natl. Acad. Sci. U. S. A., 2013, 110(40), 16121–16126 CrossRef CAS PubMed.
- Y. Okada, et al., Retinoic-acid-concentration-dependent acquisition of neural cell identity during in vitro differentiation of mouse embryonic stem cells, Dev. Biol., 2004, 275(1), 124–142 CrossRef CAS PubMed.
- M. Kim, et al., Regulation of mouse embryonic stem cell neural differentiation by retinoic acid, Dev. Biol., 2009, 328(2), 456–471 CrossRef CAS PubMed.
- D. C. Wan, et al., Osteogenic differentiation of mouse adipose-derived adult stromal cells requires retinoic acid and bone morphogenetic protein receptor type IB signaling, Proc. Natl. Acad. Sci. U. S. A., 2006, 103(33), 12335–12340 CrossRef CAS PubMed.
- P. Malladi, et al., Functions of vitamin D, retinoic acid, and dexamethasone in mouse adipose-derived mesenchymal cells, Tissue Eng., 2006, 12(7), 2031–2040 CrossRef CAS PubMed.
- E. W. Esch, A. Bahinski and D. Huh, Organs-on-chips at the frontiers of drug discovery, Nat. Rev. Drug Discovery, 2015, 14(4), 248–260 CrossRef CAS PubMed.
| This journal is © The Royal Society of Chemistry 2016 |