 Open Access Article
Sub-7-second genotyping of single-nucleotide polymorphism by high-resolution melting curve analysis on a thermal digital microfluidic device†
Tianlan
Chen
ab,
Yanwei
Jia
a,
Cheng
Dong
ab,
Jie
Gao
ab,
Pui-In
Mak
*ab and
Rui P.
Martins
abc
aState-Key Laboratory of Analog and Mixed-Signal VLSI, University of Macau, Macao, China. E-mail: pimak@umac.mo
bFaculty of Science and Technology – ECE, University of Macau, Macao, China
con leave from Instituto Superior Técnico, Universidade de Lisboa, Portugal
First published on 5th January 2016
Abstract
We developed a thermal digital microfluidic (T-DMF) device enabling ultrafast DNA melting curve analysis (MCA). Within 7 seconds, the T-DMF device succeeded in differentiating a melting point difference down to 1.6 °C with a variation of 0.3 °C in a tiny droplet sample (1.2 μL), which was 300 times faster and with 20 times less sample spending than the standard MCA (35 minutes, 25 μL) run in a commercial qPCR machine. Such a performance makes it possible for a rapid discrimination of single-nucleotide mutation relevant to prompt clinical decision-making. Also, aided by electronic intelligent control, the T-DMF device facilitates sample handling and pipelining in an automatic serial manner. An optimized oval-shaped thermal electrode is introduced to achieve high thermal uniformity. A device-sealing technique averts sample contamination and permits uninterrupted chemical/biological reactions. Simple fabrication using a single chromium layer fulfills both the thermal and typical transport electrode requirements. Capable of thermally modulating DNA samples with ultrafast MCA, this T-DMF device has the potential for a wide variety of life science analyses, especially for disease diagnosis and prognosis.
Introduction
Facing the fast spreading of infectious diseases, a prompt and accurate diagnosis can make the difference between life and death for patients and everyone around them. To eliminate the days and cost of transporting samples to a specialized laboratory for finding the pathogen or possible DNA mutations, researchers are aiming towards faster yet accurate tools to cope with such diagnostic needs. Polymerase chain reaction (PCR) is one of the most accepted molecular diagnostic methods as it is accurate, informative and inexpensive. Among the existing tools, microfluidic chips are often employed for PCR and other reactions due to their wide biological/chemical compatibility, tiny sample consumption and fast turn-around results.1–9 For disease diagnostics with on-chip PCR, two types of microfluidic chips are utilized: channel-based microfluidics and electrode-based digital microfluidics (DMF).10–12 With the micro-fabrication of chip and downscaling of sample volume, PCR testing time has been prominently shortened from more than an hour in conventional qPCR machines to a few minutes on microfluidic chips.13 Recently, Wittwer's group even demonstrated a 15 second PCR, which almost reached the limit of the reaction rate of the DNA polymerase, further paving the way toward rapid disease diagnosis.14The PCR product can subsequently be examined by probe hybridization, DNA sequencing, capillary electrophoresis or DNA melting curve analysis (MCA) to obtain deeper genetic information.15–32 Among those, the simplicity and specificity of MCA render it the most promising method for single-tube rapid detection of epigenetic differences, point mutations and single-nucleotide polymorphism (SNP).33–41 MCA typically entails temperature ramping from 30 °C to 90 °C to denature the DNA. Dodge et al. analyzed the melting of immobilized oligonucleotides (34 bp) from a molecular beacon probe with a settling period of 5 seconds at each temperature step.42 Targeting the same goal, Piunno et al. performed the melting analysis of immobilized fluorescence-labeled oligonucleotide duplexes (20-bp), where fluorescence was measured continuously with a slow heating rate of roughly 0.005 °C s−1.43 Inserting such a settling step or a slow heating rate in the thermal scanning profile allowed stabilization of the sample temperature and equilibration of DNA probe–target melting, which were essential for sensitive DNA discrimination. However, those steps slowed down the whole melting process albeit the heating rate could be as high as 175 °C s−1.13 For on-chip MCA, the small sample volume and an effective heater can minimize the time of temperature stabilization. In addition, the probe–target hybrid structure can melt as quickly as in 1 ms.44 Such fast melting kinetics would take the full advantage of the fast thermal ramping rate and promise an ultrafast MCA.
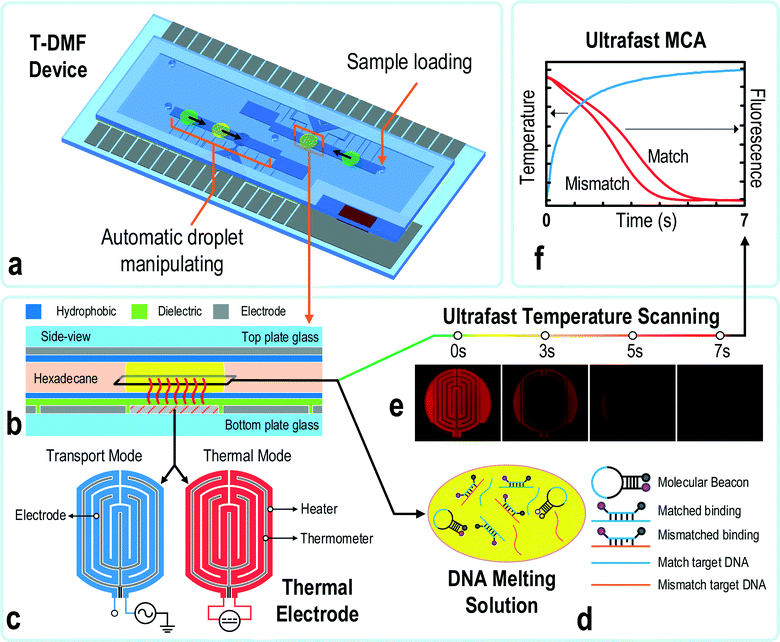
To test the limit of ultrafast MCA, in this paper we report a novel thermal digital microfluidic (T-DMF) device for sub-7-second ultrafast MCA as shown in Fig. 1. Advanced on-chip heater and sensor geometries lead to a better heating efficiency, showing a thermal ramping rate of up to 75 °C s−1 for a μL-scale droplet. The temperature profile was continuously scanned to speed up the tests, leaving out all settling periods. By using a set of molecular beacon probes and synthetic targets as a model system, we successfully ran DNA melting analysis in less than 7 seconds with a low heating power (<0.8 W) and discriminated a single-nucleotide mutation in the target sequence with a melting point difference (ΔTm) down to 1.6 °C from the MCA. This ΔTm sensitivity was as good as the off-chip MCA provided by a commercial qPCR machine. Furthermore, the integration of the T-DMF device with our intelligent droplet control technique allowed automation of the protocol execution and sample pipelining.45
Materials and methods
Device fabrication
The detailed step-by-step device fabrication and assembly can be found in the ESI† (Fig. 1b, S1 and S2). Briefly, the top plate was made of an ITO glass (54 mm × 20 mm) grounded in experiments. The bottom plate (63 mm × 31 mm) with patterned chromium (Cr) electrodes (2 mm × 2 mm) was coated with 25 μm of SU8 photoresist as the dielectric layer. Teflon (100 nm) was coated on both plates to incapacitate sample adhesion by the surfaces. A glass slide frame with a 200 μm thickness was employed as the sealer and spacer. Finally, the device was sealed utilizing UV glue. Holes of 1 mm diameter were drilled on the top ITO glass for sample loading and extracting. Liquid metal (Coollaboratory Liquid Ultra, Coollaboratory) was deposited between the ground pads on the bottom plate and the top plate for grounding the top electrode. An aqueous droplet was introduced via the holes on the top plate and immersed in the oil medium (hexadecane) in the reaction chamber. A piece of oil-absorbing sheet was placed near the hole at a corner of the chip to absorb the overflowed oil when more samples were introduced.Thermal electrode design
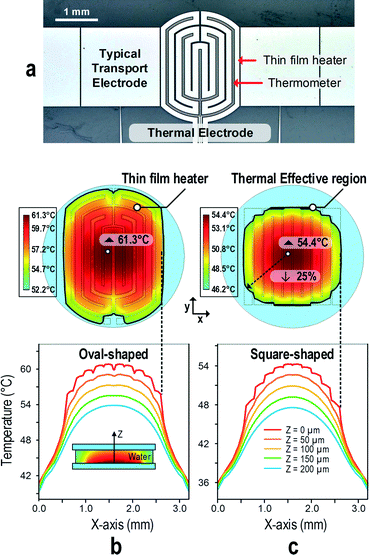
The thermal electrode was flat and oval-shaped, consisting of two separate components: a thin film heater and a temperature sensor parallelizing with each other, as shown in Fig. 2a. The heater was designed and optimized computationally. A 3D finite element model (FEM) (Fig. S3†) of the T-DMF device was built in COMSOL Multiphysics® for simulations, including modules of electric currents, heat transfer in solids, and multi-physics for Joule heating. The simulation parameters were: a bottom silica glass (1.65 mm), a top silica glass (1.15 mm), a thin film chromium heater (130 nm), silicon oil medium (0.2 mm) and a water droplet (2.96 mm in diameter and 200 μm height). Other physical properties of the materials were obtained from the material library of COMSOL. The simulation of Joule heating was set as time dependent in a period of 7 seconds where the initial ambient temperature was set at 25 °C.Measuring system setup for ultrafast MCA
The measuring module for the ultrafast MCA consisted of four parts: a device holder with a T-DMF device, the control electronics, a customized control software and a fluorescence microscope (Fig. S4†). Briefly, the device was inserted into a 3D-printed device holder, which was embedded with a printed circuit board (PCB) for connecting the electrodes of the T-DMF device to the control electronics. A tailored computer software (compiled in Microsoft Visual Studio©) collected the droplet temperature data and position information via the control electronics and carried out the droplet manipulation or thermal-modulation protocols. The holder with a plug-in T-DMF device was put on the stage of a fluorescence microscope (Olympus© X50) during the experiments. An AC (80–100 Vrms 1 kHz, square wave) actuation signal was utilized for droplet manipulation.The control electronics supported droplet management and thermal modulation. The latter was based on a software-intensive proportional–integral–derivative (PID) controller with temperature feedback. The on-chip heater supported two functions depending on its power supply. It was connected to a DC source (10–30 V) when functioning as a heater, and to an AC source (80–100 Vrms 1 kHz, square wave) when working as a normal electrode for droplet manipulation (Fig. 1c and S5†).
Intelligent droplet loading procedure
The T-DMF device had to be reliably sealed to secure a closed chamber, avoiding sample leakage and contamination by unintentional operations. An intelligent closed-loop control system was engaged to monitor the droplet coverage on an electrode by measuring the capacitance between the electrode and the ground in real time.45,46 A user-friendly sample-loading protocol (Fig. S6†) was developed for automatic serial droplet generation and transportation. The sample was injected using a pipette via a hole drilled on the top plate of the DMF device. In the study of fouling effect, the waste electrode was modified to accommodate more than 30 droplets (each 1.2 μL). During the experiment, waste samples were taken away via the hole when the waste electrode was filled. While samples were injected, the first electrode kept sensing for fluidic solution. Once the coverage of the fluidic on the first electrode reached a pre-set threshold value (20% of electrode area), the sample loading procedure was activated. The coverage on the first electrode and the second electrode were tracked in real time. As soon as 95% of the first electrode was covered, the second electrode would be charged. When 95% of the second electrode was covered, the sample solutions started to be extracted through the injection hole by discharging the first electrode while continuing to charge the second electrode. During extraction, the fluid coverage on the first electrode was monitored in real time. Once the coverage went down to 20%, the second electrode would be discharged in 0.5 seconds while the sample was drawing. As a result, a droplet would be generated with high reproducibility and left on the second electrode. This automatic sample loading procedure significantly reduced the sample preparation time to coordinate with the ultrafast MCA.MCA protocols
The molecular beacon probes and target DNAs had the following sequences:Molecular beacon probe:
DNA target-A:
DNA target-B:
DNA target-C:
Molecular beacon probe for KRAS (MB probe-K):
DNA target-K1:
DNA target-K2:
DNA target-K3:
DNA target-K4:
The probes and DNAs were obtained from Integrated DNA Technologies (USA). The binding sites of the probe to the targets are underlined. The nucleotides that form the stem of the probe are bolded. The mismatched nucleotides in target A, B and C are double underlined. The different nucleotides among target A, target B and target C are boxed.
The master mix solution for DNA MCA contained 1× PCR buffer, 3 mM MgCl2, 500 nM MB probe and 500 nM DNA target, or 250 nM of each DNA target when a mixture of DNA was tested. Samples for on-chip MCA and its off-chip counterpart in a BioRad CFX96 qPCR machine were from the same master mix solution.
In the off-chip MCA, 25 μL samples were incubated at 95 °C for 3 minutes and 30 °C for 10 minutes, followed by a thermal ramping from 30 °C to 80 °C with a 0.5 °C step for 30 seconds at each step. Fluorescence capture was executed at the end of each step. In the on-chip ultrafast MCA, the fluorescence was video-recorded every 50 ms with the temperature reading. The starting points of the heating, fluorescence reading and temperature reading were synchronized by the measuring module. The fluorescence was an average over the heater region for the MCA. Another on-chip melting curve mimicking the off-chip one was obtained with a ramping step of 0.5 °C for 5 seconds. The curve of fluorescence as a function of temperature was smoothed and differentiated to obtain the differentiation of fluorescence, −d(F)/d(T), which shows clearly the melting temperature (Tm) of a set of probe–targets.
Results and discussion
Thermal electrode optimization for ultrafast MCA
For a reliable performance and reproducible results, ultrafast MCA demands a high ramping rate to rapidly elevate the temperature and a fast-response sensing unit to obtain the instant temperature with respect to the fluorescence variation. On the T-DMF device, a droplet promptly responds to the controlled temperature due to its small volume on-chip, promising the possibility of ultrafast MCA. So far, the square-shaped on-chip heater has successfully reached a ramping rate of 32 °C s−1.47 Its square shape made it easier to be fitted into the array of transporting electrodes. However, it was a sub-optimized shape as the heating region only covered around 63% of the droplet, supposing the diameter of the droplet was the length of the diagonal of the square electrode. Here we modified the thermal electrode to an oval shape, with a square in the middle and arches at the two ends, as shown in Fig. 2a. The temperature sensor was a thinner line running in parallel with the heater in the thermal electrode. The central square shape fitted well with the array of transport electrodes, while the two arch areas raised the effective heating region of the droplet.To exemplify the efficiency of our oval-shaped electrode, we numerically simulated the heat performance with a constant power input (0.4 W) for a certain period (7 seconds) and compared it with the typical square-shaped design. A droplet of 1.37 μL was sandwiched between the thermal electrode and the top plate. As shown in Fig. 2b and c, with the same amount of power input, the oval-shaped heater exhibited a better heating efficiency, with the highest temperature in the droplet reaching 61.3 °C, while it was only 54.4 °C for its square-shaped counterpart. The better heating efficiency here could be attributed to the larger heating region with the oval-shaped design. For both cases, a similar temperature gradient for both designs was observed along the radius of the heater, as the heater was at the bottom of the droplet and the heat dissipation was along the z-axis. The temperature difference between the top and the bottom plates was around 7 °C. It indicated that the reading around the center of the heater, instead of the center, would be closer to the average temperature of the droplet.
As the heat diffuses faster from the outer ring of the heater, the temperature gradient would be large without optimizing the heat distribution over the heater. In our case, the widths of the inner rings to the outer rings of the oval-shaped heater were arranged in a calculated ratio (based on the power density at each position): 151.3 μm, 148.2 μm, 145 μm and 117.6 μm. This uniformized the heat distribution over the heater, as shown in Fig. 2b and c. A 25% range of the highest temperature was defined as the effective temperature modulation region. As can be seen, 98% of the oval-shaped electrode fell into this effective region, while it was only 86% for its square-shaped counterpart. Finally, considering that the square-shaped heater covered less area of the droplet, the effective temperature modulation region for the droplet area was smaller by another 36%.
Our temperature sensor was implanted into the thermal electrode which barely interfered with the droplet transportation. The fork-shaped temperature sensor realizes a superior thermal sensitivity, and the sensing temperature would be equivalent to the average temperature of the total instead of a narrow region of the electrode. Also, as the sensor located right below the sample minimized the thermal capacity between the sensor and the sample, the accuracy and sensing efficiency of the thermal electrode were maintained even for a dramatic temperature change. Note that implementing a separate sensing electrode was the key point of the thermal electrode for ultrafast MCA. During the ultrafast melting, high temperature sampling rate and precise sensing were supercritical for the analysis. If the same electrode was used as both the heater and the sensor, there would be a time lag when switching between the heating and the sensing mode, which would reduce the precision of the temperature sensing and the sampling rate.
Ultrafast melting curve analysis (MCA)
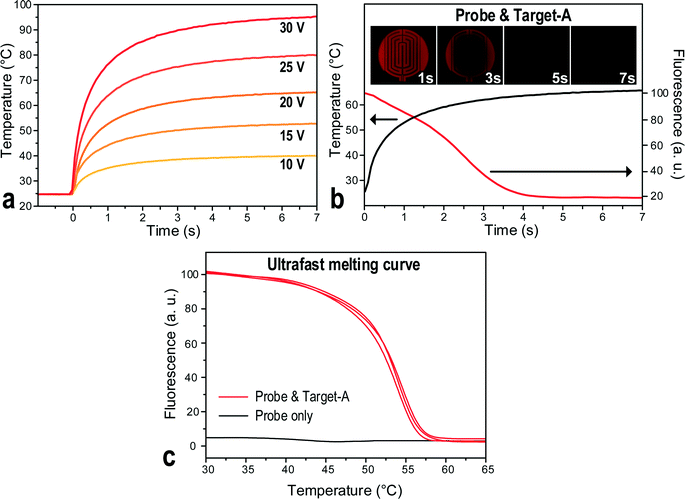
The conventional DNA MCA entails stabilization of temperature at each fluorescence signal reading step, slowing down the melting process even though the temperature ramping rate could be very high for a small volume of droplets on-chip. Insufficient stabilization in each melting step would broaden the melting peak48 and shift it to a higher temperature,49 decreasing the resolution of the MCA. Yet, for MCA using the molecular beacon DNA probes, its fast melting kinetics and low thermal mass may turn the time-consuming temperature equilibrium step redundant.44,50 Furthermore, when analysing the DNA melting curve, the scanning around the Tm of the probe–target hybrid is more essential for determining the target sequence or possible mutations. Hence, a high ramping rate far below the Tm of the probe, and a slow ramping rate near the Tm, would be beneficial to save the melting time while upholding the resolution of the MCA.Here, a novel ultrafast DNA MCA on the T-DMF device is proposed and exemplified with a molecular beacon probe and targets with single nucleotide variations. As shown in Fig. 3a, the response temperature in a 1.2 μL water droplet sitting on the thermal electrode connecting to a DC power supply increased sharply and then slowed down to reach an equilibrium plateau. Higher voltage gave a faster ramping rate at the beginning and a higher equilibrium temperature. The plateaued temperature was attributed to the balance between the heat input and the heat dissipation to the environment. As illustrated the temperature could be raised 75 °C in the first second with a 30 V power input and could climb up to 95 °C within 7 seconds. At this heating rate, the total analysis time of an MCA could be shortened to less than 7 seconds. The resolution of the melting curve would only depend on the sampling rate given by the exposure time of the camera. To minimize the intensity variation, the analysis region of the melting was selected near the center of the thermal electrode. The same region was used for all the samples and tests in this paper to ensure reproducibility.
To validate the ultrafast DNA melting idea, a 1.2 μL droplet containing a molecular beacon probe and a synthetic target DNA (target-A) were incubated in the T-DMF device. A DC power of 20 V was supplied to heat up the droplet so that the ramping rate slowed down at around 50 °C. As shown in Fig. 3b, a sharp decrease in the fluorescence intensity was observed around the 3rd second of heating, indicating that the probe successfully melted off its target. By precisely synchronizing the start-points of the fluorescence recording and the rapid heating and temperature sensing with the measuring module, the fluorescence as a function of temperature was obtained, as shown in Fig. 3c. The sharp decrement in fluorescence corresponded to the Tm of the probe–target hybrid. No obvious fluorescence change was observed in the sample without target present. Video S1 (ESI†) shows the testing recording of the ultrafast MCA on the T-DMF device.
Single nucleotide discrimination
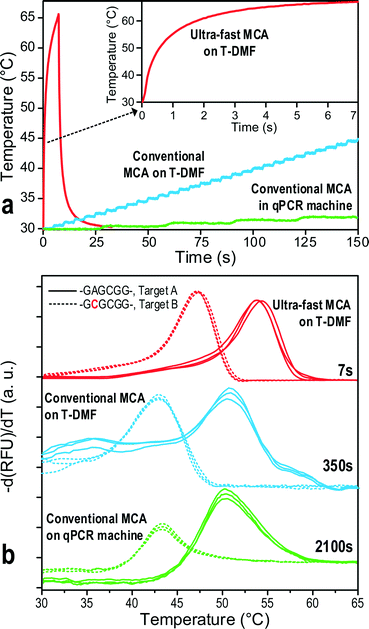
The ultrafast temperature scanning may penalize the resolution of the MCA. In order to test the resolution of our proposed ultrafast MCA on the T-DMF device, we compared the melting curve of the probe with two targets, target-A and target-B, which had a single-nucleotide mutation in the probe binding sequence. The results were compared with both off-chip and on-chip counterparts where the conventional step melting profile was performed.The three melting profiles are shown in Fig. 4a. The ultrafast MCA required 7 seconds of total analysis time, whereas the conventional on-chip MCA and off-chip MCA demanded 350 seconds and 2100 seconds, respectively. Fig. 4b shows the negative differentiation of the fluorescence under different conditions. For the conventional melting procedures (on-chip and off-chip), there is no change in the peak profile or peak position. The constant peak values of the probe to both target-A and target-B indicated that the thermal modulation of the thermal electrode was accurate. For the ultrafast melting process on-chip, the melting peaks of both DNA targets shifted to higher values as expected, while clearly distinguishable.
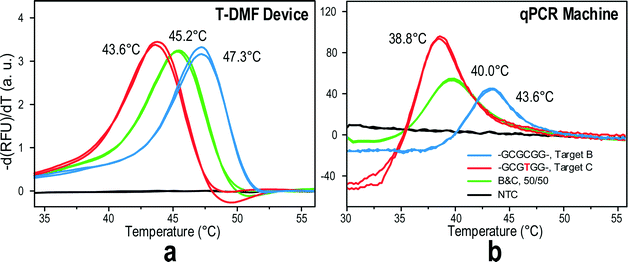
To further test the resolution of the ultrafast MCA on the T-DMF device, we ran a melting curve of the mixture of two target DNAs with single nucleotide differences, target-B and target-C. As shown in Fig. 5a, when a mixture of DNA targets was presented in the melting solution, the Tm of the mixture fell in the middle of the two Tm peaks from the pure target-B or target-C. Such a result was similar to that of the conventional MCA provided by a qPCR machine (Fig. 5b). Even better, the peaks on-chip were sharper and cleaner than those obtained off-chip. This might happen because of the ultrafast ramping rate at the beginning of the melting on-chip, eliminating the spontaneous fluorescence drop with increasing temperature as observed with off-chip probe–target melting.
Single-nucleotide mutation determination
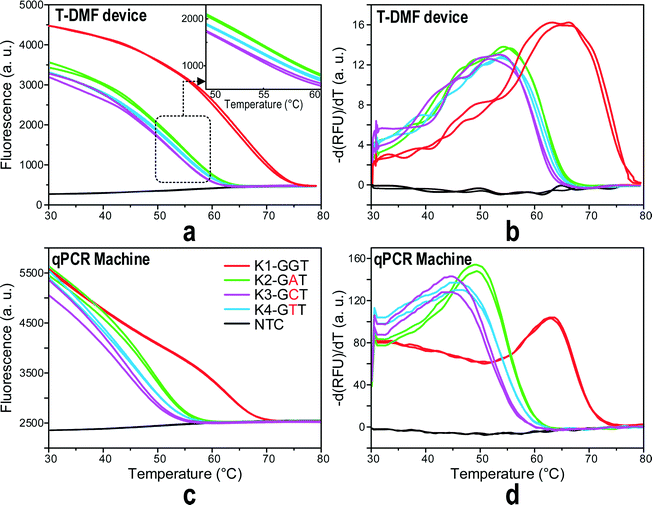
In drug resistance investigation, the type of mutant base is also crucial for the physician's decision on what drug to prescribe. In this section, we further tested the capability of the ultra-fast MCA on the T-DMF device to discriminate different mutant types. A molecular beacon probe was designed for the human KRAS gene detecting single mutations in codon 12. This test is closely related to the drug resistance in targeted cancer medicines like panitumumab or cetuximab for colorectal cancers and lung cancers. The designed probe was perfectly matched to the wild type KRAS gene (GGT) and synthetic wild targets, and single nucleotide mismatched to three mutant type targets with variants of codon 12, GGT→GAT, GGT→GCT, and GGT→GTT mutations, respectively. All the three mutant type targets had a single mismatch to the probe but the mismatched pairs were different from each other.Fig. 6 depicts the probe–target melting curves and the differentiations of fluorescence, −dF/dT, for the wild type target and the three mutant type targets. All the three mutant type targets gave lower melting temperatures. Furthermore, with the same amount of mismatch in the probe, different types of mutation gave different melting curves. When compared with the off-chip counterpart MCA, it can be deducted that the ultrafast on-chip melting actually exhibits better performance in its reproducibility and mismatch discrimination. We concluded that the on-chip was as good as the off-chip melting if not better.
All the above results have validated that the sub-7-second ultrafast MCA provided by the T-DMF device can uphold a resolution capable of single nucleotide discrimination. Furthermore, with this device, the analysis time was 300 times shorter than that of the conventional MCA in a qPCR machine, being reduced from 35 minutes to 7 seconds, and the sample volume decreased 12 times, from 25 μL to 1.2 μL.
Automated ultrafast MCA pipeline
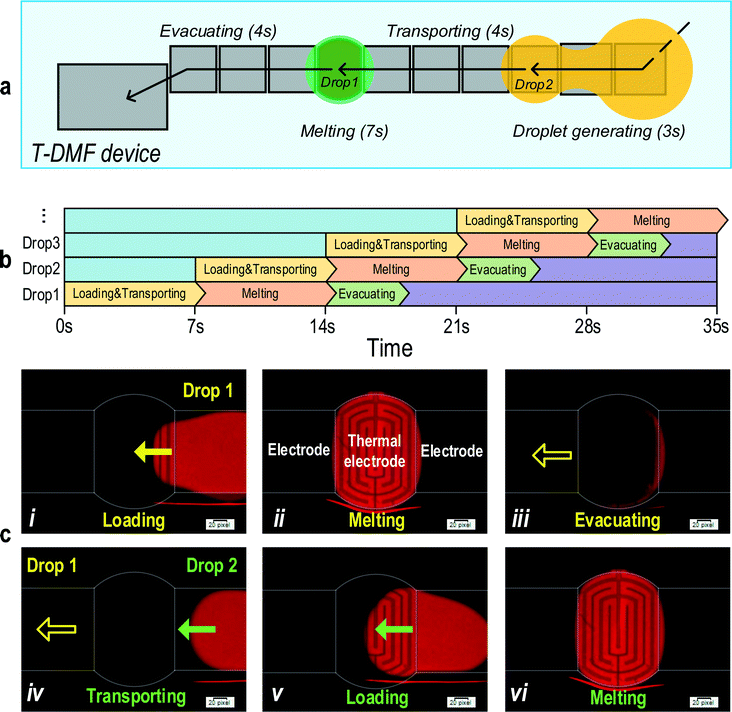
The integration of DMF into the ultrafast MCA has allowed a total automation of the whole MCA pipeline with an intelligent electronic control. A software program was tailored to co-ordinately charge the transport and thermal electrodes for sample loading, transporting, heating and evacuating in an automatic and continuous way. Using DNA probe–targets, target-B and target-C, automatic pipeline operation of ultrafast MCA was achieved.The protocol schematic of pipeline operation is shown in Fig. 7a. Fig. 7b shows the charging program and MCA reading on different electrodes co-ordinately for multiple droplets analysis and Fig. 7c shows the fluorescence images along the pipeline steps. Firstly, the first sample droplet for MCA was loaded and guided automatically to the thermal electrode and accomplished the ultrafast MCA. The loading, transporting and melting took 3 seconds, 4 seconds and 7 seconds, respectively. Then, the droplet was transported to the waste electrode after MCA. While the first droplet was melting, the second droplet started being loaded into the device and was transported to the thermal electrode once the previous droplet finished the melting and was evacuated to the waste electrode. The pipeline continued for the third and further droplets. The pipeline operation of the first and second sample is shown in Video S2 (ESI†). During the MCA, a small drift of droplet position can be tolerable as the analysis area was small and in the middle of the thermal electrode. Also, due to the low thermal mass of the 200 μm-high sample droplet, the heat distribution remained constant over the thermal electrode. Raising the voltage may hold the droplet still on the thermal electrode, but it also raised the possibility of dielectric layer breakdown. A more robust dielectric layer may be investigated for less droplet drifting. For the entire operation, the sample droplet was created with an automated sample loading procedure, which generates a highly uniform droplet volume of 1.19 ± 0.03 μL. Under the pipeline operation, multi-sample transporting and melting can be achieved in parallel, which would dramatically increase the melting efficiency.
As the thermal electrode was reused for the pipelined MCA, contamination might impair the accuracy of the results and there may be a fouling effect stopping the droplets' movement. To study it, three droplets containing probes only (no template control, NTC) were tested before and after 90 sample droplets (target-B and probe) running through the same electrode array including the thermal electrode. As shown in Fig. 8, no obvious melting peak was observed from the curves of the negative derivation of the fluorescence, and the melting curve coalesced with that of the probe-only sample on a fresh thermal electrode, indicating that no residuals were picked up by the following droplet. After more than 90 samples run and melt, the thermal electrode still functioned normally, indicating no obvious fouling effect.
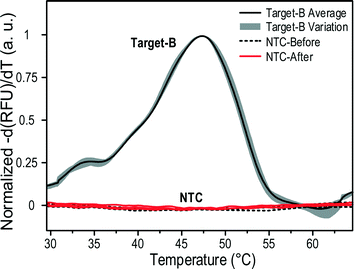 | ||
| Fig. 8 Melting peaks of no template control run before and after 90 sample droplets. The peaks above a threshold were normalized to 1 for a better comparison. | ||
Conclusions
A handheld T-DMF device was developed with the capability of ultrafast thermal modulation and automatic pipelining to handle multiple samples; both are still lacking in existing analysis systems.35,48,49,51 Such a T-DMF device has shortened each run of DNA melting curve analysis (MCA) to less than 7 seconds. The sealed chamber for the reactions eliminates the possibility of sample leakage and contamination by accidental operation interrupting the entire experiment. The temperature control coupled with the data acquisition part of the MCA significantly raises the discrimination resolution to single-nucleotide mutation, with the determination of certain nucleotides. Altogether, this T-DMF device exhibits tremendous potential for ultrafast near-patient diagnostics.Acknowledgements
We appreciate the collaboration of Liang Wan from the University of Macau in the experiments, and Ho Cheung Shum and Matthew Tang from the University of Hong Kong for the technical support on SU8 fabrication and characterization. This work was supported by the Macao Science and Technology Development Fund (FDCT) - 047/2014/A1 and SKL Funds.References
- S. Park, Y. Zhang, S. Lin, T.-H. Wang and S. Yang, Biotechnol. Adv., 2011, 29, 830–839 CrossRef CAS.
- C. M. Chang, W. H. Chang, C. H. Wang, J. H. Wang, J. D. Mai and G. B. Lee, Lab Chip, 2013, 13, 1225–1242 RSC.
- D. R. Almassian, L. M. Cockrell and W. M. Nelson, Chem. Soc. Rev., 2013, 42, 8769–8798 RSC.
- P. Y. Keng, S. Chen, H. Ding, S. Sadeghi, G. J. Shah, A. Dooraghi, M. E. Phelps, N. Satyamurthy, A. F. Chatziioannou and R. M. van Dam, Proc. Natl. Acad. Sci. U. S. A., 2012, 109, 690–695 CrossRef CAS.
- N. A. Mousa, M. J. Jebrail, H. Yang, M. Abdelgawad, P. Metalnikov, J. Chen, A. R. Wheeler and R. F. Casper, Sci. Transl. Med., 2009, 1, 1ra2 Search PubMed.
- M. J. Jebrail, A. Sinha, S. Vellucci, R. F. Renzi, C. Ambriz, C. Gondhalekar, J. S. Schoeniger, K. D. Patel and S. S. Branda, Anal. Chem., 2014, 86, 3856–3862 CrossRef CAS.
- W. C. Nelson, I. Peng, G.-A. Lee, J. A. Loo, R. L. Garrell and C.-J. Kim, Anal. Chem., 2010, 82, 9932–9937 CrossRef CAS.
- A. Rival, D. Jary, C. Delattre, Y. Fouillet, G. Castellan, A. Bellemin-Comte and X. Gidrol, Lab Chip, 2014, 14, 3739–3749 RSC.
- A. H. C. Ng, M. D. Chamberlain, H. Situ, V. Lee and A. R. Wheeler, Nat. Commun., 2015, 6 Search PubMed.
- C. Zhang, D. Xing and Y. Li, Biotechnol. Adv., 2007, 25, 483–514 CrossRef CAS.
- Y. Jia, P.-I. Mak, C. Massey, R. P. Martins and L. J. Wangh, Lab Chip, 2013, 13, 4635–4641 RSC.
- R. B. Fair, Microfluid. Nanofluid., 2007, 3, 245–281 CrossRef CAS.
- P. Neuzil, C. Zhang, J. Pipper, S. Oh and L. Zhuo, Nucleic Acids Res., 2006, 34, e77 CrossRef.
- J. S. Farrar and C. T. Wittwer, Clin. Chem., 2015, 61, 145–153 Search PubMed.
- J. Montgomery, C. T. Wittwer, R. Palais and L. Zhou, Nat. Protoc., 2007, 2, 59–66 CrossRef CAS.
- C. T. Wittwer, G. H. Reed, C. N. Gundry, J. G. Vandersteen and R. J. Pryor, Clin. Chem., 2003, 49, 853–860 CAS.
- C. T. Wittwer, Hum. Mutat., 2009, 30, 857–859 CrossRef CAS.
- J. Worm, A. Aggerholm and P. Guldberg, Clin. Chem., 2001, 47, 1183–1189 CAS.
- P. T. Monis, S. Giglio and C. P. Saint, Anal. Biochem., 2005, 340, 24–34 CrossRef CAS.
- K. M. Ririe, R. P. Rasmussen and C. T. Wittwer, Anal. Biochem., 1997, 245, 154–160 CrossRef CAS.
- T. Kajiyama, Y. Miyahara, L. J. Kricka, P. Wilding, D. J. Graves, S. Surrey and P. Fortina, Genome Res., 2003, 13, 467–475 CrossRef CAS.
- D. Trau, T. M. Lee, A. I. Lao, R. Lenigk, I.-M. Hsing, N. Y. Ip, M. C. Carles and N. J. Sucher, Anal. Chem., 2002, 74, 3168–3173 CrossRef CAS.
- D. Shalon, S. J. Smith and P. O. Brown, Genome Res., 1996, 6, 639–645 CrossRef CAS.
- M. Margulies, M. Egholm, W. E. Altman, S. Attiya, J. S. Bader, L. A. Bemben, J. Berka, M. S. Braverman, Y.-J. Chen and Z. Chen, Nature, 2005, 437, 376–380 CAS.
- E. R. Mardis, Nature, 2011, 470, 198–203 CrossRef CAS.
- T. J. Ley, E. R. Mardis, L. Ding, B. Fulton, M. D. McLellan, K. Chen, D. Dooling, B. H. Dunford-Shore, S. McGrath and M. Hickenbotham, Nature, 2008, 456, 66–72 CrossRef CAS.
- D. A. Wheeler, M. Srinivasan, M. Egholm, Y. Shen, L. Chen, A. McGuire, W. He, Y.-J. Chen, V. Makhijani and G. T. Roth, Nature, 2008, 452, 872–876 CrossRef CAS.
- A. T. Woolley and R. A. Mathies, Proc. Natl. Acad. Sci. U. S. A., 1994, 91, 11348–11352 CrossRef CAS.
- E. T. Lagally, C. A. Emrich and R. A. Mathies, Lab Chip, 2001, 1, 102–107 RSC.
- A. T. Woolley, D. Hadley, P. Landre, A. J. deMello, R. A. Mathies and M. A. Northrup, Anal. Chem., 1996, 68, 4081–4086 CrossRef CAS.
- K. R. Mitchelson, Mol. Biotechnol., 2003, 24, 41–68 CrossRef CAS.
- B. A. J. Giesendorf, J. A. M. Vet, S. Tyagi, E. Mensink, F. J. M. Trijbels and H. J. Blom, Clin. Chem., 1998, 44, 482–486 CAS.
- M. Liew, R. Pryor, R. Palais, C. Meadows, M. Erali, E. Lyon and C. Wittwer, Clin. Chem., 2004, 50, 1156–1164 CAS.
- L. Zhou, L. Wang, R. Palais, R. Pryor and C. T. Wittwer, Clin. Chem., 2005, 51, 1770–1777 CAS.
- A. Ohlander, C. Zilio, T. Hammerle, S. Zelenin, G. Klink, M. Chiari, K. Bock and A. Russom, Lab Chip, 2013, 13, 2075–2082 RSC.
- B. T. Heijmans, E. W. Tobi, A. D. Stein, H. Putter, G. J. Blauw, E. S. Susser, P. E. Slagboom and L. Lumey, Proc. Natl. Acad. Sci. U. S. A., 2008, 105, 17046–17049 CrossRef CAS.
- M. F. Fraga, E. Ballestar, M. F. Paz, S. Ropero, F. Setien, M. L. Ballestar, D. Heine-Suñer, J. C. Cigudosa, M. Urioste and J. Benitez, Proc. Natl. Acad. Sci. U. S. A., 2005, 102, 10604–10609 CrossRef CAS.
- J. Loeffler, L. Hagmeyer, H. Hebart, N. Henke, U. Schumacher and H. Einsele, Clin. Chem., 2000, 46, 631–635 CAS.
- C. Newton, A. Graham, L. Heptinstall, S. Powell, C. Summers, N. Kalsheker, J. Smith and A. Markham, Nucleic Acids Res., 1989, 17, 2503–2516 CrossRef CAS.
- M. G. Herrmann, J. D. Durtschi, L. K. Bromley, C. T. Wittwer and K. V. Voelkerding, Clin. Chem., 2006, 52, 494–503 CAS.
- E. Lyon, Expert Rev. Mol. Diagn., 2001, 1, 92–101 CrossRef CAS.
- A. Dodge, G. Turcatti, I. Lawrence, N. F. de Rooij and E. Verpoorte, Anal. Chem., 2004, 76, 1778–1787 CrossRef CAS.
- P. A. Piunno, J. H. Watterson, C. C. Kotoris and U. J. Krull, Anal. Chim. Acta, 2005, 534, 53–61 CrossRef CAS.
- G. Bonnet, O. Krichevsky and A. Libchaber, Proc. Natl. Acad. Sci. U. S. A., 1998, 95, 8602–8606 CrossRef CAS.
- J. Gao, X. M. Liu, T. L. Chen, P. I. Mak, Y. G. Du, M. I. Vai, B. C. Lin and R. P. Martins, Lab Chip, 2013, 13, 443–451 RSC.
- T. Chen, C. Dong, J. Gao, Y. Jia, P.-I. Mak, M.-I. Vai and R. P. Martins, AIP Adv., 2014, 4, 047129 Search PubMed.
- W. Nelson, I. Peng, J. A. Loo, R. L. Garrell and C. J. Kim, presented in part at the Ieee 22nd International Conference on Micro Electro Mechanical Systems, New York, 2009 Search PubMed.
- C. D. Ahberg, A. Manz and P. Neuzil, Sci. Rep., 2015, 5, 11479 CrossRef CAS.
- A. Russom, S. Haasl, A. J. Brookes, H. Andersson and G. Stemme, Anal. Chem., 2006, 78, 2220–2225 CrossRef CAS.
- Y. Jia, J. A. Sanchez and L. J. Wangh, Sci. Rep., 2014, 4, 5921 CAS.
- Z. Shen, H. O. Sintim and S. Semancik, Anal. Chim. Acta, 2015, 853, 265–270 CrossRef CAS.
Footnote |
| † Electronic supplementary information (ESI) available: Supplementary figures and videos. See DOI: 10.1039/c5lc01533b |
| This journal is © The Royal Society of Chemistry 2016 |

