
 Open Access Article
 This Open Access Article is licensed under a
 Creative Commons Attribution 3.0 Unported Licence
On-chip preparation of nanoscale contrast agents towards high-resolution ultrasound imaging†
Sally A.
Peyman
 a,
James R.
McLaughlan
b,
Radwa H.
Abou-Saleh
ad,
Gemma
Marston
c,
Benjamin R. G.
Johnson
a,
Steven
Freear
b,
P. Louise
Coletta
c,
Alexander F.
Markham
c and
Stephen D.
Evans
*a
a,
James R.
McLaughlan
b,
Radwa H.
Abou-Saleh
ad,
Gemma
Marston
c,
Benjamin R. G.
Johnson
a,
Steven
Freear
b,
P. Louise
Coletta
c,
Alexander F.
Markham
c and
Stephen D.
Evans
*a
aSchool of Physics and Astronomy, University of Leeds, LS2 9JT, UK. E-mail: s.d.evans@leeds.ac.uk
bSchool of Electronic and Electrical Engineering, University of Leeds, LS2 9JT, UK
cLeeds Institute for Molecular Medicine, St James's Hospital, Leeds, LS9 7TF, UK
dDepartment of Physics, Faculty of Science, Mansoura University, Egypt
First published on 15th December 2015
Abstract
Micron-sized lipid-stabilised bubbles of heavy gas have been utilised as contrast agents for diagnostic ultrasound (US) imaging for many years. Typically bubbles between 1 and 8 μm in diameter are produced to enhance imaging in US by scattering sound waves more efficiently than surrounding tissue. A potential area of interest for Contrast Enhanced Ultrasound (CEUS) are bubbles with diameters <1 μm or ‘nanobubbles.’ As bubble diameter decreases, ultrasonic resonant frequency increases, which could lead to an improvement in resolution for high-frequency imaging applications when using nanobubbles. In addition, current US contrast agents are limited by their size to the vasculature in vivo. However, molecular-targeted nanobubbles could penetrate into the extra-vascular space of cancerous tissue providing contrast in regions inaccessible to traditional microbubbles. This paper reports a new microfluidic method for the generation of sub-micron sized lipid stabilised particles containing perfluorocarbon (PFC). The nanoparticles are produced in a unique atomisation-like flow regime at high production rates, in excess of 106 particles per s and at high concentration, typically >1011 particles per mL. The average particle diameter appears to be around 100–200 nm. These particles, suspected of being a mix of liquid and gaseous C4F10 due to Laplace pressure, then phase convert into nanometer sized bubbles on the application of US. In vitro ultrasound characterisation from these nanoparticle populations showed strong backscattering compared to aqueous filled liposomes of a similar size. The nanoparticles were stable upon injection and gave excellent contrast enhancement when used for in vivo imaging, compared to microbubbles with an equivalent shell composition.
Introduction
Microbubbles (MBs) have been widely employed as ultrasound (US) contrast agents in medical imaging.1 They typically contain a heavy gas core, such as a perfluorocarbon (PFC) gas, and a lipid,2 protein, or polymer shell and are between 1 and 8 μm in diameter (Fig. 1).3 Microbubbles provide contrast in US imaging by scattering ultrasound waves more efficiently than the surrounding tissue and recently there has been much interest in developing molecular-targeted microbubbles4 and in using them as devices to enhance therapeutic delivery and uptake.5,6 When the drug to be delivered is physically attached to the MB they are known as theranostic agents.7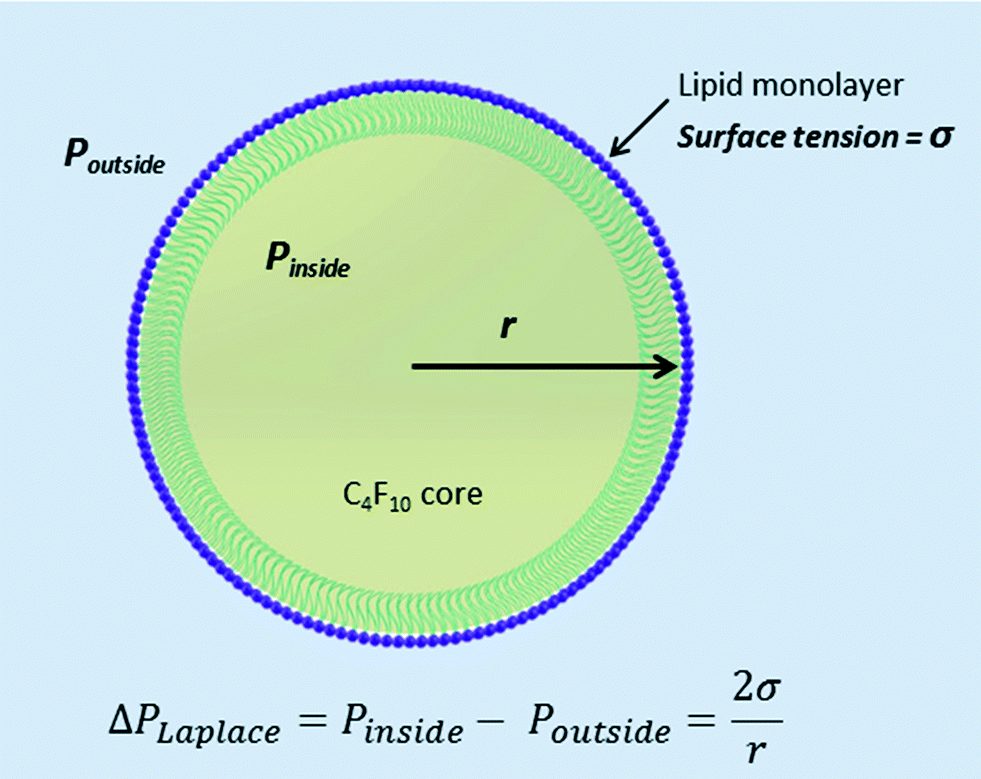 | ||
| Fig. 1 Lipid stabilised nanoparticles in aqueous solution showing lipid monolayer shell. The C4F10 may exist as a liquid core or a gas core depending on the size of the nanoparticle (r) and the surface tension (σ) (not to scale). | ||
An emerging area of interest is that of sub-micron bubbles. Nanobubbles, also defined as ‘ultra-fine bubbles (50 nm–1 μm) have been the subject of much interest recently due to their potential for widespread commercial application in a diverse range of fields; from ‘eco-cleaning’ for removing dirt, salt, etc. from surfaces without the use of surfactants,5 in the microfabrication industry for the floatation separation of semiconductor water treatment through to agriculture and plant irrigation.8–10 The nanobubbles are generally formed via a gas nozzle submerged in water creating a high velocity jet6–8 and are purported to be stable for prolonged periods, from weeks up to several months, even in the absence of surfactant coatings.10,11 As the Laplace pressure is inversely proportional to the diameter of a bubble one would expect that the pressure inside the bubbles would be too great for them to exist for longer than a few microseconds.12 There have been some conflicting theories as to the origin of the stability of such nanometer sized bubbles of gas in water ranging from; a lack of buoyancy, and an associated reduction in coalesce with the liquid–air interface at the top of a vial8 to changes in the structure of the water at the nanobubble–gas interface. Ohgaki et al., used ATR-IR to study the water–air interface and suggested that ‘hard’ hydrogen bonds similar to those found in ice promoted nanobubble longevity by containing the high internal pressures of the nanobubble and limit the diffusivity of gas out of the bubble and into the surrounding solution.11
Several groups have investigated the applicability of nanobubbles for Contrast Enhanced Ultrasound (CEUS). Xing et al. found that 400–600 nm diameter nanobubbles, produced by sonication, provided enhancement in in vivo US imaging.13 Further, nanobubbles produced by mechanical agitation methods have been reported to display superior performance characteristics in vivo when compared to commercially available microbubbles in terms of contrast intensity and longevity.14,15 The use of nanobubbles as drug delivery vehicles has also been investigated.16 Zhang et al. who reported that nanobubbles formed by sonication, could be used as drug carriers for the treatment of residual tumour cells during High Frequency Ultrasound (HIFU) ablation. Nanobubbles loaded with methotrexate were described as a synergistic therapy, delivering the anti-cancer drug during the HIFU therapy to improve overall efficiency of tumour ablation.17 Cavalli et al. demonstrated nanobubbles formed using an homogeniser as carrier agents for US mediated gene delivery.18
Nanobubbles have potential advantages over their micron-sized counterparts due to their ability to perfuse into tumours, through ‘nanopores’ in found in tumour blood vessels. These pores are of the order of 380–780 nm in diameter depending on the type of tumour.14,19 This uptake of nanometer sized material, known as the enhanced permeability and retention or the EPR effect, could also improve drug delivery using nanobubbles by allowing deeper penetration of the delivery vehicle into the tumour. The Lapotko group have investigated another interesting potential application of nanobubbles in the clinic – the plasmonic nanobubble. Nanobubbles are generated by heating gold nanoparticles with a laser pulse. The group demonstrated that nanobubbles of controlled size could be produced by tuning the energy of laser and used for detection of cancerous cells or the selective destruction of the cell with mechanical ablation.20 In a different example the nanoparticle–nanobubble technology was used for drug delivery by encapsulating nanoparticles and drugs inside a liposome. Nanoparticles were then overheated, producing nanobubbles which caused disruption of the liposome membrane and ejection of the drug payload.21
The preparation method of nanobubbles varies depending on the application. Industrial scale nanobubble preparation involves large volumes and high energy requirements, which has been suggested will limit their widespread us.8 In his review, Zimmerman concluded that if energy efficient nanobubbles could be made, there would be widespread uptake of the technology.8 Nanobubble fabrication techniques for medical applications have employed either sonication or mechanical agitation methods coupled with several labour intensive steps to attach drug or gene payloads to the nanobubble, depending on the biochemical complexity of the bubble shell.15–17,22 Repeat handling of bubble samples can cause bubble loss through dilution or destruction and lower final bubble numbers.
Another, alternative method for producing microbubbles is the phase conversion of nano- or micro- meter sized low-boiling point PFC liquid droplets into PFC bubbles. The process, termed acoustic droplet vaporisation, is driven by pressures associated with an ultrasound wave.23 Similarly an increase in temperature can also activate the droplets into bubbles by causing thermal expansion of the low-boiling point liquid. Phase-change contrast agents have shown excellent echogenicity during in vitro24,25 and in vivo studies.26 The nano- and micro- droplets generated for these applications are produced either by extrusion27 or microbubble condensation, in which microbubbles are formed initially before being pressurised and slow-cooled to a liquid.24
A relatively new technology for the production of microbubbles is the use of microfluidics. There has been much work in recent years on the production of monodisperse micron sized bubbles for CEUS applications. Flow focussing microfluidic designs allows for greater control over the size of microbubbles produced and their polydispersity.28–30 For example, Hettiarachchi and Talu et al. produced 1–5 μm microbubbles with a dispersity index of <5%.31,32 A similar approach for making uniformly sized phase-change contrast agents was described in which monodisperse microbubbles where produced on-chip prior to bubble condensing into droplets.33
However, despite the elegant control over microbubble size, the above approaches suffer from low microbubble concentrations, which greatly limit their clinical applicability. We recently demonstrated that by introducing a sudden pressure drop, through expansion in outlet geometry of the chip that microbubbles could be produced in a ‘microspray’ regime, generating microbubbles at concentrations >109 microbubbles per mL, a vast improvement on other microfluidic approaches. The microchip–microspray approach is simple to operate, highly reproducible and cheap to manufacture. The same design was also demonstrated for the rapid, single-step functionalisation of microbubbles with a therapeutic payload for targeted drug delivery.2,34
In this paper, we show that this same microchip and microspray regime leads to the facile production of high concentrations of nano-sized lipid stabilised PFC particles, ~1011–1012 mL−1, which dependent on their composition, size and surface tension exist in either their gaseous or liquid phase. For simplicity the mixed populations of nanobubbles and nanodroplets shall be referred to collectively as PFC ‘nanoparticles.’ Both nanodroplets and nanobubbles are thought to be acoustically active. Nanodroplets can undergo phase change into nanobubbles on application of temperature rise or a negative pressure US field.23 In experiments where nanoparticles are exposed to ultrasound, they will be referred to as ‘nanobubbles.’ To our knowledge this is the first example of microfluidic production of high concentrations of nanoparticle phase change agents. The size and concentration of the nanoparticles produced by the microspray regime was characterised using a combination of complementary measurement techniques based on particle counting using a miniaturised coulter counter, dynamic light scattering (DLS) and particle tracking analysis. The response of the nanoparticles in an US field was also investigated both in a phantom, using a 15 MHz transducer, and in in vivo models, with a 40 MHz transducer. The nanoparticles showed superior contrast intensity in vivo when compared to the microbubbles samples, demonstrating their suitability as efficient contrast agents. Nanoparticles of PFC show the potential to improve spatial resolution for imaging using high frequency transducers (25–80 MHz), as used in pre-clinical imaging or in high frequency clinical US imaging applications.35,36
Experimental
Materials
Microbubbles and PFC nanoparticles were prepared from C4F10 gas purchased from Air Liquide (Birmingham, UK), the surface coatings consisted of a lipid mixture (23.5 μL DPPC at 20 mg mL−1 and 3.5 μL DSPE-PEG2000 at 25 mg mL−1) purchased from Avanti Polar Lipids (Alabaster, Al, USA). All lipids were dissolved in chloroform, dried on the wall of a glass vial under nitrogen for 40 minutes and then re-suspended in phosphate buffered saline (PBS, Sigma-Aldrich, UK). The vial was then vortexed for 1 minute and placed in a heated ultrasonic bath for 1 hour to facilitate the re-suspension of the lipid mix.Microfluidic design and bubble generation
The microfluidic devices were fabricated by Epigem Ltd (Redcar, UK) in PMMA (polymethylmethacrylate) and SU-8. The microfluidic design had been described previously34 but briefly, it consists of a central inlet channel for the gas and two opposing inlet channels for the introduction of the liquid phase. The flow was focussed through a nozzle beyond which there was a single exit channel. The chips were fabricated to a depth of 25 μm, apart from the exit channel which had an additional 25 μm depth, giving an overall depth of 50 μm. The expanding 3D geometry was multiplexed to provide four bubble making geometries per chip to speed production. The chips were mounted in a custom-built holder on the moveable stage of an inverted light microscope (Eclipse Ti-U, Nikon, Japan). The chip holder consisted of a recess into which the microchip fitted closely. A manifold, which contained PTFE tubes (Supelco Analytical, USA) for liquid and gas lines was brought into firm contact with the chip using a lever clamping arm. In the closed position a gas tight seal between the manifold and chip was formed, even under high pressure conditions (>40 psi). Fluid flow to the microchip was delivered via a Mitos P-Pump (Dolomite Ltd, UK) and the gas was regulated by a digital gas flow controller (Alicat Scientific, USA).Microbubbles and nanoparticles were generated by pumping the aqueous lipid solution through opposing inlets and a gas flow through the central inlet (Fig. 2a). Liquid flow rate was 90 μL mL−1 and gas pressure set at 15 psi. A small delay, of a few seconds, was implemented before starting the bubble collection to ensure flow rates and gas pressures had reached their desired rate.
 | ||
| Fig. 2 (a) Microspray bubble formation in a flow focussing microfluidic device featuring a 3D expanding geometry. (b) Histogram of bubble sizes when counted optically. Green shaded area indicates the optical limit (~0.75 μm) where nanoparticles are not resolved and counted. Insert shows a typical optical image of the microbubbles. | ||
Bubble separation and sizing
Microbubbles were separated from nanoparticles over time by a passive method that relies on the intrinsic buoyancy of the bubbles. A spherical bubble in a liquid medium has an ascension velocity, U, which can be calculated from the Hadamard–Rybczynski eqn (1).37 | (1) |
Where R is the radius, g is the gravitational acceleration (9.8 m s−1), μ is the dynamic viscosity of water (8.90 × 10⁻⁴ Pa s), μ′ is the dynamic viscosity of C4F10 (1.2 × 10⁻⁵ Pa s) and Δρ is the difference in density between the medium and the gas core.37 For a bubble with a 2 μm diameter it would take 23 minutes to rise a distance of 1 cm. For a bubble with a diameter of 150 nm it would take 17 hours to travel the same distance. In the case of a nanodroplet with a diameter of 150 nm, and a density of 1594 kg m−3 it would sink by 1.2 μm over the same time (23 min), and can be thought of as neutrally buoyant for these experiments. Based on this the bubble sample was left for ~45 minutes to allow bubbles larger than 1 μm to rise to the top of the vial, leaving behind the nanobubbles and neutrally buoyant nanodroplets. Nanobubbles and droplets do not scatter light as much as microbubbles and do not appear turbid to the eye. After 45 minutes the top layer of microbubbles was removed with a pipette and samples were taken from the lower, clear, portion of the vial. Sizing and counting of the separated samples was performed on a qNano (Izon, UK), via DLS (Zetasizer, Malvern Instruments, UK) and by a NanoSight instrument (Malvern Instruments, UK). For qNano measurements pore sizes of 100 nm up to 4000 nm were used to investigate the nanoparticle/bubble size ranges within the samples. Samples were diluted 1 in 100 prior to measurements. Microbubble samples were counted optically according to the methods published previously.34
Ultrasound characterisation
Acoustic backscatter from bubble populations was measured using a focused 15 MHz single element ultrasound transducer (V313, Olympus KeyMed Ltd, Essex, UK) situated in a tank of degassed and filtered water. The ultrasound transducer was connected to a pulser/receiver (5072PR, Olympus KeyMed Ltd, Essex, UK), which generated a broadband ultrasound pulse that was scattered by the nanobubble/liposome populations. The populations were contained within a 100 mL cylindrical chamber that had acoustic windows to allow for interrogation of ultrasound, and were magnetically stirred to ensure a uniform distribution of particles. The backscattered signals were filtered (1 MHz high pass) and amplified by a 20 dB pre-amplifier built into the pulser/receiver unit. The filtered and amplified signal was digitised at a sampling frequency of 5 GHz using an 8 bit oscilloscope (LeCroy 64Xi, LeCroy Corporation, Chestnut Ridge, NY) and downloaded to a PC. A total of 500 pulses were recorded at a pulse repetition frequency (PRF) of 0.5 kHz for each particle population, which were processed using Matlab (MathWorks Inc., Natick, MA). The received signal spectra were averaged in the frequency domain to reduce the variance of the experimental results due to external noise sources.38 This process was repeated (n = 3) for each population tested.In vivo imaging
Three CD1 nu/nu male mice age 6–8 weeks were imaged at 40 MHz with the VisualSonics Vevo770 High Frequency Ultrasound (HFUS). Mice were initially anaesthetised with 5% v/v isofluorane in medical air, which was then maintained at 3% during the imaging procedures. The aorta of the mouse was identified by an experienced HFUS user, with arterial flow confirmed with Pulsed Waved (PW) Doppler imaging. A 50 μL bolus of ~1 × 10⁹ microbubbles per mL or 1012 nanoparticle per mL sample (maximum gas volume fractions of 4.2 × 10⁻⁹ m3 and 1.8 × 10⁻⁹ m3, respectively) was administered via a tail vein catheter at a rate of 0.6 mL min−1, controlled via a syringe driver. Imaging was carried out under contrast B-mode, to acquire bubble wash-in curves for quantitative analysis with the wash in of bubbles. Data was analysed post acquisition with VisualSonics software to analyse time intensity wash-in curves and determination of Imin, Imax, and flow rate.Both in vitro and in vivo ultrasound systems were characterised using a calibrated 40 μm needle hydrophone (Precision Acoustics, Dorchester, UK). The in vitro system generated a 3-cycle pulse that had a peak positive pressure of 3.90 ± 0.08 MPa, and a peak negative pressure of 2.98 ± 0.04 MPa, which corresponded to a mechanical index (MI) of 0.74.39,40 An A-line generated by the in vivo system consisted of a 2-cycle pulse, that in the focal region, had a free field peak positive pressure of 2.6 ± 0.15 MPa, and a free field peak negative pressure of 2.89 ± 0.02 MPa, which corresponded to an MI of 0.49.
Results and discussion
Nanoparticle generation
Fig. 2a shows the microspray bubble formation regime generated in the 3D expanding geometry chips. The C4F10 gas at a pressure of 15 psi (1.034 × 10⁵ Pa) in the central channel is focused through the nozzle from inlet channels either side by a 0.5 mg mL−1 aqueous solution of lipids, typically at a flow rate of 90 μL min−1. As the gas and lipid solutions are pumped through the nozzle they experienced very high shear forces and velocity gradients. Immediately following the nozzle the 3D-expansion in the outlet caused a pressure drop in the outlet, inducing atomisation-like break-up of the gas cone and releasing bubbles in a fine spray. This atomisation-like behaviour produces a high concentration of microbubbles in the 108–109 bubbles per mL with a size range between 1 and 8 μm, when counted optically (×60 optical magnification). The histograms of microbubble diameter, Fig. 2b, appear asymmetric; with a cut off for lower bubble size ~0.75 μm (the insert shows a brightfield image of the microbubbles). The lowest size on the histogram corresponds to the limit of the optical resolution of the 60× magnification used to count bubbles. In addition, optical images were taken at the upper surface of a flow cell, in which the bubbles have risen due to their intrinsic buoyancy. However, nano-sized particles such as nanodroplets and even nanobubbles, that are much smaller in size, remain homogenous in suspension due to Brownian motion. When the focus of the microscope was adjusted to go through a whole depth of the bubble sample, very tiny particles were observed moving with Brownian motion beneath the microbubble layer on top (see ESI† S1) suggesting there was a population of sub-micron particles produced during this regime that cannot be counted optically.Fig. 2a shows an optical image taken of the microspray production at 90× magnification and the gas cone appears to show micron-sized bubbles breaking off the interface with the lipid solution. However, a finer spray of smaller particles can also be observed as a darker region very near to the nozzle.
Several papers have been published on the fluid mechanics behind high-pressure gas jets in liquid and the break up mechanisms that give rise to bubble production. Chen and Richter describe the process of bubbling and jetting in regimes under high gas pressures and turbulent flow.41 The distinction between the two regimes depends on the linear velocity of the gas flow. Instances when the gas jet is subsonic (less that Mach 1) the gas cone breaks up into bubbles. When the velocity is supersonic (larger than Mach 0.9) then the gas cone moves into the jetting regime and breaks up some distance from the nozzle. In the case of the microspray regime, the linear velocity of the fluid can be easily calculated in the nozzle and equates to 5 m s−1. This would give the liquid alone a value of Mach 0.3. The Reynolds number inside the nozzle was calculated to be ~82, much higher than usually expected in microfluidic devices. However, this does not take into account the velocity of the gas jet, which cannot be measured using the current set-up. It may be that the linear velocity is even higher, pushing the Mach number up to unity.
A high-speed camera (SIMX16, Specialised Imaging, UK) was used to try to observe this phenomenon at a frame rate of ~1 billion fps. However, the microspray break up was still too fast to observe individual bubbles and droplets (ESI† S2). Again, this suggested that the velocities in the channel were extremely high, potentially in the super-sonic range.
Nanoparticle sizing and stability
Suspensions of PFC nanoparticles generated in the microfluidic device as described above were measured using a combination of methods. For bubbles of diameter 1 μm and upwards optical counting (Fig. 2b) and electrical conductance (qNano) methods showed good agreement in estimating both bubble size and concentrations. Concentrations were typically of the order of 108 bubbles per mL. The region of the histogram, in Fig. 2b, defined by the green box corresponds to the range of nanoparticles sizes whose diameter was below the resolution capabilities of the optical microscope. In this regime the particle size/concentration was determined both electrically using the qNano or via particle tracking using the NanoSight. The NanoSight data in Fig. 3 indicates a high concentration of particles ~1010 mL−1 for particles of diameter in the range 100–300 nm (the qNano data indicated particle concentrations up to 1012 particles per mL).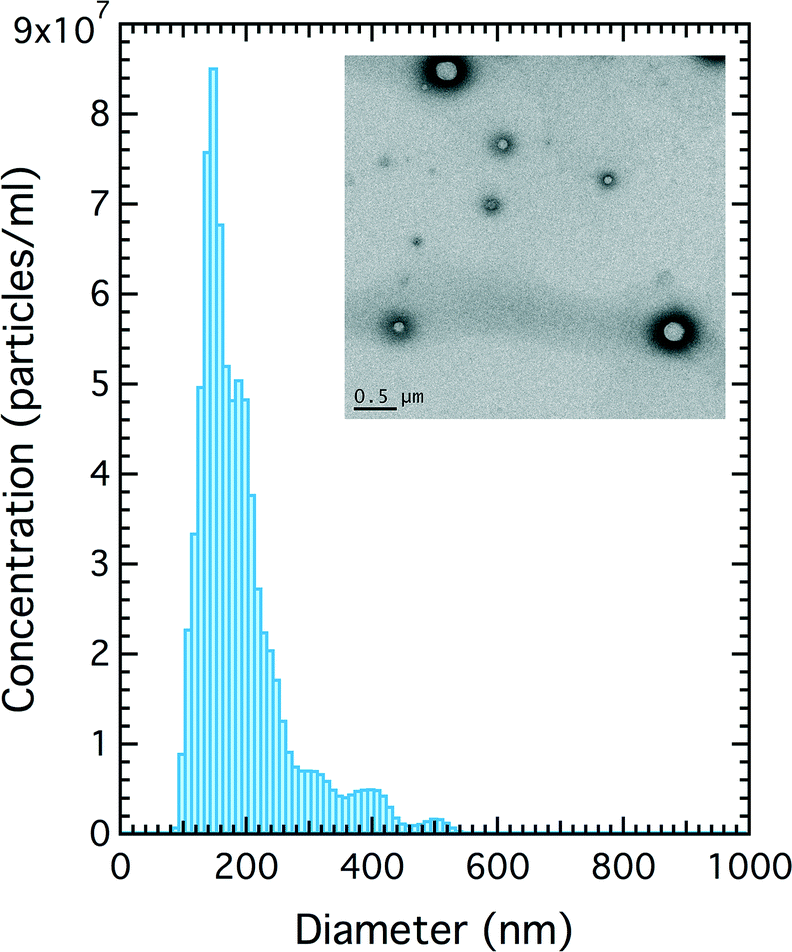 | ||
| Fig. 3 Particle size of nanoparticles of C4F10 as determined by particle tracking. Inset: TEM image of nanoparticles of C4F10. | ||
Fig. 4a shows the phase change behavior measured using the Zetasizer as a function of temperature. Particle size was measured in ~10 °C steps, for temperatures below 45 °C the nanoparticles were in a liquid state and the size profile did not alter as a function of temperature. The solid circles in Fig. 4a is the average distribution profile for all data obtained below 45 °C. On heating above 57 °C the droplets phase-changed in to a gaseous state (solid squares). Fig. 4b shows the dependence of phase-change temperature for C4F10 as a function of droplet diameter for different surface tensions. The phase change temperature observed in our system (i.e. <60 °C) would therefore suggest that the surface tension of our droplets is low and probably between 10 and 15 mN m−1. The difference in size observed between data from the NanoSight (Fig. 3) and initial size measurements on the DLS (Fig. 4a) are likely to be due to changes in the sample over time. The same sample was used for both measurements, but the DLS was run two hours after the NanoSight in which the sample was left standing at room temperature. It is likely that some of the larger gas filled particles picked up by the NanoSight have shrunk and condensed to liquid phase C4F10 before being run on the DLS. In addition, some of the larger bubbles will have risen from the bottom of the tube where the sample was taken from. The sample was not agitated in this time to avoid any microbubbles that had risen to the top being mixed back into the sample.
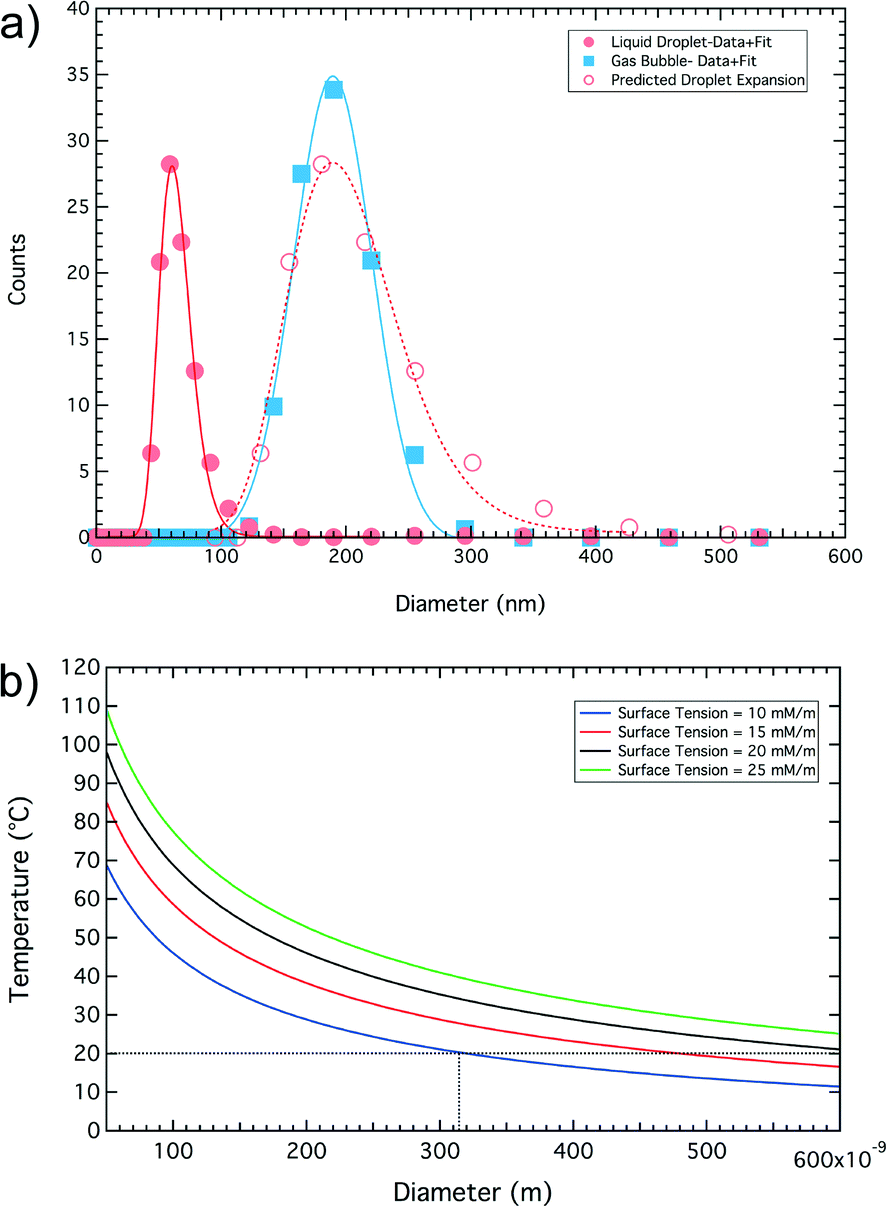 | ||
| Fig. 4 Nanodroplets undergoing thermally induced phase change to gas bubbles. (a) Shows the initial droplet size-distribution (solid red circles), the predicted profile following phase conversion (hollow red circles) and the experimentally determined bubble size post phase conversion (solid blue squares). (b) Shows the calculated phase change temperature, for C4F10, as a function of droplet size for different droplet surface tensions. | ||
Such low surface tensions would lead to droplets larger than 315 nm being in the gaseous phase whilst smaller ones would remain as liquid droplets. Based on an estimated surface tension of 10 mN m−1 we can calculate the predicted distribution of bubble sizes, from the initial droplet size distribution, the hollow squares in Fig. 4a was calculated based on the model developed to estimate the “Expansion Ratio” using the approach of Evans et al.42 The “Expansion Ratio” data are provided in the supplementary material (ESI† S4).
A control lipid solution, of the same lipid concentration as used for bubble formation that had been pumped through the tubing, but not the microfluidic device was analysed on the NanoSight. Vesicles in the lipid solution had a much broader size range and lower concentration as particle than after nanobubble/droplet formation in the fluidic device (ESI† S5).
The time dependent behaviour of the particles in terms of size and concentration were also investigated on the qNano. Samples of subnatant collected after separation were kept in the fridge (4 °C) for a period of 17 days and measured on the qNano at different time intervals. Fig. 5 shows the average particle diameter (red axis) and particle concentration (black axis) over time. The data shows that the particles remained stable over the 17 day period with little change in particle diameter or concentration, remaining at ~260 nm in diameter and 4 × 10¹¹ particles per mL, respectively. The particles were only measured on the 200 nm pore as this covered the greatest range of particle sizes within the range of interest compared to other pores (100–400 nm).
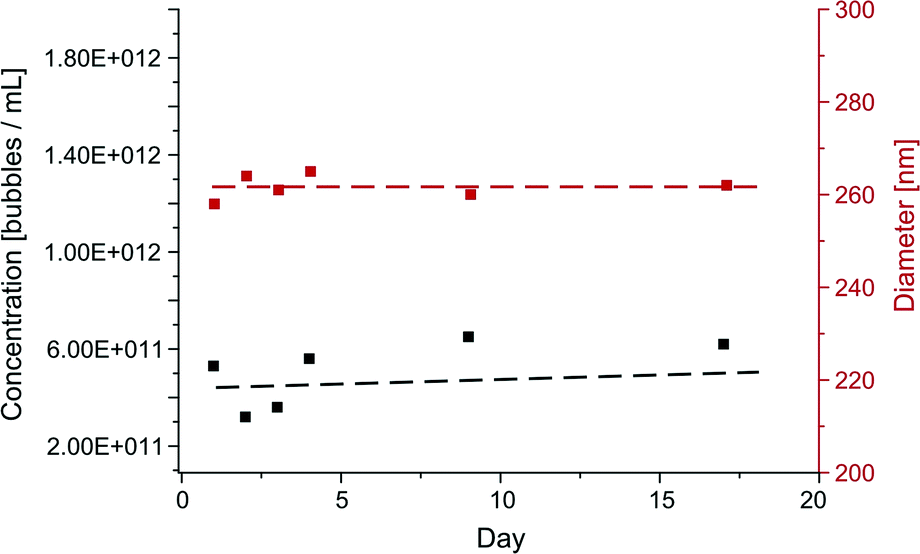 | ||
| Fig. 5 Stability testing of nanoparticles measured on the 200 nm pore on the qNano. Nanoparticles kept in the fridge at 4 °C showed excellent size (red) and concentration (black) stability over a 17 day period. | ||
Ultrasound measurements
Due to the acoustic impedance mismatch between bubbles and the surrounding liquid we would expect to distinguish between sub-micron sized bubbles and particles, such as liposomes, by measuring the US backscatter from the samples. We would also expect any small particles containing a liquid C4F10 core to phase change during exposure to the ultrasound field.23 Suspensions of bubbles and nanoparticles were generated in the microfluidic device as described above. Fig. 6A shows the backscattered US signal from solutions of filtered water containing a concentration of 2 × 10⁶ particles per mL of either liposomes or nanoparticles. The scattering signal was corrected for the response of the 15 MHz ultrasound transducer used for this study. In addition, only data acquired within the measured 6 dB bandwidth of the transducer is displayed. The PFC filled nanoparticles showed between a 15–20 dB increase in backscattered signal over equivalent size and concentration of water filled liposomes.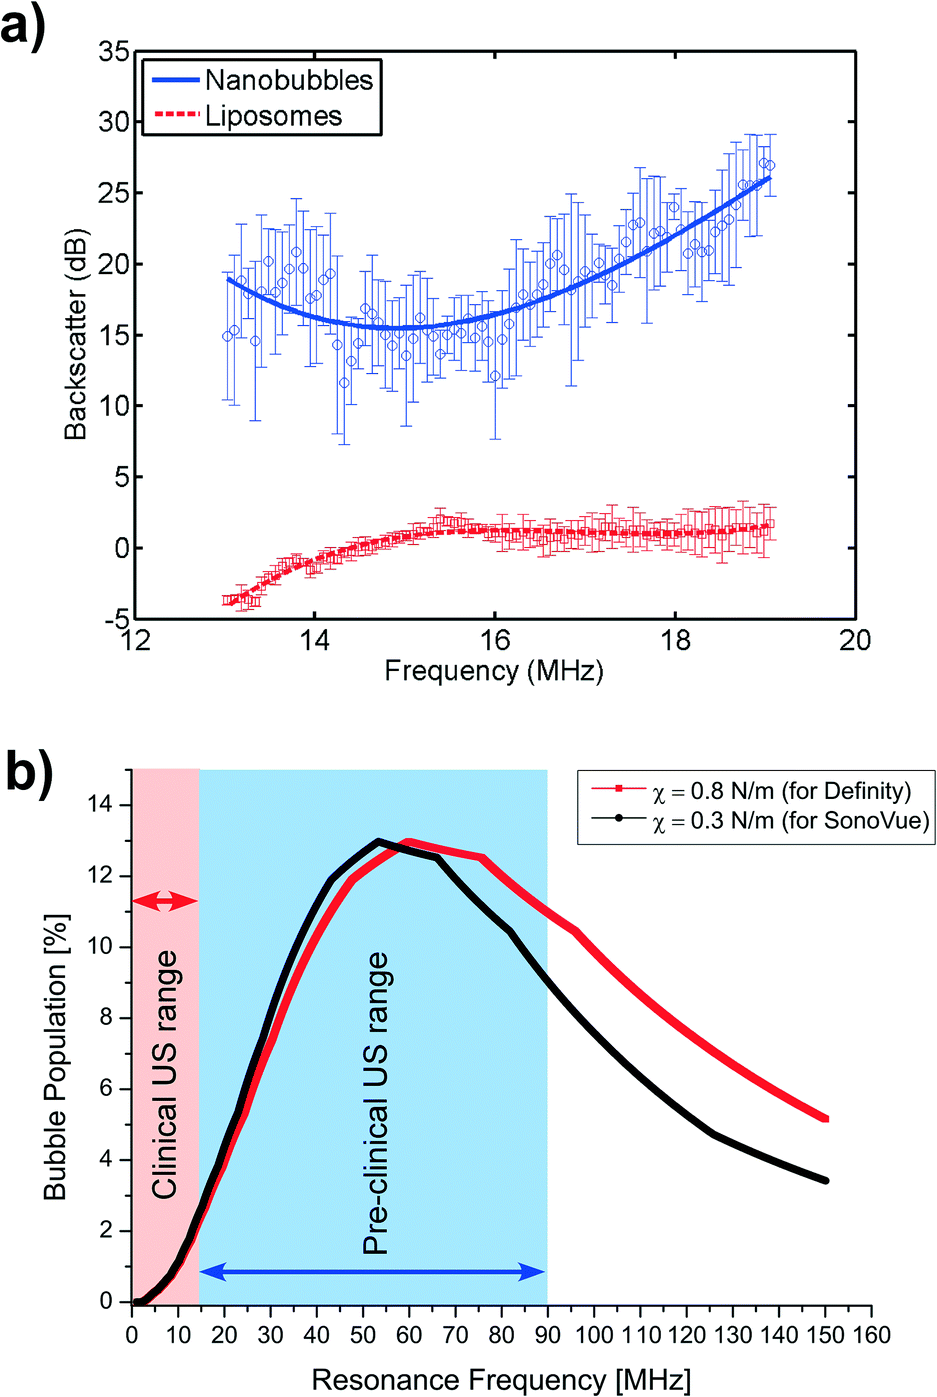 | ||
| Fig. 6 (a) Ultrasound backscatter signal of nanoparticles and liposomes. Over the 6 dB bandwidth of the ultrasound transducer the nanobubbles showed between a 15–20 dB increase in signal over an equivalent size and concentration of liposomes. A 15 MHz transducer was used in conjunction with a pulser/receiver to transmit a broadband ultrasound signal and detect the backscatter. Error bars represent the standard deviation of the measured backscatter for three repeat samples. (b) Distribution of calculated resonance frequencies for a population of nanobubbles – showing a peak resonant frequency of ~55 MHz. The plot shows the US frequency ranges for both clinical and pre-clinical imaging. | ||
Calculation of the ultrasound response as a function of bubble size (after phase change) predicts that as bubble diameter decreases below 1 μm, the resonant frequency of the bubble increases dramatically >15 MHz (ESI† S6). Fig. 6B shows the expected resonant frequency response of the nanobubbles used in these experiments, based on their size distribution. Shell parameters for the commonly used phospholipid ultrasound contrast agents, SonoVue and Definity were used for this calculation. This indicates that the nanobubble populations generated in this study would have a theoretical peak resonant frequency at ~60 MHz, but with a range between 15 to >100 MHz which is supportive of the observations made in the backscatter measurements shown in Fig. 6A, where the backscatter of the nanobubbles increases at higher frequencies. This also suggests that the nanobubbles would give even greater backscatter at frequencies higher than the transducer used in these experiments. Many pre-clinical US imaging systems use high frequency transducers in the range 40 to 80 MHz (ref. 43–46) with recent advances to 100 MHz,47,48 which may be indicative that the nanobubbles will show enhanced contrast and be useful as higher resolution image contrast agents for preclinical imaging and high frequency clinical imaging.
In vivo characterisation
The in vivo behaviour of the nanoparticle samples was investigated in mouse aorta models using the VisualSonics Vevo 770 pre-clinical imaging system with a 40 MHz transducer.Three CD1 nude mice were imaged using HFUS as described above, each with a different preparation of bubbles or particles; either a raw population of microfluidic bubbles (containing both microbubbles and nanoparticles), or microbubbles or nanoparticles isolated by buoyancy separation. The HFUS images were false coloured (in green) in order to display the change in contrast when the bubble populations were introduced into the vascular system (Fig. 7). A basic comparison between the maximum contrast intensity achieved with each bubble preparation, was done, with the peak intensity from the wash-in curve determined. The peak intensity from the mixed bubble/particle population (Fig. 7(a)) and the nanoparticles population (Fig. 7(b)) were very similar (288 and 296 arbitrary units (A.U.), respectively), and both were much greater than the microbubble only population (Fig. 7(c)) (97 A.U.). These data suggest that the majority of signal seen (with the VisualSonics Vevo 770 40 MHz system) in the mixed bubble/particle population is attributable to the nanoparticle component, with a much lower proportion of the signal coming from microbubbles. Time vs. intensity curves (TIC) for the different samples were also taken, the microbubble only sample (from the separated mix) and nanoparticle only sample (from the separated mix) has been added to the ESI† (S7). From the TIC curves, the longevity of the nanoparticle sample compared to the microbubble only sample can clearly be seen, with contrast intensity at >131 lasting 40 s post injection. This was also comparable to the whole mixed population of microbubbles and nanoparticles, which showed a contrast intensity of over 100 for the 40 s post injection, suggesting at these higher frequencies much of the contrast signal observed was from the nanoparticle fraction. The high contrast intensity observed from mixed bubble and nanoparticle only samples in in vivo experiments could be attributed to two factors. The first being that a higher frequency transducer (40 MHz) was used for these experiments, which is much closer to the expected resonant frequency of the sub-micron bubbles (60 MHz) than the 15 MHz transducer used in the phantom experiments. In addition, ultrasound activated phase change; the elevated temperature of in vivo experiments is likely to facilitate the phase conversion of smaller fluid filled C4F10 droplets in to gaseous nanobubbles, enhancing the contrast signal.
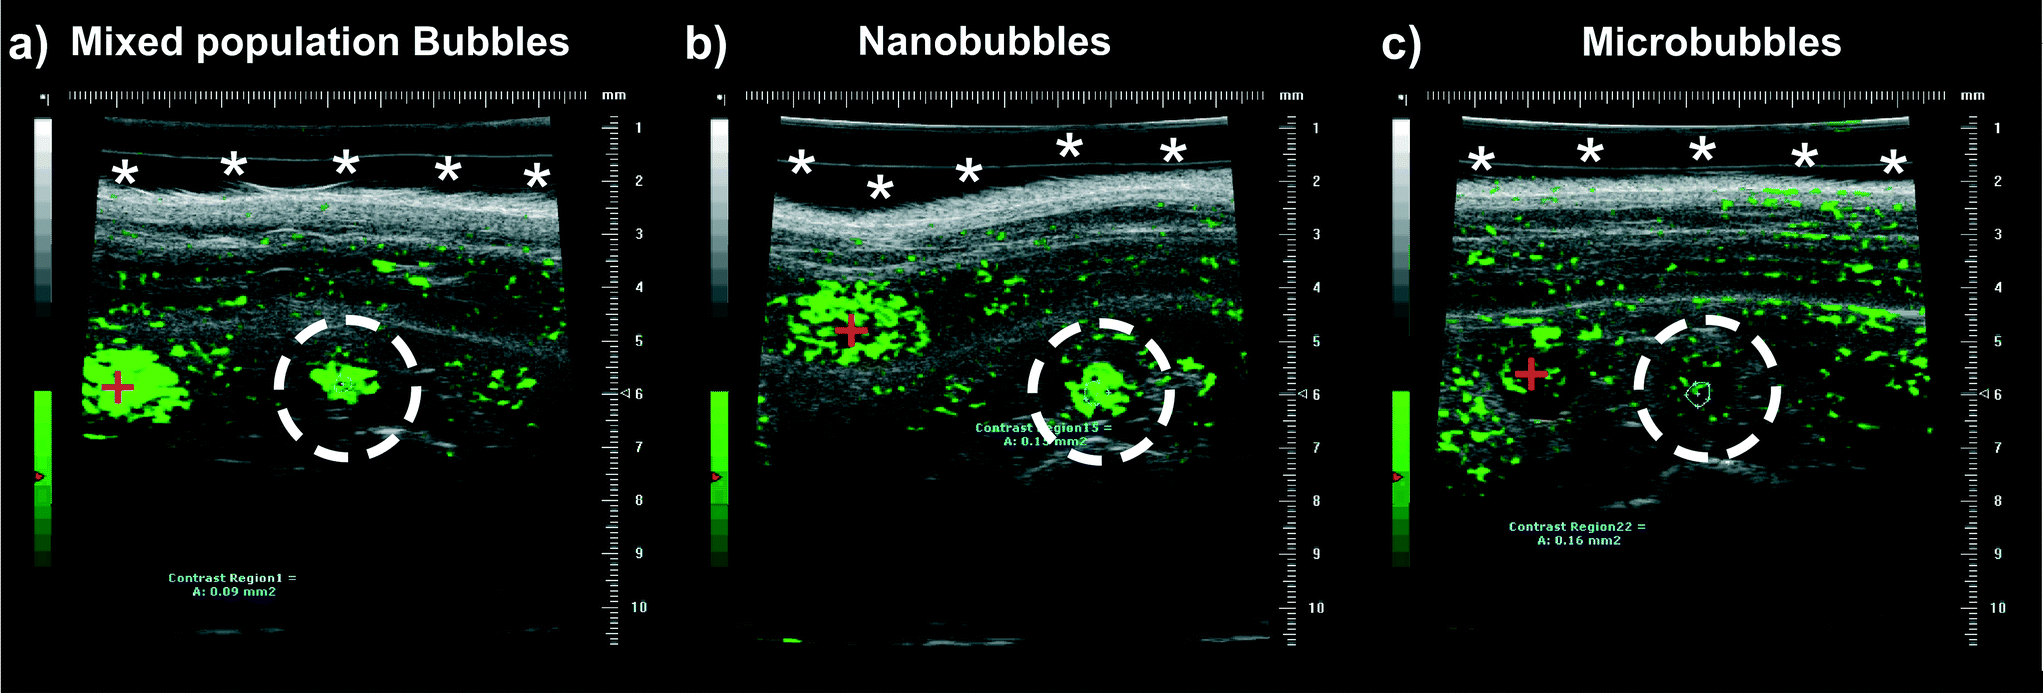 | ||
| Fig. 7 HFUS images of mouse aorta after bolus delivery of bubble agents. A bubble preparation was delivered via tail vein catheter at 0.6 ml min−1 regulated by a syringe driver. (a. Mixed population bubbles b, nanobubbles c, microbubbles). The aorta was identified in each mouse (circled) and the wash-in data for the aorta were exported to GraphPad Prism (version 6.05 for Windows, GraphPad Software, La Jolla, California, USA) to determine the peak wash-in intensity for each bubble population (288 A.U., 296 A.U. and 97 A.U. for the mixed, nanobubble and microbubble populations, respectively). | ||
Conclusions
We have demonstrated the first microfluidic preparation of high concentrations of nanoparticles of C4F10 using a microspray flow regime. Nanoparticles with diameters between 50 nm and 1 μm were produced at high concentration, of the order 1011–1012 nanoparticles per mL, as counted and sized by qNano, and of which ~1010 mL−1 were fluorocarbon droplets. Nanoparticle populations were likely to be mix of liquid and gaseous cores of C4F10 for diameters <1 μm. Ultrasound measurements confirmed the presence of gas filled particles that showed higher backscatter signal than water filled liposomes of a similar size. Nanoparticles imaged in mice aorta showed excellent contrast intensity when compared to samples of mixed bubble sizes (micro- and nano-) and microbubbles only, suggesting that at high frequencies used in pre-clinical imaging, nanoparticles contribute highly to the contrast intensity observed in US imaging. These nanoparticles have the potential to provide higher resolution contrast imaging when working at higher ultrasound frequencies. Further, their ability to perfuse into tumours would provide better resolution in diagnostic ultrasound and increase efficiency of bubble based drug delivery systems. Future work will include tailoring the microspray regime to preferentially produce nanoparticles over micron sized bubbles by optimising flow and gas pressures and bubble shell chemistry. Nanoparticles will also be investigated for improved extra-cellular imaging in tumours and drug delivery potential in in vitro and in vivo models.Acknowledgements
We gratefully acknowledge financial sponsorship from the EPSRC (EP/K023845/1). J. M. would like to acknowledge support from an early career Leverhulme fellowship (ECF-2013-247). We also thank the Leeds Microbubble Consortium for valued discussions.References
- D. Cosgrove, Eur. J. Radiol., 2006, 60, 324–330 CrossRef PubMed.
- R. H. Abou-Saleh, S. A. Peyman, K. Critchley, S. D. Evans and N. H. Thomson, Langmuir, 2013, 29, 4096–4103 CrossRef CAS PubMed.
- S. Sirsi and M. Borden, Bubble Sci., Eng., Technol., 2009, 1, 3–17 CrossRef CAS PubMed.
- A. Alzaraa, G. Gravante, W. Y. Chung, D. Al-Leswas, M. Bruno, A. R. Dennison and D. M. Lloyd, Am. J. Surg., 2012, 204, 355–366 CrossRef PubMed.
- J. McLaughlan, N. Ingram, P. R. Smith, S. Harput, P. L. Coletta, S. Evans and S. Freear, IEEE Trans. Ultrason. Ferroelectr. Freq. Control., 2013, 60, 2511–2520 CrossRef PubMed.
- K. Kooiman, H. J. Vos, M. Versluis and N. de Jong, Adv. Drug Delivery Rev., 2014, 72, 28–48 CrossRef CAS PubMed.
- M. J. K. Blomley, J. C. Cooke, E. C. Unger, M. J. Monaghan and D. O. Cosgrove, Br. Med. J., 2001, 322, 1222–1225 CrossRef CAS PubMed.
- W. B. Zimmerman, V. Tesar and H. C. H. Bandulasena, Curr. Opin. Colloid Interface Sci., 2011, 16, 350–356 CrossRef CAS.
- A. Agarwal, W. J. Ng and Y. Liu, Chemosphere, 2011, 84, 1175–1180 CrossRef CAS PubMed.
- F. Y. Ushikubo, T. Furukawa, R. Nakagawa, M. Enari, Y. Makino, Y. Kawagoe, T. Shiina and S. Oshita, Colloids Surf., A, 2010, 361, 31–37 CrossRef CAS.
- K. Ohgaki, N. Q. Khanh, Y. Joden, A. Tsuji and T. Nakagawa, Chem. Eng. Sci., 2010, 65, 1296–1300 CrossRef CAS.
- S. Ljunggren and J. C. Eriksson, Colloids Surf., A, 1997, 129, 151–155 CrossRef.
- Z. Xing, J. Wang, H. Ke, B. Zhao, X. Yue, Z. Dai and J. Liu, Nanotechnology, 2010, 21 Search PubMed.
- H. Wu, N. G. Rognin, T. M. Krupka, L. Solorio, H. Yoshiara, G. Guenette, C. Sanders, N. Kamiyama and A. A. Exner, Ultrasound Med. Biol., 2013, 39, 2137–2146 CrossRef PubMed.
- H.-P. Tong, L.-F. Wang, Y.-L. Guo, L. Li, X.-Z. Fan, J. Ding and H.-Y. Huang, Ultrasound Med. Biol., 2013, 39, 2147–2157 CrossRef PubMed.
- Y. Wang, X. Li, Y. Zhou, P. Huang and Y. Xu, Int. J. Pharm., 2010, 384, 148–153 CrossRef CAS PubMed.
- X. Zhang, Y. Zheng, Z. Wang, S. Huang, Y. Chen, W. Jiang, H. Zhang, M. Ding, Q. Li, X. Xiao, X. Luo, Z. Wang and H. Qi, Biomaterials, 2014, 35, 5148–5161 CrossRef CAS PubMed.
- R. Cavalli, A. Bisazza, M. Trotta, M. Argenziano, A. Civra, M. Donalisio and D. Lembo, Int. J. Nanomed., 2012, 7, 3309–3318 CrossRef CAS PubMed.
- M. A. Wheatley, F. Forsberg, N. Dube, M. Patel and B. E. Oeffinger, Ultrasound Med. Biol., 2006, 32, 83–93 CrossRef PubMed.
- D. S. Wagner, N. A. Delk, E. Y. Lukianova-Hleb, J. H. Hafner, M. C. Farach-Carson and D. O. Lapotko, Biomaterials, 2010, 31, 7567–7574 CrossRef CAS PubMed.
- L. J. E. Anderson, E. Hansen, E. Y. Lukianova-Hleb, J. H. Hafner and D. O. Lapotko, J. Controlled Release, 2010, 144, 151–158 CrossRef CAS PubMed.
- C.-H. Wang, Y.-F. Huang and C.-K. Yeh, Langmuir, 2011, 27, 6971–6976 CrossRef CAS PubMed.
- P. S. Sheeran and P. A. Dayton, Curr. Pharm. Des., 2012, 18, 2152–2165 CrossRef CAS PubMed.
- T. O. Matsunaga, P. S. Sheeran, S. Luois, J. E. Streeter, L. B. Mullin, B. Banerjee and P. A. Dayton, Theranostics, 2012, 2, 1185–1198 CrossRef CAS PubMed.
- P. S. Sheeran, J. E. Streeter, L. B. Mullin, T. O. Matsunaga and P. A. Dayton, Ultrasound Med. Biol., 2013, 39, 893–902 CrossRef PubMed.
- P. S. Sheeran, J. D. Rojas, C. Puett, J. Hjelmquist, C. B. Arena and P. A. Dayton, Ultrasound Med. Biol., 2015, 41, 814–831 CrossRef PubMed.
- P. S. Sheeran, V. P. Wong, S. Luois, R. J. McFarland, W. D. Ross, S. Feingold, T. O. Matsunaga and P. A. Dayton, Ultrasound Med. Biol., 2011, 37, 1518–1530 CrossRef PubMed.
- M. Hashimoto and G. M. Whitesides, Small, 2010, 6, 1051–1059 CrossRef CAS PubMed.
- E. Castro-Hernandez, W. van Hoeve, D. Lohse and J. M. Gordillo, Lab Chip, 2011, 11, 2023–2029 RSC.
- M. Hashimoto, S. S. Shevkoplyas, B. Zasonska, T. Szymborski, P. Garstecki and G. M. Whitesides, Small, 2008, 4, 1795–1805 CrossRef CAS PubMed.
- K. Hettiarachchi, E. Talu, M. L. Longo, P. A. Dayton and A. P. Lee, Lab Chip, 2007, 7, 463–468 RSC.
- E. Talu, K. Hettiarachchi, R. L. Powell, A. P. Lee, P. A. Dayton and M. L. Longo, Langmuir, 2008, 24, 1745–1749 CrossRef CAS PubMed.
- T. D. Martz, P. S. Sheeran, D. Bardin, A. P. Lee and P. A. Dayton, Ultrasound Med. Biol., 2011, 37, 1952–1957 CrossRef PubMed.
- S. A. Peyman, R. H. Abou-Saleh, J. R. McLaughlan, N. Ingram, B. R. G. Johnson, K. Critchley, S. Freear, J. A. Evans, A. F. Markham, P. L. Coletta and S. D. Evans, Lab Chip, 2012, 12, 4544–4552 RSC.
- N. Maennicke, M. Schoene, M. Gottwald, F. Goebel, M. L. Oelze and K. Raum, Ultrasound Med. Biol., 2014, 40, 244–257 CrossRef PubMed.
- C. P. Pavlovich, T. C. Cornish, J. K. Mullins, J. Fradin, L. Z. Mettee, J. T. Connor, A. C. Reese, F. B. Askin, R. Luck, J. I. Epstein and H. B. Burke, Urol. Oncol., 2014, 32, 34.e27–34.e32 CrossRef PubMed.
- E. Ruckenstein, Colloids Surf., A, 2013, 423, 112–114 CrossRef CAS.
- J. M. Gorce, M. Arditi and M. Schneider, Invest. Radiol., 2000, 35, 661–671 CrossRef CAS PubMed.
- R. E. Apfel and C. K. Holland, Ultrasound Med. Biol., 1991, 17, 179–185 CrossRef CAS PubMed.
- C. C. Church, Acoust. Res. Lett. Online, 2005, 6, 162–168 CrossRef.
- K. Chen and H. J. Richter, Int. J. Multiphase Flow, 1997, 23, 699–712 CrossRef CAS.
- D. R. Evans, D. F. Parsons and V. S. J. Craig, Langmuir, 2006, 22, 9538–9545 CrossRef CAS PubMed.
- A. Needles, D. E. Goertz, R. Karshafian, E. Cherin, A. S. Brown, P. N. Burns and F. S. Foster, Ultrasound Med. Biol., 2008, 34, 1139–1151 CrossRef CAS PubMed.
- A. Needles, M. Arditi, N. G. Rognin, J. Mehi, T. Coulthard, C. Bilan-Tracey, E. Gaud, P. Frinking, D. Hirson and F. S. Foster, Ultrasound Med. Biol., 2010, 36, 2097–2106 CrossRef CAS PubMed.
- J. McLaughlan, N. Ingram, R. Abou-Saleh, S. Harput, T. Evans, S. Evans, L. Coletta, S. Freear and Ieee, IEEE Int. Ultrason. Symp., 2013, 1493–1496 Search PubMed.
- C. Sun, V. Sboros, M. B. Butler and C. M. Moran, Ultrasound Med. Biol., 2014, 40, 541–550 CrossRef PubMed.
- J. Mamou, O. Aristizabal, R. H. Silverman, J. A. Ketterling and D. H. Turnbull, Ultrasound Med. Biol., 2009, 35, 1198–1208 CrossRef PubMed.
- H. Choi, H.-C. Yang and K. K. Shung, Ultrasonics, 2014, 54, 754–758 CrossRef PubMed.
Footnote |
† Electronic supplementary information (ESI) available: Supporting information S1: video of a bubble sample in a viewing chamber showing microbubbles rising to the top and underneath a population of smaller bubbles moving with Brownian motion. Supporting information S2: high speed imaging of the microspray regime (100![[thin space (1/6-em)]](https://www.rsc.org/images/entities/char_2009.gif) 000000 fps) showing the velocity of the microspray was still too high to capture single bubble formation. Supporting information S3: effect of lipid concentration on microspray particle size and concentration. S4: expansion ratio model used to calculate the predicted increase in nanoparticle diameter on the increase of temperature in Fig. 4a from ref. 42. Supporting information S5: comparison of lipid solution only passing through tubes of the set-up compared to lipid solution going through the microfluidic device. S6: plot to show change in resonant frequency vs. bubble diameter. S7: time vs. intensity curves to support in vivo observations in Fig. 7, TIC curves for microbubble only and nanobubble only. See DOI: 10.1039/c5lc01394a 000000 fps) showing the velocity of the microspray was still too high to capture single bubble formation. Supporting information S3: effect of lipid concentration on microspray particle size and concentration. S4: expansion ratio model used to calculate the predicted increase in nanoparticle diameter on the increase of temperature in Fig. 4a from ref. 42. Supporting information S5: comparison of lipid solution only passing through tubes of the set-up compared to lipid solution going through the microfluidic device. S6: plot to show change in resonant frequency vs. bubble diameter. S7: time vs. intensity curves to support in vivo observations in Fig. 7, TIC curves for microbubble only and nanobubble only. See DOI: 10.1039/c5lc01394a |
| This journal is © The Royal Society of Chemistry 2016 |