
Laser ablation molecular isotopic spectrometry (LAMIS): current state of the art
Alexander A.
Bol'shakov
 a,
Xianglei
Mao
b,
Jhanis J.
González
ab and
Richard E.
Russo
*ab
a,
Xianglei
Mao
b,
Jhanis J.
González
ab and
Richard E.
Russo
*ab
aApplied Spectra, Inc., 46665 Fremont Boulevard, Fremont, CA 94538, USA
bLawrence Berkeley National Laboratory, University of California, Berkeley, CA 94720, USA. E-mail: rerusso@lbl.gov
First published on 2nd November 2015
Abstract
Laser Ablation Molecular Isotopic Spectrometry (LAMIS) is a direct and rapid technique that measures optical emission in laser-induced plasmas for isotopic analysis. LAMIS exploits relatively large isotope shifts in spectra of transient molecular isotopologues formed in laser ablation plasma. LAMIS can be performed without sample preparation at atmospheric pressure in open air or inert buffer gases. A spectrometer with modest spectral resolution can be suitable for both LIBS and LAMIS techniques, and thus elemental and isotopic measurements can be accomplished on the same instrument. To date, detection of several isotopes (H, B, C, N, O, Cl, Sr, and Zr) in laser ablation plumes was demonstrated. Precision of quantitative LAMIS measurements was within 9‰ for the 10B/11B ratio determined with confidence of 95% (2σ-interval). Simultaneous determination of isotopes of different elements was shown to be physically possible, while determination of several isotopes of the same element was successfully demonstrated (Sr, Zr). The studies on double-pulse LAMIS and femtosecond LAMIS indicated further prospects for improving accuracy and sensitivity in this technique. A possibility of semi-quantitative isotopic analysis at distances up to 7.8 m without using calibration standards was demonstrated. The latter technique was named as Femtosecond Filament-induced Laser Ablation Molecular Isotopic Spectrometry (F2-LAMIS). Application of LAMIS in industrial, laboratory, and field operations is possible; and such measurements can be realized at a standoff distance to the sample.
1. Introduction
Laser ablation is a process of fast localized removal of the material that is exposed to a pulsed laser beam with nano-, pico- or femtosecond duration of the pulses. In the analytical applications, laser ablation is commonly used as a direct and rapid micro-sampling technique to atomize and ionize a small portion from the analyzed specimen, thus generating a luminous plasma plume. This laser-induced plasma serves as a light and ion source to measure optical emission or mass spectra for the elemental and isotopic analysis of the targeted spot. Laser Induced Breakdown Spectroscopy (LIBS)1–6 is an optical analysis technology that can instantly acquire atomic emission from ablation in a broad spectral region providing rapid information on elemental composition of the ablated sample. Since only photons need to arrive at and then leave from the target, the target location can be on the surface of solid and liquid samples or inside the sample volume of gases, liquids, and aerosols (near or far from the laser).Laser Ablation Molecular Isotopic Spectrometry (LAMIS)7 is a similar analytical technique that explores optical spectra of transient molecules produced in ablation plumes in air or buffer gases for rapid isotopic analysis of the samples. LAMIS measures molecular emission as the plasma cools, when free molecules are formed in the plasma afterglow via several mechanisms including radiative and three-body association of atoms and recombining ions. The isotopic constituents produce the electronically, vibrationally and rotationally excited isotopologues of dimers, oxides, nitrides or halides in plasma reactions between the atomized matter from the sample and the ambient atmosphere.
Isotopologue molecules have isotopic spectral shifts that are considerably larger than those in atomic spectra, and therefore the former can be measured with a general purpose spectrometer. Molecular quantum energy levels, particularly the vibrational and rotational components, strongly depend on mass difference between isotopes, while the electronic energy is primarily determined by the Coulomb field but significantly less dependent on the mass of nuclei.7 Consequently, molecular transitions involving change of vibrational and rotational states can exhibit up to several orders of magnitude larger isotopic shifts than atomic transitions, which are purely electronic in nature. Larger isotopic shifts in LAMIS significantly relax requirements on spectral resolution relative to LIBS. The necessity of high resolution is the main reason why LIBS is generally not utilized for isotopic detection. Even in theory, the isotopic splitting in atomic spectra of the majority of elements cannot be resolved in LIBS emission, since these splittings are smaller than the Stark and other kind of spectral line broadening.
Both nano- and femtosecond pulsed lasers have been used for LAMIS measurements, but picosecond lasers have not yet been attempted in LAMIS. Femtosecond ablation yields significantly stronger molecular emission at a lower background as compared to nanosecond ablation at the same laser irradiance provided to the sample. Femtosecond ablation plasma is known to be relatively cool and short-lived versus nanosecond ablation, even at similar laser pulse energy and fluence conditions. The femtosecond regime significantly decreases heat dissipation and melting of the sample. This can result in fewer matrix effects and improved precision and accuracy of LAMIS. The use of femtosecond lasers reduces destructiveness of the analysis owing to lower pulse energies applied to the sample relative to nanosecond laser pulses. A high-irradiance femtosecond laser radiation can form a self-focusing contracted plasma channel (“filament”) through the open air, enabling a long-range LAMIS capability.8 However, the majority of LAMIS studies have still exploited nanosecond lasers operating at near-infrared wavelength of 1064 nm.
The double-pulse approach, in which a second laser pulse was coupled into an ablation plasma with a short delay after the first pulse, was found to enhance sensitivity of LAMIS.9 An enhancement in intensity of molecular spectra can be attributed to additional excitation of molecules due to collisions with free electrons reheated by the second laser pulse. Echelle or Czerny–Turner spectrographs fitted with ICCD or EMCCD cameras were generally recognized as suitable for LAMIS, while femtosecond ablation combined with numerical filtering of spectra enabled LAMIS measurements with a non-gated CCD detector. A generalized diagram of a typical laboratory apparatus that can be used for both LIBS and LAMIS is depicted in Fig. 1. Common nanosecond lasers deliver series of pulses ranging in energy between single to several hundred millijoules per pulse, while femtosecond lasers emit pulsed energy from single microjoules up to several millijoules per pulse. Laser irradiance is adequate for ablation with both laser types, and it can be higher in femtosecond versus nanosecond ablation because of ultra-short pulse duration of the former.
 | ||
| Fig. 1 Schematic diagram of a typical laboratory LIBS/LAMIS apparatus. | ||
A typical example of how atomic, ionic, molecular and continuum emission evolve with time in the laser-induced plasma is illustrated in Fig. 2 for the case of a boron nitride sample ablated in air with a nanosecond pulsed laser.9 The ejected boron atoms and ions emit their characteristic spectral lines, and later react with dissociated oxygen from air to form BO radicals in the afterglow of a laser ablation plume. The temporal behavior of these species is specific to the conditions (laser wavelength, irradiance, pulse energy and duration, repetition rate). Usually after a nanosecond ablation pulse the continuum background decreases fast, then the ionic emission followed by the atomic emission are decaying on the scale of one or several microseconds. Molecular emission can persist for tens of microseconds after the laser pulse as shown in Fig. 2 for two individual rotational lines belonging to the bands A2Πi → X2Σ+ (0–3) and B2Σ+ → X2Σ+ (0–2) of BO. The optimal signal-to-background ratio for molecular emission can often be comparable to that of atomic emission (the two dashed lines in Fig. 2) but optimum conditions will differ from each other.
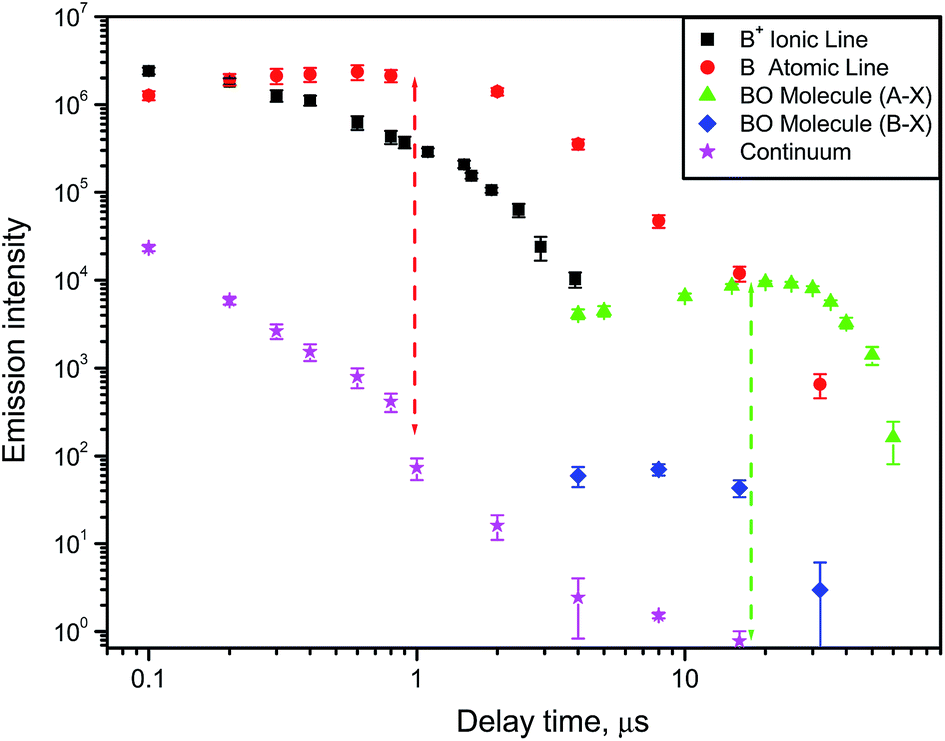 | ||
| Fig. 2 Emission intensities of boron atomic (249.77 nm) and ionic (345.13 nm) lines, boron monoxide (A → X at 572 nm; B → X at 256 nm) lines and continuum radiation at 256 nm versus delay time from the moment of laser ablation. | ||
Quantitative calibration of spectral data in LAMIS can be achieved by different means. A common empirical approach involves measuring spectra from a set of known reference samples and building a partial least squares regression (PLSR) model to relate them to the nominal abundances of isotopes in the samples. This model is applied to compare spectra of the analyzed unknown samples to the reference spectra. Quantification is based on proportionality between emission from the plasma-generated isotopologues and the isotopic abundances in the sample. Such calibration alleviates errors caused by possible isotope fractionation in the ablation plumes. Another quantification approach in LAMIS uses simulated spectra of relevant isotopologues and a proportional sum of them is fitted to the experimental emission spectra. The isotope ratio is entered as a fitting parameter and is determined from the best fit. This approach does not require isotopic standards but depends on quality of tabulated molecular parameters and assumptions of equilibrated and homogeneous plasma.
A classic approach to simulating molecular spectra is based on the Herzberg theory of the molecular structure.10 In application to LAMIS, this approach was described earlier.7 The molecular constants required for calculations can be found either in the original research literature or in the book by Huber and Herzberg.11 The isotopic shifts in the simulated spectra can be computed with the molecular constants simply multiplied by a square root of the reduced mass ratio of the isotopologues.10 The improved molecular constants can be determined by numerical iterations if the experimental high-resolution spectra are available.12 An accurate modeling of the relevant to LAMIS spectra can be accomplished by using extensive lists of molecular lines and their transition probabilities. Such lists are published electronically (e.g., http://www.exomol.com) and are produced from the robust quantum chemistry models using direct solution of the Schrödinger equation for nuclear motion and carefully determined dipole momenta. The synthesized spectrum is then fit to the experimental one. The main fitting parameters are the rotational temperature and the isotope ratio. In some cases the vibrational temperature, line broadening (linewidth) and continuum background are also used as the fitting parameters.
A multitude of molecular formation mechanisms in laser ablation plasmas is usually complex and varied for different species; hence optimizing the experiment is necessary and the optimum conditions will differ from case to case. Typically the optical emission spectra in LAMIS are measured at longer delays after an ablation pulse than the delays used in LIBS. Accordingly, the optimal settings for LIBS and LAMIS are different but can be achieved with the same instrument. The preferred laser pulse parameters depend on the type of samples and the aim of the analysis but they should resemble those used in LIBS because the ablation method is the same. A possibility of combining LIBS and LAMIS for simultaneous elemental and isotopic analysis can enable multiple applications anticipated in the nuclear power industry, medical diagnostics and therapies, forensics, carbon sequestration, geochemistry, agronomy and many other studies. Potentially LIBS and LAMIS can be built into a portable device for the elemental and isotopic analysis directly in the field.
The current level of LAMIS evolution is still limited to illustrations of the LAMIS feasibility for several elements and isotopes, among which B and C have been studied in greater details than others. Molecular spectrum simulations revealed that many other isotopes can be measured by LAMIS.7 The sensitivity and precision of LAMIS still need to be improved for most of practical applications. Several directions for such improvements are discussed in the conclusion of this review. Applications that can already be implemented using LAMIS, are briefly discussed for each element in respective sections. However, only a few initial tests for practical uses were attempted to date, including measurements of boron isotopes in neutron shielding materials and a boron carbide sample originating from a nuclear reactor. Several mixed boron-containing substances and two tourmaline rocks were analyzed for boron isotopes, and several samples of coal and soil were analyzed for carbon isotopes. All other work on LAMIS was performed using chemically pure materials.
The present review does not cover applications of the conventional elemental LIBS for isotopic analysis which can be performed only for a few elements: either very light (H, Li) or very heavy (some actinides). Recently forenamed applications were thoroughly reviewed elsewhere.1,3 Also not covered in this review are various studies on molecular emission in LIBS if they are not associated with the isotopic measurements. Numerous examples of utilizing such isotope-unresolved molecular emission in LIBS (e.g., analysis of polymers, organics, explosives, pharmaceuticals, food products, biomedical and forensic samples, etc.) can be found in recent books.1,4–6 No consideration is given here on the mass spectrometric detection of isotopes in laser-induced plasmas. The purpose of this review is to summarize the results of the work on LAMIS and to analyze potential applications. All results obtained by now and available in the literature on subject of LAMIS are grouped according to the investigated elements for quick referencing.
2. Hydrogen and deuterium
The initial experiments were carried out using a flashlamp-pumped Nd:YAG laser with wavelength of 1064 nm, pulse duration of 4 ns, and adjustable pulse energy up to 150 mJ. The laser operated at a repetition rate 10 Hz. An optical steering system was used to focus the ablating laser beam on the sample surface within a spot of 100 to 250 μm in diameter. Ablation plasma plumes were projected through a lens onto an entrance slit of a spectrograph in the direction perpendicular to the incident laser beam, producing 1![[thin space (1/6-em)]](https://www.rsc.org/images/entities/char_2009.gif) :1 images. Either a Czerny–Turner or an echelle spectrographs were used interchangeably to disperse a range of wavelengths onto a recording camera. The ICCD used was PI-MAX2 (Princeton Instruments) featuring an imaging array 1024 × 1024 of 13 μm pixels with the Unigen intensifier. The spectrum acquisition gate widths and delays were optimized to measure molecular emission from the OH and OD radicals.7,13,14
:1 images. Either a Czerny–Turner or an echelle spectrographs were used interchangeably to disperse a range of wavelengths onto a recording camera. The ICCD used was PI-MAX2 (Princeton Instruments) featuring an imaging array 1024 × 1024 of 13 μm pixels with the Unigen intensifier. The spectrum acquisition gate widths and delays were optimized to measure molecular emission from the OH and OD radicals.7,13,14
Vapors of ordinary water (H2O) and heavy water (D2O) were ablated to demonstrate LAMIS for hydrogen isotopic measurements.7 The OH and OD emission at A2Σ+ → X2Πi (0–0) transition from the plasma plume was recorded using a low-resolution spectrograph. This transition consists of six main branches owing to its doublet multiplicity. The gate width of the ICCD detector was set to 60 μs with the delay of 25 μs, contrary to a usual value of ∼1 μs typically used for atomic detection in LIBS. The most prominent spectral features were observed at ∼306 nm (R11, R22 branch heads) and ∼309 nm (Q22 branch head) with partially resolved individual rotational lines. The experimental shift between the Q22 branch heads of OH and OD was approximately 0.65 nm. This shift is larger than the separation of 0.18 nm between H and D atomic lines at 656.29 and 656.11 nm, respectively. However, more important is that the hydroxyl spectra are significantly less prone to Stark broadening than atomic lines of H and D. Spectral linewidths of light atoms such as hydrogen and deuterium can be broadened up to several nanometers in laser ablation plasmas.
Sarkar et al.13 used LAMIS to analyze light and heavy water introduced in the form of a moist Ar flow produced by bubbling argon through several water samples with different D/H ratios. Isotopic calibration was built using PLSR of spectral responses from a set of 8 reference samples. Several PLSR models were constructed over spectra collected under different conditions in two spectral intervals with resolution ∼15 pm. Statistically better results for D/H determination were achieved in a 311.5–315.5 nm interval that included several overlapping branches with relatively high J-rotational quantum numbers belonging to vibrational bands (0–0) and (1–1) of OH and OD. The other tested spectral interval was 306–310 nm that included rotational lines with relatively lower J numbers. The isotopic shifts between OH and OD typically increase with increasing J numbers, and thus differentiation among the spectra was better for the high J interval. Branches R11 and R22 undergo a red shift from OH to OD, while the other 4 branches are shifted even more but to the lower wavelength.
Measurements were performed in an argon flow open to air at atmospheric pressure with acquisition delay 8 μs after laser pulses.13 The FWHM of the Hα line was 0.35 nm but the rotational lines of OH and OD were no wider than ∼15 pm limited by spectrograph resolution. Both intensity and degree of differentiation in OH and OD spectra were considered. The effect of spectral resolution on analytical performance was also studied. A low-resolution spectrograph (Δλ = 1.2 nm) delivered analytical figures that were only slightly less precise and accurate relative to the results obtained at high resolution. These LAMIS results were compared with measurements of H and D atomic lines using conventional LIBS. Analytical merits of LAMIS were found superior over LIBS for determination of the D/H ratio, especially when a small spectrograph with low resolution was used for both techniques.
A recent study14 demonstrated a possibility of using LAMIS for simultaneous determination of H and O isotopes in ice. Emission of hydroxyl radicals at the A2Σ+ → X2Πi transition was recorded during ablation of ordinary water ice (H2O), heavy water ice (D2O) and ice with 90% atomic fraction of 18O. Argon flow was applied to displace ambient air. The isotopic shifts between 16OH and 18OH are smaller than those between OH and OD. Nevertheless, the spectra of hydroxyl isotopologues 16OH, 18OH, and 16OD were resolved using a compact spectrograph (IsoPlane-320, Acton/PI). A wavelength region 311.8–314.0 nm that included rotational lines with relatively high J numbers was chosen for analysis, similarly to the work of Sarkar et al. The intense features in these spectra (Fig. 3) belong to the rotational lines of branches Q11 and Q22 with quantum numbers from J = 13.5 to J = 18.5. Smaller contributions come from P11, P22 and minor branches of bands (0–0) and (1–1). These results confirmed that a compact spectrograph is sufficient for LAMIS. Isotopic calibration for ice analysis can be accomplished using PLSR as previously realized for water vapor.13
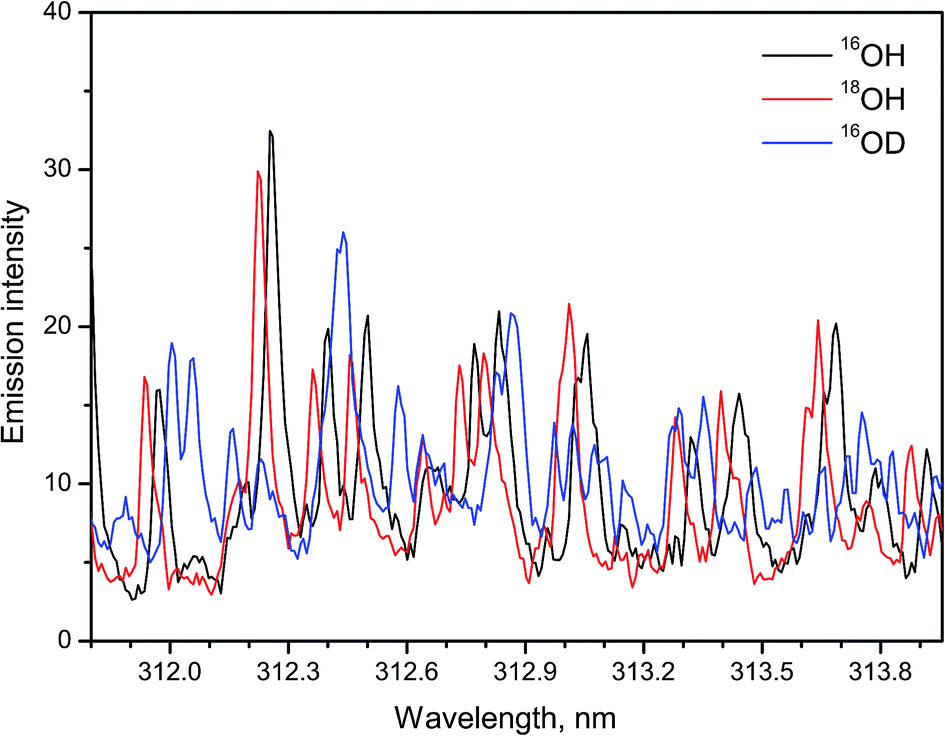 | ||
| Fig. 3 Spectra of 16OH, 18OH, 16OD molecules in the A → X (0–0) band formed during laser ablation of ice. Spectra were averaged over a series of 10 replicates, each made of 100-pulse accumulations. | ||
Serrano et al.15 analyzed the formation processes of diatomic hydrogenated radicals using femtosecond laser-induced plasmas in air at atmospheric pressure. Each of the three tested substances (urea, terephthalic acid and anthracene) was either of the naturally low isotopic ratio D/H or highly enriched in deuterium, thus making up 6 samples in total. The spectra of OH and OD were measured in the spectral interval 305–315 nm at resolution ∼60 pm using ablation of H- and D-urea with 60 fs laser pulses of 3.3 mJ per pulse (Ti:sapphire laser operating at 800 nm). The ICCD delay was 0.5 μs, and the gate width was 25 μs. The experimental spectra were compared with simulations of the progression A2Σ+ → X2Πi (Δν = 0) computed for both OH and OD using the LIFBASE software.16 The fitting allowed to estimate vibrational and rotational temperature (Tv and Tr) of these species integrated over the gate time 25 μs. The deduced values were Tv = 5300 (5500) K and Tr = 3200 (3500) K for OH (OD). A similarity between the OH and OD internal energy distributions (Tv, Tr) implied common mechanisms of their formation.
The results from laser ablation of terephthalic acid C6H4(COOH)2 and C6D4(COOH)2 indicated that the extracted atoms H or D from the sample reacting with atmospheric oxygen were responsible for the formation of the OH or OD radicals in plasma, while the direct detachment of the intact hydroxyl groups from the sample was not involved.15 Moisture in air also did not supply any noticeable amount of OH as evidenced by the absence of the OH emission during laser ablation of deuterated urea CO(ND2)2. These conclusions are important for the accurate implementation of LAMIS because complete atomization and equilibration of the ablated material preserves the stoichiometry of the sample. However, the complete atomization does not always occur in laser ablation, and therefore careful considerations and optimization are necessary prior to the analysis.
Femtosecond ablation of urea and terephthalic acid yielded the isotope-resolved spectra of NH and ND featuring the band heads (0–0) and (1–1) of the system A3Πi → X3Σ−. These two band heads were observed at 335.99 and 337.10 nm for NH, and at 335.66 and 336.39 for ND.15 The sample of urea produced more intense NH emission than did the terephthalic acid sample. The H atoms extracted from terephthalic acid reacting with nitrogen from air were producing NH, as no nitrogen was in the sample. However, the native NH fragments were probably released from urea contributing to higher intensity of the NH spectrum relative to that from terephthalic acid. The natural and deuterium-enriched samples also exhibited CH and CD spectra. The observed features were the band heads (0–0) and (1–1) of the system C2Σ+ → X2Πr at 314.38 and 315.74 nm for CH, and at 314.23 and 315.05 nm for CD. Also, the Q-branch heads of the band A2Δ → X2Πr (0–0) were observed at 430.99 and 430.31 nm for CH and CD, respectively.15
The natural abundance ratio for D/H is 0.015% which is lower than the sensitivity achieved so far in LAMIS. However, there are multiple practical areas where LAMIS can be applied. Many neutron detection devices are based on deuterated scintillator materials that must be verified for composition and homogeneity at various technological phases during production and for the final quality control. Deuterated drugs and stable isotope markers are increasingly used in the fields of medicine, pharmacology, nutrition and physiology for tracing biochemical processes. Mechanisms of various reactions and pathways of the H involved can be understood by deuterating the reactants and then analyzing the D/H ratio in the reaction products.
Heavy water nuclear reactors require deuterium enrichment above 99.85%. Increasing deuterium in water to this level requires a triple-stage enrichment process; from low (0.015–1%), middle (1–99.5%) to high (>99.5%) enrichment. Each of these stages can be monitored by LAMIS to determine the D/H ratio. Even a low-resolution LAMIS instrument, can be suitable for rapid and on-line applications in the nuclear industry, for example, routine isotopic analysis of heavy water in pressurized heavy water reactors (PHWR) and on-line monitoring to maintain ALARA (as low as reasonably achievable) radiation exposure level.
Other challenges that can be potentially tackled with a LIBS/LAMIS device include measuring a significant build-up of deuterium and other impurities in blank walls of plasma fusion tokamaks, such as the International Thermonuclear Experimental Reactor (ITER). The analysis of the D/H ratio in gaseous samples is also necessary for the development of hydrogen fuel cells that are among the best candidates for renewable energy sources.
3. Boron
Two stable isotopes of boron 10B and 11B with their natural abundance ratio 10B/11B of about 0.25 were measured most frequently among all other isotopes in research work on LAMIS. This happened because 10B is a crucial element for the nuclear industry due to especially high neutron absorbing efficiency of 10B. Moreover, there are many applications in which the 10B/11B ratio is measured as a natural tracer in geochemistry, hydrology, oceanography, environmental and other sciences. These important applications combined with readily obtainable boron monoxide emission during laser ablation in air motivated a keen scientific interest in LAMIS.While the isotope-specific molecular spectra were known for more than a century and the laser ablation chemical analysis was studied since the invention of lasers, there was no resolved isotopologue emission measurements in ablation plasma reported before Niki et al.17 They used a low-pressure chamber filled with air at 400 Pa to ablate a boron disk of the natural isotopic ratio. At 400 Pa the ablation plumes were large, hemispherical of 15 mm in diameter. Twelve bands of BO were observed using gate delays of 1 to 30 μs, within 330–560 nm at resolution of 0.4 nm. A change 5% in isotopic composition could be determined by fitting the calculated to experimental spectrum of the band A2Πi → X2Σ+ (0–2) of both 10BO and 11BO. A large size of the low-pressure plumes precluded collection of light from the whole plume. A detector with spatial resolution was suggested for the precision improvement.
Russo and coworkers9,18 measured boron isotopes 10B and 11B by ablating in open air three chemically pure substances: isotope-enriched 10B2O3 and 11B2O3, and natural BN. The results indicated that LAMIS can be calibrated using spectral normalization followed by PLSR for measurements of the isotopic ratio with precision characterized by relative deviations within 9‰ from the mean value of the 10B/11B ratio at confidence of 95% (2σ-interval).18 Spectra were accumulated over 1000 laser pulses with the analysis time 100 s at 10 Hz. Precision can be further improved down to errors within only 1‰ using an increased repetition rate and a total number of laser pulses up to 120 thousand (analysis time 2 min at 1 kHz). The measured and extrapolated reduction in relative errors of determination of the 10B/11B ratio is represented in Fig. 4 against the number of the collected LAMIS spectra. Spectral resolution better than 0.23 nm was found unnecessary for boron isotopic determination in LAMIS.9
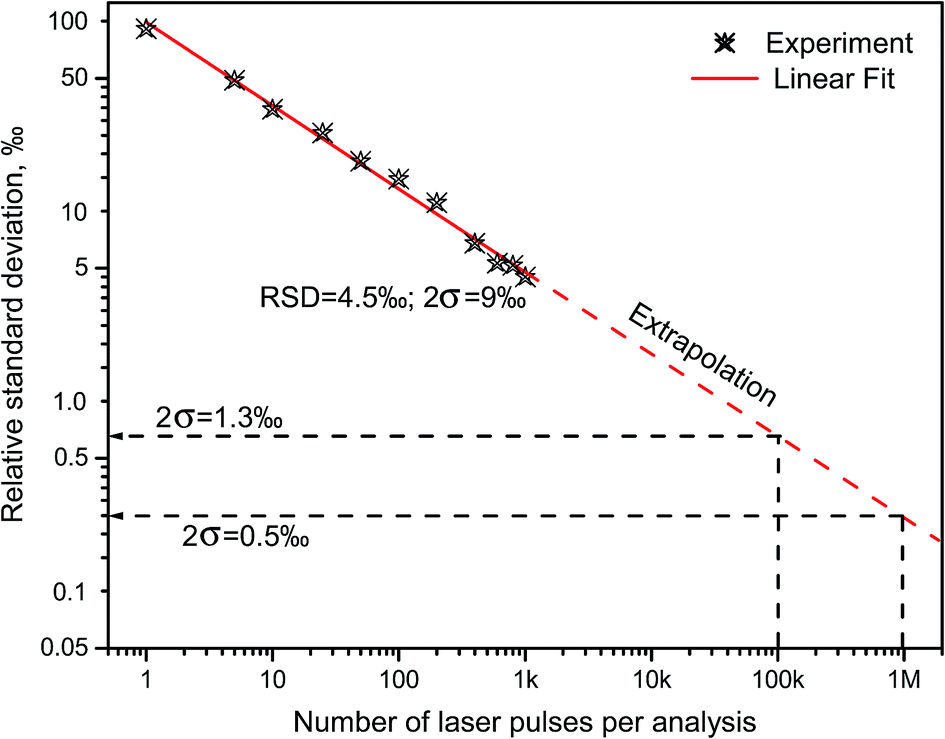 | ||
| Fig. 4 Measured and extrapolated reduction in the relative standard deviations (1σ) of the 10B/11B ratio determination versus the number of laser ablation pulses used for accumulating LAMIS spectra from the BN sample in air. | ||
Relevance of LAMIS measurements to industrial applications was tested on neutron absorber materials manufactured by 3M-Ceradyne (Canada).14 Two samples of aluminum alloyed composites with different boron isotope ratios were ablated in air and analyzed using a compact spectrograph IsoPlane-320. One of the samples was a Boral core, which was aluminum alloy consolidated with 56% boron carbide of natural boron isotope abundance. The other sample was BorAluminum, a regular unalloyed aluminum (grade 1100) with 4.5% added elemental boron, enriched in the lighter isotope 10B up to 95%. The ablation spectra of these samples recorded between 591–608 nm are presented in Fig. 5. These spectra were acquired with delay 10 μs and gate width 100 μs. They include rotational lines of BO molecule in the vibrational band (0–3) of the A2Πi → X2Σ+ emission system.
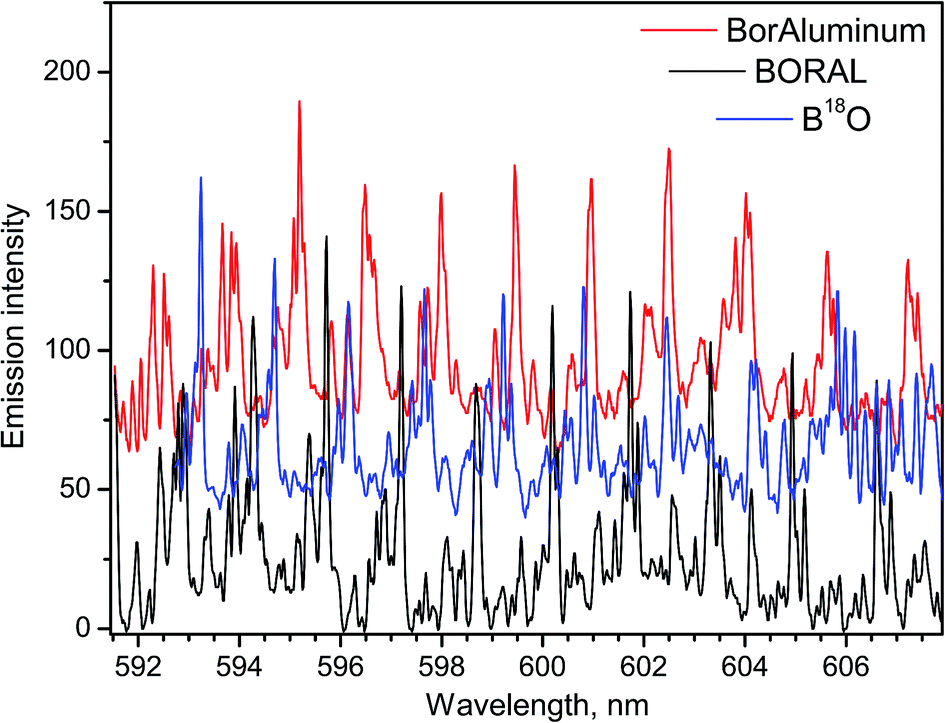 | ||
| Fig. 5 Spectra of BO A → X (0–3) emission formed by ablating in air of two aluminum-based composite materials containing different 11B/10B ratios. Spectrum of B18O obtained by ablating BN in H218O vapor. Spectra are shifted up for clarity (continuum background subtracted). | ||
For the work on LAMIS, the BO A2Πi → X2Σ+ emission was used in the range of visible bands (0–2)18,19,21 and (0–3);9,18,20,21 and ultraviolet emission at transition B2Σ+ → X2Σ+ (0–2)7,9,22 was also explored. The ultraviolet emission can be beneficial to reduce sunlight interference in outdoor standoff applications. However, usually a choice of the spectral region was driven by quality of the spectra for multivariate quantification. Visible bands are several hundred times more intense than the ultraviolet bands of BO. The temporal behavior of the individual rotational lines belonging to the visible and ultraviolet bands is plotted in Fig. 2. The data in Fig. 5 illustrate a significant isotopic shift between spectra of Boral (80% 11B) and BorAluminum (95% 10B), requiring only modest spectral resolution. Because of the optimized delay (10 μs), these spectra did not have interferences from atomic aluminum or chemical impurities in the samples.
Yee et al.20 used femtosecond laser ablation of four boron carbide samples and reported relative accuracy within 2% in three-point calibration for determination of the 10B/11B isotopic ratio. They measured 10B/11B ratios utilizing BO emission in the 532–540 nm region. The spectra were deconvolved using a multivariate regression function over 155 cubic splines to reconstruct both constituents from the two boron isotopes. Femtosecond ablation resulted in low continuum emission background, enabling non-gated time-integrated measurements that were sufficient for accurate isotopic characterization. A non-radioactive B4C sample from the Breazeale Nuclear Reactor was analyzed for 10B content using 200 ablation pulses and confirmed <5% accuracy in 10B determination by LAMIS. Precision and accuracy within a few percent are often satisfactory for the nuclear industry.
Ko and Jovanovic21 compared femto- and nanosecond ablation in LAMIS while using non-gated acquisition of spectra in both approaches. They demonstrated that pre-processing of LAMIS spectra with numerical spectral filtering (low-pass or Fourier high-pass) and normalization prior to creating spline-approximated PLSR can effectively reduce the influence of high continuum background in nanosecond ablation. Application of optimized numerical filters decreased the variances of calibration points up to ∼2 orders of magnitude, which resulted in improved accuracy of isotopic determination. The authors concluded that neither femtosecond lasers nor ICCD cameras are necessary for boron isotopic measurements by LAMIS, and therefore inexpensive compact LAMIS instruments with non-gated CCD detectors can be potentially developed.
Brown et al.22 purposely studied the matrix effects on determination of 10B atomic fraction using LAMIS to analyze several boron-containing substances and mixtures. They tested pure metallic boron, boron nitride, solid boric acid, lanthanum borate, anhydrous borax, borax detergent additive, Pyrex glass, and two blends of borax with aluminum silicate and boric acid with cellulose. The experimental LAMIS parameters were optimized for BO measurements during BN ablation in air, and then applied unchanged for all other samples. Matrices had a minimal effect on 10B determination for most samples, except LaBO3, Pyrex and a silicate blend. The LaBO3 spectrum was vastly plagued by atomic and ionic lines of lanthanum, while Pyrex and a silicate blend did not produce discernible BO emission under conditions used. The native oxygen contained in most substances did not affect BO emission, implying domination of plasma reactions with air to form BO in the ablation plumes. These results indicated ability of LAMIS to measure accurately 10B in different substances with relative uncertainty ∼3% as long as BO emission was assertively recorded.
Similarly to other analytical techniques, LAMIS is subject to chemical and physical matrix effects. The results of Brown et al.22 demonstrated that LAMIS can be remarkably robust regarding measurements of boron isotopes in very different matrices even without optimizing the experimental conditions for every matrix. A proposed algorithm14 that automatically fits a Lorentzian profile to the interfering spectral lines and numerically subtracts them from the spectrum can be applied to digitally purge the spectrum of BO from the lanthanum lines that precluded 10B determination in work of Brown et al.
A possibility of LAMIS application for geological analysis14 was examined using two tourmaline samples of different color and composition. Otherwise crowded LIBS spectra had the least of atomic interferences in a region 572–585 nm. At a delay 3 μs, only two spectral lines of atomic Fe were persistent in this spectral interval in one of the tourmaline samples. The positions of these interfering lines could be masked from the spectrum in order to determine boron isotopic composition using PLSR. Provided that the interfering lines are sparse, they do not necessarily preclude the isotopic analyses. However, appropriate isotopic standards of tourmaline would have been required for accurate calibration.
Already attained high precision in determination of 10B/11B by LAMIS (uncertainty 9‰)18 is comparable with that in SIMS and better than offered by ICP-OES, ICP-QMS, and LA-ToF-MS for boron isotopic ratio measurements. This level of precision is reasonably adequate for geochemical analysis, because natural variation of the 10B/11B ratio in the terrestrial environment is more than 90‰. Precision of LAMIS can be further improved by increasing spectral accumulation. In this course, it will probably be necessary to include into consideration two isotopes of oxygen 16O and 18O, both of which participate in BO emission. The spectrum of B18O was obtained by ablating a BN sample in argon with H218O water vapor (Fig. 5). It demonstrates that a compact spectrograph resolves different BO isotopologues and they can be determined simultaneously by LAMIS.
Owing to unique nuclear properties, 10B-enriched materials are often used for neutron absorption and shielding in nuclear reactors and spent fuel storage pools, as well as for screens and curtains in nuclear medicine centers. Enrichment in 10B about 50% and up to 99% is often used in these products. LAMIS can directly analyze gradients of burnt-up 10B isotopes in nuclear control rods (boron carbide) and shields (borated steel and aluminum, borobond ceramics), or can monitor condition of coolants (boric acid). Analysis can be performed remotely, delivering a laser beam through a window and collecting optical emission either by a telescope or a cable of optical fiber. Accuracy within several percent is typically sufficient in such measurements.
Neutron detection devices loaded with 10B (e.g., scintillators) can be rapidly tested by LAMIS for isotopic and elemental composition, hetero- or homogeneity, and possible defects for the purpose of quality assessment and quality control. In radio-chemotherapeutic cancer research, the tumor cells are loaded with high doses of 10B by administering targeted drugs. Three-dimensional isotopic mapping of tissue with fine spatial definition is then required and can be realized with LAMIS.
4. Carbon
Carbon isotopes are indicative of primary bio-productivity and energy cycling and are most important for studying biochemistry. The relative biological enhancement of 12C over 13C can be up to 5% (e.g., in methanogen bacteria). Carbon isotope measurements can facilitate tracing the origins of anthropogenic CO2 and can reveal environmental setbacks related to the subsurface carbon sequestration and shale fracking. Variation of the natural isotopic ratio 13C/12C in different materials ranges from 0.96% to 1.15%. These variations can be measured using LAMIS. The ability to distinguish between spectra of the three C2 isotopologues in laser ablation of graphite has been asserted using a synthetic Swan spectrum.23 Laser ablation of carbon-containing samples in air typically produces C2 and CN radicals in comparable quantities. Both these species have been used for measuring carbon isotope ratio.Utilization of spectra of carbon dimers C2 for LAMIS measurements was thoroughly studied.7,14,19,24–27 Kinetic isotope fractionation was observed in C2 emission suggesting that carbon isotopes 12C and 13C can behave differently in laser ablation plumes.24–26 Fragmentation of aromatic rings from benzoic acid samples into 12C2 dimers was found more effective than formation of molecules 13C12C (only group 13COOH was labeled with 13C).24 As a consequence, determined isotopic ratios 13C/12C deviated from the original ratio in the sample. The latter effect was observed relatively close to the sample surface (<2 mm) and therefore, these results can be attributed to preferential evaporation of the native 12C2 fragments from a hot sample surface after ablation pulse. Evaporation of carbon in the molecular versus atomic form is thermodynamically favored.
Incomplete dissociation of the double bond 13C![[double bond, length as m-dash]](https://www.rsc.org/images/entities/char_e001.gif) 13C in laser ablation of a 13C-labeled fumaric acid pellet was studied by Glaus et al.25 They found that in the beginning the ablation plasma was mostly atomized; and initially (up to gate delay 4 μs, gate width 2 μs) the majority of C2 in the plasma was formed by association of free carbon atoms. At longer delays the main supply of the gas-phase dimers 13C2 was from partial dissociation of the original molecules of fumaric acid of the sample. A switch in the main formation mechanism was concurrent with the change in a plume shape from prolate to oblate at the longer delays. An oblate plasma plume adjacent to the sample surface (within ∼0.6 mm) suggested prevailing of the molecular evaporation and partial fragmentation mechanisms over the free atom association. Contribution of partially dissociated molecules directly from the sample to the gas-phase C2 was significantly less in argon than in nitrogen atmosphere. Only after the delay of 40 μs the role of fragmentation in argon became comparable to that in nitrogen at delays of 5–10 μs.
13C in laser ablation of a 13C-labeled fumaric acid pellet was studied by Glaus et al.25 They found that in the beginning the ablation plasma was mostly atomized; and initially (up to gate delay 4 μs, gate width 2 μs) the majority of C2 in the plasma was formed by association of free carbon atoms. At longer delays the main supply of the gas-phase dimers 13C2 was from partial dissociation of the original molecules of fumaric acid of the sample. A switch in the main formation mechanism was concurrent with the change in a plume shape from prolate to oblate at the longer delays. An oblate plasma plume adjacent to the sample surface (within ∼0.6 mm) suggested prevailing of the molecular evaporation and partial fragmentation mechanisms over the free atom association. Contribution of partially dissociated molecules directly from the sample to the gas-phase C2 was significantly less in argon than in nitrogen atmosphere. Only after the delay of 40 μs the role of fragmentation in argon became comparable to that in nitrogen at delays of 5–10 μs.
The ambient gas obviously affects the mechanisms and their dynamics in the ablation plumes. Laser ablation plasma in argon remains hot for a longer time than that in air or nitrogen because argon is inert and has low thermal conductivity, while nitrogen consumes energy for dissociation or dissipates it through numerous intramolecular channels, and becomes chemically reactive in its atomic form. Owing to these effects the plasma plume cools faster in nitrogen (or air) and also because thermal conductivity of nitrogen and air is higher than that of argon. At long delays, the surface of the sample may remain hot enough to continue releasing molecular fragments into an already cold but still ionized plume. Since formation of C2 does not require reactions with atmospheric constituents, argon is a better environment to sustain enough energy in the gaseous phase of the plume for complete dissociation of species and for sufficient time for them to equilibrate.
Other noble gases can also be useful in LAMIS. Laser ablation plumes in helium have larger size and lower gas temperature than plumes in argon or air. Helium environment can be used to reduce Stark and collisional broadening of spectral lines. Dong et al.26 ablated a pellet of mixed benzoic acid and amorphous carbon in a chamber filled with neon. They reported significant deviations of the observed isotopic ratio 13C/12C from the nominal one at the distances close to the sample surface (<2 mm). At larger distances from the sample (2–5 mm) and gate delays between 4 to 10 μs, the observed isotopic ratio 13C/12C was close to the real ratio in the sample.
Experimental conditions in LAMIS should be selected so that the ablated material becomes completely atomized, then equilibrates and associates into excited diatomic molecules. The use of the forth-harmonic laser ablation at 266 nm that directly breaks chemical bonds is probably preferable over ablation at 1064 nm. However, all studies on LAMIS for carbon isotopes to date have been performed using 1064 nm lasers. Operating at longer delays facilitates equilibration of the atomized matter within the plume but can yield erroneous results due to partial molecular fragmentation. For the LAMIS analysis of organic samples using C2 emission, an argon atmosphere assists in full atomization of the ablation plume. Remaining fractionation effects may be minimized when space-integrated emission is collected from the whole plume, contrary to the studies,24–26 in which fractionation was purposely refined and investigated.
The ratio of densities of the free dimers 13C12C and 12C2 was determined to elucidate the isotopic effects in the ablation plumes in air using the simulated Swan spectra.24 Fitting the synthesized to an experimental spectrum from a benzoic acid pellet with the ratio 13C/12C = 1:6 = 16.7% was performed for isotopic quantification. Because of the significant enrichment in the 13C isotope, simulating only the bands d3Πg → a3Πu (1–0) for both isotopologues of 13C12C and 12C2 was sufficient (Fig. 6). Spectral resolution of 10 pm, delay time 1 μs, and gate width 0.75 μs were used. Assuming carbon dimers originated only from association of free atoms, the statistical relation between the number of the resulting isotopologue molecules should be 13C12C/12C2 = 1:3 = 33.3%. This relationship held only for delay 0.6 μs in the work of Dong et al.24 A relatively slow release of the native 12C2 fragments directly from the aromatic rings without their atomization was suggested as a probable cause of deviations from the stoichiometric ratio.
 | ||
| Fig. 6 The Swan bands (1–0) of the two isotopologues 13C12C and 12C2. Synthetic spectrum fitted to the experimental from ablating a 13C-labeled benzoic acid pellet (13C/12C = 16.7%) in open air. | ||
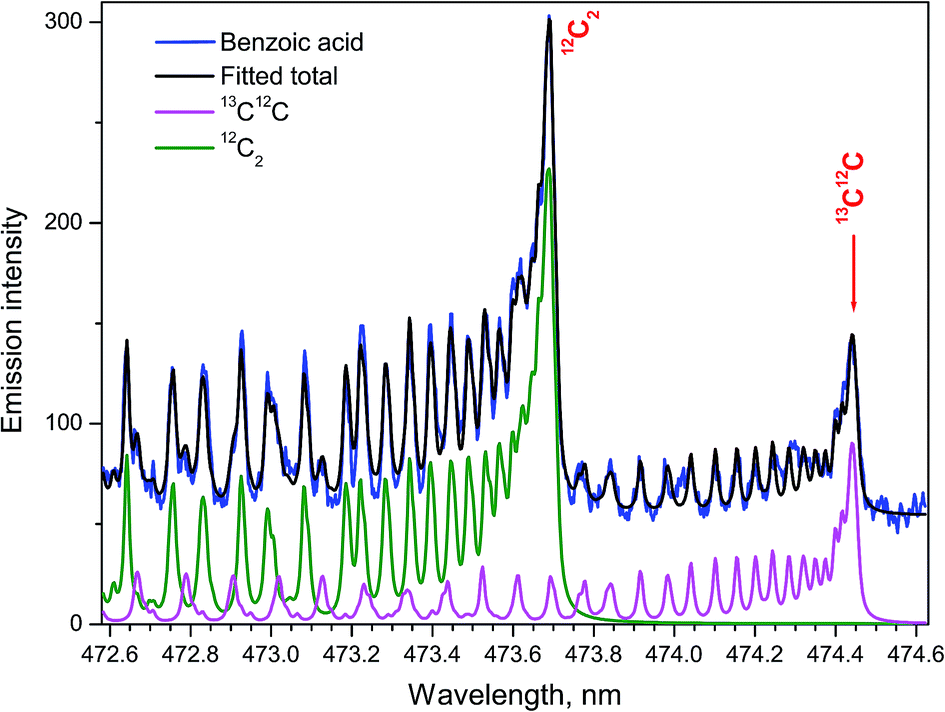
Samples with the natural abundance of carbon isotopes required a more sophisticated spectrum simulation due to the significantly higher relative intensity in the tails of several nearby bands from the major isotopologue 12C2. A synthetic spectrum of the Swan system of C2 was computed in the region where the band head of 13C12C d3Πg → a3Πu (1–0) at 474.45 nm appears among other lines of the 12C2 band system.27 Fitting of the synthesized to an experimental spectrum from ablation of graphite was performed. The best fit was achieved with a 13C/12C ratio of 1.08% and rotational temperature of 5155 K. The isotopic ratio obtained by LAMIS agreed well with the value measured from the same graphite sample by IRMS technique (1.0804%).27 The individual contribution of 13C12C and the final simulated total sum of 5 components from both isotopologues along with the experimental spectrum are shown in Fig. 7. The intensity scale was normalized on the maximum of the band head of 12C2 d3Πg → a3Πu (1–0). Time gate was 30 μs with a delay 2 μs. Spectral resolution was 10 pm, and data were averaged over 1000 laser pulses.
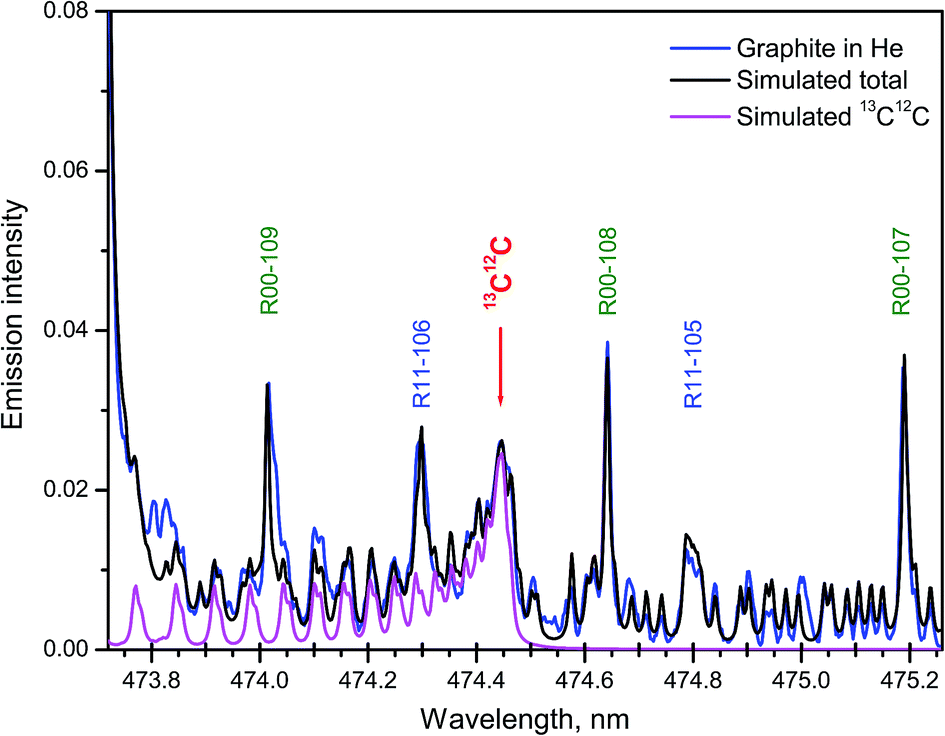 | ||
| Fig. 7 Part of the Swan system with band (1–0) of 13C12C among rotational lines of 12C2. Synthetic spectrum fitted to that recorded during ablation of graphite of natural abundance in helium. Designations of 12C2 lines are simplified, e.g., “R00-109” stands for coincident triplet lines: R1(J = 109), R2(J = 108), and R3(J = 107) of 12C2 (0–0). | ||
Formation of CN radicals in LAMIS of organic and inorganic samples was found less prone to isotope fractionation compared to C2.27 Moreover, carbon and nitrogen isotopes can be determined simultaneously using spectra of CN isotopologues.7,14,19,27 Two spectral intervals of CN emission were used for LAMIS measurements: 354–362 and 411–422 nm.14,27 These intervals include two band progressions with opposite changes in a vibrational quantum number Δν = ±1 of the CN transition B2Σ+ → X2Σ+. Spectra from a natural graphite sample and two benzamide pellets enriched in 13C and 15N (Fig. 8) were measured by a compact spectrograph IsoPlane-320 around the bands with Δν = +1. The rotational structure of these bands was barely resolved but isotopic shifts between isotopologues of 12C14N, 13C14N, and 12C15N were clearly observed. Isotopic shifts are larger for the other progression (Δν = −1) between 411–422 nm but in this case the bands of the minor isotopologues sit on top of the relatively intense tails from the major isotopologue (Fig. 9).
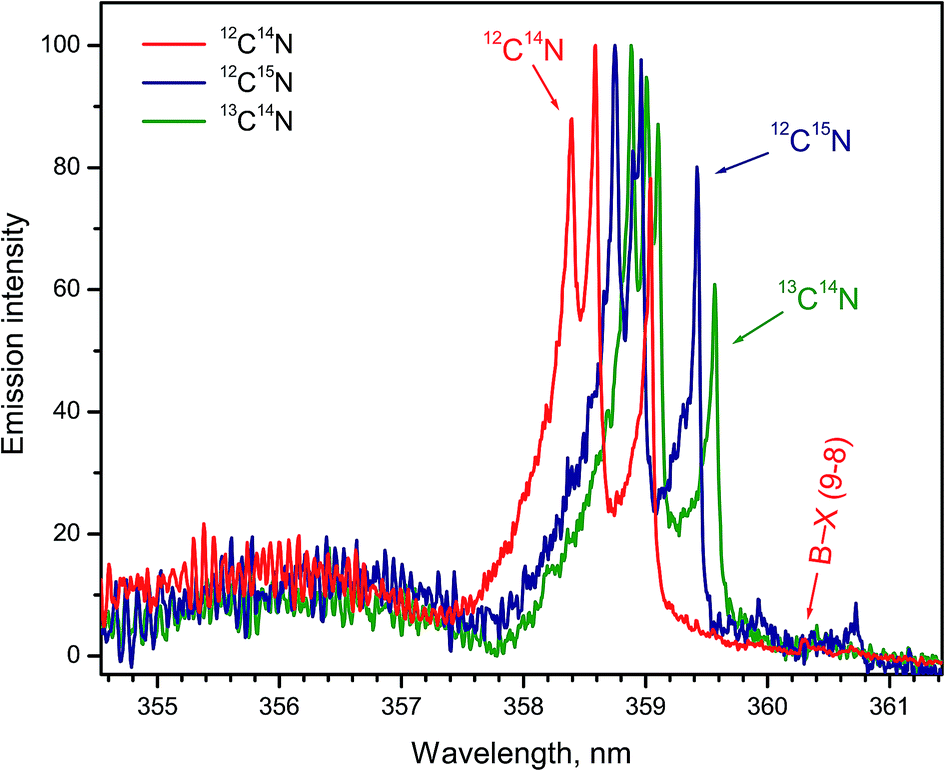 | ||
| Fig. 8 Normalized spectra of CN vibrational band progression (B → X; Δν = +1) formed during ablation of natural graphite and benzamide pellets enriched in 13C and 15N isotopes. Spectra were averaged over 100 laser pulses. Bands of 12C15N were recorded in a helium flow. | ||
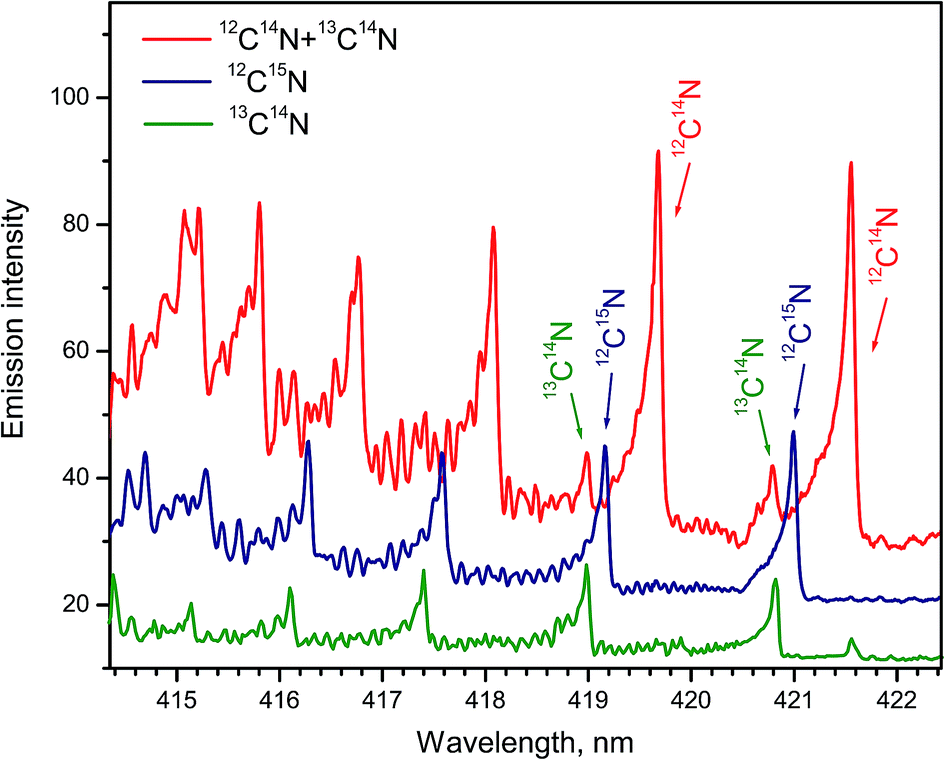 | ||
| Fig. 9 Spectra of CN vibrational band progression (B → X; Δν = −1) formed during ablation of benzamide pellets enriched in 13C and 15N isotopes. Spectra were averaged over 100 laser pulses. Bands of 12C15N were recorded in a helium flow. | ||
The bands B2Σ+ → X2Σ+ (0–1) of 12C14N and 13C14N in the interval 419.8–422.0 nm were both synthesized and measured at spectral resolution 10 pm.24 Pelletized benzoic acid powder was used as an ablation target in air. Fitting the experimental spectrum with the synthetic one provided relative densities of these isotopologues in the state B2Σ+ (ν = 0). The derived data were used to calculate a dependence of the ratio 13C/12C on the delay time up to 8 μs. Within experimental uncertainty, the determined 13C/12C ratio was equal to the stoichiometric ratio at the delay of 0.6 μs, but dropped to slightly lower values at longer delays. Fragmentation of the benzene rings into C2 dimers that prevailed over full dissociation into free atoms was offered as an explanation of non-stoichiometric ratios. However, the ratio 13C/12C derived from CN spectra deviated significantly less from the sample stoichiometry than was the deviation of this ratio derived from C2 spectra.24
The temporal evolution of the band heads of 13CN at 420.9 nm and 12CN at 421.6 nm of the band B2Σ+ → X2Σ+ (0–1) was analyzed to study the isotope-specific formation of CN during laser ablation in nitrogen of 13C-labeled fumaric acid.25 The intensity ratio for the band heads 13CN/12CN increased from 0.76 to 1.3 for delays from 2.5 to 40 μs, while the value matching the stoichiometric ratio 13C/12C = 1 occurred at about 8 μs. The temporal increase of the ratio 13CN/12CN was tentatively linked to a depleted supply of 12C in the late afterglow owing to preferential fragmentation of fumaric acid into 12CO or 12CO2 molecules, as the most stable bond in fumaric acid is the double bond 12CO. The fragments 13C2 might be still partially atomized to form 13CN, or to react directly with N in the plasma to form CN. However, the second case was ruled out by Dong et al.24
Laser ablation of nitrogenous organic compounds in air or nitrogen results in formation of the free CN radicals that include nitrogen either from the sample or from the atmosphere. Glaus et al.25 ablated a pellet of blended urea and graphite in ambient nitrogen. The contribution of the ambient nitrogen dominated over the native intramolecular nitrogen in the formation of CN molecules. Mixing of the ambient gas with the target material in the plasma plume was incomplete at the early stage of the plume development. For the delays longer than ∼20 μs, the contributions from sample and ambient nitrogen equilibrated.25
Spectra of CN molecule were calibrated using PLSR for quantitative determination of the 13C isotope in solid samples.14,27 A set of reference samples was prepared by blending powders of natural and 13C-enriched decanoic acid. A natural atomic fraction of 13C was calculated from these measurements as (1.09 ± 0.14)% in a good agreement with known average atomic fraction of 13C. Averaging over 10 measurements (each one made of 100-pulse accumulations) can reduce an estimated random error in the average 13C fraction down to ±0.044%. Precision and accuracy of carbon isotope measurements could be improved if better homogenized reference standards were available for calibration. This empirical calibration method reduced possible errors from unpredicted isotope fractionation effects.
The success of the empirical calibration of the CN spectra for quantitative LAMIS measurements was also based on the volume-integrated collection of light from the whole ablation plume, thus minimizing an impact of spatial fractionation of isotopes within the plume. It is possible that simultaneous measurements and analysis of the spectra of both CN and C2 isotopologues will further improve accuracy of LAMIS because these two radicals seemingly behave complementary to each other in regard to the isotopic fractionation.
LAMIS was tested for isotopic analysis of coal, graphite and diamond,27 and also soil samples.14 However, practical applications were hampered so far by interfering atomic lines of metals, particularly Fe and Cr that were persistent in the region of CN B → X (Δν = +1) bands even at long delays after ablation. It was concluded that an algorithm of fitting a Lorentzian or Voigt profile to every interfering spectral line and digitally subtracting them from the spectrum can be applied as a remedy.
5. Nitrogen
The stable isotope 15N is frequently used as a tracer complementing 13C because measurement of only one isotope is often insufficient in studying complex biotic and abiotic processes relevant to the ecology, biosphere, and geochemistry, both organic (fossil) and inorganic. Analytical techniques based on measurements of the 15N tracer have been utilized and comprehensively studied particularly in agronomy, since nitrogen is a critical plant resource. Fertilizers enriched typically above 40% in 15N relative to 14N are broadly used to track the efficiency of plant uptakes, fertilizer losses and nitrogen turnover in soil. The 15N is used to trace nitrate leaching from agricultural fields as it causes both groundwater pollution and losses of fertilizer at an additional economic cost.Glaus et al.25 studied the interaction of laser ablated organics (enriched 98% 15N urea) with the ambient 14N2 atmosphere. They found that the outcome of the radicals C15N in the plume was less than 10% of the total produced CN, but the majority were the C14N resulting from reactions of the ablated matter with ambient nitrogen, evidently because ambient gas provided an excess of N in the plasma. The pronounced anisotropy of the C15N to C14N ratio across the plume diameter was observed in the early plasma, indicating poor initial mixing of the ablated material with the ambient gas. Steep gradients of the distribution of 15N originating from the target material and 14N from the ambient gas were observed over the diameter of the plasma. For the later plasmas (>20 μs), the contributions from sample and ambient nitrogen isotopes equilibrated. When the 15N-urea sample was ablated in argon, the resulting CN radicals were almost exclusively C15N.
Calibration of LAMIS for measurements of 15N was performed with reference samples prepared by pelletizing blended powders of natural and 15N-enriched benzamide.14 Atomic fractions of 15N in the reference samples were 0.37, 1.0, 2.0, 5.0, 10, 20 and 99%. The samples were ablated in a helium flow to preclude nitrogen entrainment from air. The CN spectra (Fig. 9) of vibrational band progression B2Σ+ → X2Σ+ (Δν = −1) were collected within the range 414–422 nm using a compact spectrograph IsoPlane-320. Ten replicates of spectra accumulating 100 laser pulses each from each sample were acquired using a 10 μs timing gate delayed after the laser pulse by 1.5 μs. A multivariate PLSR calibration was built straightforwardly but the resulting precision was insufficient for determination of natural variations of isotopic ratio 15N/14N.
Precision and accuracy of quantification were again limited by micro-scale isotopic inhomogeneity of the reference samples that were prepared. Inaccuracies in nominal isotopic content in the prepared reference mixtures also increased the calibration errors. Application of LAMIS for measuring the ratio 15N/14N at the current level of development is, therefore, confined to artificially enriched samples, such as found in agronomic studies on fertilizers efficiency or therapeutic research based on isotope-labeled drugs. Similarly to determining the ratio 13C/12C in coal and soil samples,14 there will be a need to address persistent interferences caused by atomic lines of metals present in all geo- or ecological samples.
6. Oxygen
Oxygen isotopic analysis of ice is the main tool in paleoclimatology and glaciology studies. Measuring 18O/16O ratios in rocks and minerals is important for geochemistry. Oxygen isotope ratios between mineral pairs commonly serve as geothermometers. Enriched 18O–water is used as an important precursor in the radiopharmaceutical industry and for various medical and biological tracer studies. Measurements of 18O with LAMIS using hydroxyl and boron monoxide spectra have already been discussed above in this review.Aluminum and calcium oxides are very common constituents in many minerals. Accordingly, molecular spectra of AlO and CaO are easily detectable in laser ablation of rocks and sediments. Five band progressions of AlO B2Σ+ → X2Σ+ (Δν = 0, ±1, ±2) emission were observed within a broad interval 445–545 nm during ablation of several rocks, including various feldspar, tourmaline, and rock salt.14 This spectral range is usually populated with many atomic spectral lines, and therefore LAMIS measurements required choosing a smaller segment of the spectrum and using relatively long delays. Natural abundance ratio for 18O/16O is about 0.2%, and thus only 18O-enriched samples have been measured by LAMIS up to now.
Natural and isotope-enriched Al2O3 pellets were ablated in a helium flow to illustrate that Al18O and Al16O can be spectrally resolved in LAMIS. The spectra of AlO band progression B2Σ+ → X2Σ+ (Δν = +1) were measured for both isotopologues indicating that AlO emission can be used to measure the oxygen isotopic ratio 18O/16O in rock samples.14 Rotational and vibrational temperatures of AlO derived from band progression B → X (Δν = 0) behaved differently relative to each other across the plasma plume, especially at small delays after the ablation pulse. With the increasing delays of acquisition, rotational and vibrational temperature profiles tended to flatten and then equilibrated after about 20 μs.
A spectral interval containing emission from several bands of the system B2Σ+ → X2Σ+ of Al18O and Al16O recorded during ablation of the 18O-enriched pellet of Al2O3 is shown in Fig. 10. The band head (0–1) of the minor isotopologue appears at 507.04 nm between rotational lines of the transitions with Δν = 0 of the main isotopologue. The respective band head (0–1) of Al16O lies at 507.93 nm, while the next band head (1–2) of Al18O is observed at 509.26 nm. The simulated spectra of these bands and the tails of the progression B → X (Δν = 0) of Al16O are also included in Fig. 10. The total sum of these synthesized spectra was fitted to the experimental spectrum returning the ratio 18O/16O = 10% and Tr = 5500 K in this experiment. The inset in Fig. 10 displays a portion of the data around the band head (0–1) of Al18O at the expanded intensity scale. The background emission near this isotopic band head consists of series of doublets that belong to the tails of Al16O progression B → X (Δν = 0), the most intense of which are branches P11 and P22 of the band (0–0) despite their very high J-numbers, up to J = 147.5 as seen in the inset of Fig. 10.
 | ||
| Fig. 10 Part of emission B → X (Δν = 0; −1) of Al16O and Al18O formed during ablation of the 18O-enriched Al2O3 pellet. The inset shows an expanded intensity scale around the band head (0–1) of Al18O. Experimental spectra were acquired with a 20 μs delay and averaged over 100 laser pulses. Simulation was based on data from Patrascu et al.28 | ||
Several emission bands of CaO A1Σ+ → X1Σ+ (2–0, 1–0, 0–0, 0–1) were observed within 765–960 nm during ablation of calcite (CaCO3) and calcium chloride (CaCl2) in open air.14 The spectra of the band A1Σ+ → X1Σ+ (1–0) for both Ca18O and Ca16O were measured with IsoPlane-320 by ablating a calcite sample (Fig. 11). For the rare isotope, a Peltier cooler was used to freeze a thin layer of H218O water ice on top of the sample. Argon was flown to displace ambient air. In this case Ca18O radicals were formed by association of Ca from calcite and 18O from surface ice. The spectrum of Ca18O was blended with a lower contribution of Ca16O that originated from calcite itself. The spectrum of the main isotopologue Ca16O was obtained by ordinary ablation of calcite in air. Both spectra were collected using the acquisition gate of 100 μs delayed for 50 μs after ablation.
 | ||
| Fig. 11 Spectra of the A → X (1–0) band of Ca16O and Ca18O during laser ablation of calcite sample. Spectra were acquired with a 50 μs delay and averaged over 100 laser pulses. | ||
Studying the possibilities of the 18O/16O measurements by LAMIS demonstrated that spectra of Al18O, Ca18O and B18O can be used complementary to each other for measuring the ratio of oxygen isotopes. Potential combination of the LIBS and LAMIS techniques in one portable instrument for in-field geological analysis appears possible and beneficial. Such an instrument would alleviate expenses and logistics related to collection, delivery and management of the samples from the field to an analytical laboratory.
7. Chlorine
Bio-mediated alteration of the 37Cl/35Cl ratio is distinctive in microbial reduction of anthropogenic perchlorates, biphenyls, freons and other chlorinated compounds. The values of the 37Cl showed an increasing trend with depth in oil field brines. The diffusion driven isotope fractionation in hydro-geological systems occurs because 35Cl is more mobile than 37Cl. However, the range of variations of chlorine isotopes in natural materials is smaller than the isotopic variation of boron, carbon, nitrogen, and oxygen.Laser ablation of CaCl2 produced emission of the CaCl B2Σ+ → X2Σ+ band progressions with Δν = +1 and Δν = 0 within 579–585 and 585–600 nm respectively. Spectra of CaCl system B2Σ+ → X2Σ+ (Δν = 0) were recorded using two spectrographs (Fig. 12),14 one of which was a 1250 mm Czerny–Turner spectrograph (Horiba JY) and the other one was a compact echelle spectrograph EMU-65 (Catalina Scientific). The natural relative isotopic abundances of chlorine isotopes 37Cl and 35Cl are approximately 24.2% and 75.8%, respectively. The isotopic shifts due to these two isotopes are apparent in the spectra shown in Fig. 12. While the large high-resolution spectrograph recorded a superior spectrum, the compact echelle spectrograph yielded sufficient resolution for LAMIS measurements.
 | ||
| Fig. 12 Spectra of CaCl band progression (B → X; Δν = +1) formed during ablation of natural CaCl2 pellets. Spectra were acquired with a 20 μs delay and averaged over 20 laser pulses. | ||
8. Strontium
Strontium is a relatively abundant element in geological materials with total content up to ∼3000 ppm in marine and magmatic carbonates. Although the major isotopes 88Sr, 87Sr and 86Sr are stable, a continuous increase in 87Sr occurs naturally over time as a result of radioactive β-decay of 87Rb. Therefore, a ratio of Sr isotopes (usually 87Sr/86Sr) is used for age dating in geochronology, oceanography, archaeology, and also as a provenance tracer for defining the origin of historic or forensic samples.Emission of the band system A1Σ+ → X1Σ+ of the isotopologues 88SrO, 87SrO and 86SrO within 780–960 nm was used for LAMIS detection of strontium isotopes (88Sr, 87Sr and 86Sr).29 Spectra of SrO band (2–0) of the A → X system generated from natural material (NIST SRM-987) and isotope-enriched SrCO3 pellets are shown in Fig. 13. A high-resolution Horiba JY-1250M spectrograph resolved all three individual isotopes 86Sr, 87Sr, and 88Sr that were quantified using a set of isotope-enriched standards. Emission from the SRM-987 was a sum of the Sr isotopes with their natural abundances, dominated by 88Sr. Similar spectra of 88SrO and 86SrO of four bands A → X (2–0), (1–0), (0–0), and (0–1) were measured using a compact spectrograph EMU-65 within 820–990 nm.19 The results demonstrated that with an exception of the band (0–0) the isotopic shifts in the other three band heads were from 0.08 to 0.15 nm. The spectra were easily resolvable, particularly in the regions of high rotational quantum numbers J (in the band tails).
 | ||
| Fig. 13 Spectra of the band A → X (2–0) of SrO measured from enriched 88SrCO3, 87SrCO3 and 86SrCO3 samples, and from a NIST (SRM-987) sample with natural isotopic abundance. The signal was normalized to the intensity in the band heads. | ||
An empirical PLSR model was built to calibrate the spectra of SrO transition A1Σ+ → X1Σ+ within the tail region of the band (1–0) between 870–880 nm.29 Calibration was based on a library of total 400 spectra, including 100 spectra collected from each of 4 reference samples. Delay was 10 μs; gate width was 30 μs. Isotopic composition of the SRM-987 was predicted to be 9.8 ± 2.8% (86Sr), 9.1 ± 3.5% (87Sr), and 81.6 ± 3.4% (88Sr). These values were consistent with the certified isotopic abundances of 9.86% (86Sr), 7.00% (87Sr), and 82.58% (88Sr) in the interrogated sample.
Diatomic strontium monohalide radicals formed during ablation of strontium salts (SrF2, SrCl2, SrBr2, and SrI2) in air were also demonstrated to provide spectral signatures for the naturally occurring strontium isotopes. Laser ablation spectrum of B2Σ+ → X2Σ+ transition of SrF between 561–573 nm was measured using a SrF2 pellet as a target.29 A portion of this spectrum (561–564.5 nm) was simulated using the weighted sum of strontium isotopes 88Sr × 0.8258 + 87Sr × 0.07 + 86Sr × 0.0986 + 84Sr × 0.0056 in accordance with their natural abundances. A good agreement between experimental and simulated SrF spectra (no fitting was necessary) illustrated that strontium halide radicals can be used for LAMIS.
Structured materials in industry and highly heterogeneous natural samples in geological studies usually require localized microanalysis. For example, strontium titanate films in memory capacitors are typically ∼20 to ∼250 nm thick, while the grain sizes in strontium ceramics as well as in natural rocks are on the sub-millimeter scale. Surface scanning and depth-profiling are in the realm of commercial LIBS instruments that can be adjusted for lateral resolution of ∼30 μm and depth resolution of ∼20 nm. Similarly, LAMIS instruments can be implemented for rapid isotopic microanalysis.
A possibility was discussed to use LAMIS of strontium isotopes in rocks for radiometric isochron age determination.19,29 The measurement accuracy within ±2% in the 87Rb/86Sr ratio and ±0.2% in the 87Sr/86Sr ratio using LAMIS can result in determination of the geological age of rocks with uncertainty less than ±500 million years. Current age estimates for Mars geological components have uncertainties in billions of years, and validity of these estimates is unknown. There is no other means to make direct age dating measurements on Mars or other planets, but a compact LAMIS instrument for robotic space exploration can be realized.19
9. Zirconium
Zircaloys are used as nuclear reactor core components and cladding materials for nuclear fuels because four stable isotopes 90Zr, 91Zr, 92Zr, 94Zr have low cross-sections of neutron capture, with 90Zr being the lowest neutron absorbent. Rates of fuel burn-up and neutron fluxes can be determined by measuring Zr isotope ratios. Zirconium isotopes are among the products from fission of 235U and 239Pu, and therefore their analysis is important in nuclear forensics.Femtosecond LAMIS of zirconium isotopes was carried out by ablating natural Zr metal and an enriched 94ZrO2 pellet in open air at laser pulse energy 160 μJ and repetition rate 1 kHz.30 The singlet band head E1Σ+ → X1Σ+ (0–1) of ZrO appearing at 381.8 nm and six triplet bands belonging to the transition d3Δ1,2,3 → a3Δ1,2,3 (Δν = 0, ±1) of ZrO within 446–485 nm were observed with the isotopic shifts up to 74 pm in their band heads. Molecular emission from femtosecond ablation peaked at delays about 0.75 μs, while a ratio of molecular to atomic intensities was rising up to delay of ∼3 μs. The band d3Δ3 → a3Δ3 (0–1) was used for Zr isotope determination by fitting simulated spectra to the experimental spectrum at optimized delay 2 μs and gate width 4 μs (Fig. 14). Spectra were recorded with spectrograph JY-1250M accumulating 5000 ablation pulses as a single measurement with total acquisition time 5 s at 1 kHz.
 | ||
| Fig. 14 Experimental and fitted synthetic spectra of ZrO d3Δ3 → a3Δ3 (0–1) during femtosecond ablation of Zr metal sample. Simulation also includes an atomic line of Zr at 482.804 nm. Laser pulse duration was 500 fs at operating wavelength 343 nm and repetition rate 1 kHz. | ||
The ratios of four Zr isotopes derived as a proportion 90Zr/91Zr/92Zr/94Zr were the following (2.93 ± 0.08)/(0.47 ± 0.03)/(1.16 ± 0.06)/1. Experimental uncertainties were determined from 10 replicates. These ratios corresponded reasonably well to the proportion of natural isotopic abundances for zirconium: 2.96/0.65/0.99/1. The discrepancies were attributed to unavailable data about perturbations and hyperfine splitting in ZrO energy levels that precluded more accurate simulation of the spectra. Nevertheless, feasibility was demonstrated of obtaining semi-quantitative isotopic information without isotopic standards for an element with a complex emission spectrum, such as zirconium.
At low laser pulse energy, the femtosecond ablation plasma was cooler than that from usual nanosecond ablation. This resulted in the enhanced rates for association of free atoms into molecules (ideally, after complete atomization of the ablated material) versus corresponding rates of molecular association in nanosecond laser plasmas. At the same laser irradiance delivered on a surface of the zirconium sample, LAMIS signal from femtosecond ablation was 6-fold stronger than that from nanosecond ablation.
A demonstration of the remotely excited LAMIS at distances of 5 to 7.8 m between a laser beam focusing lens and the analyzed sample surface was recently presented.8 This new technique combined a self-focused propagating laser beam through a contracted plasma channel (filament) in open air and the detection method by LAMIS. The technique was named as Femtosecond Filament-induced Laser Ablation Molecular Isotopic Spectrometry (F2-LAMIS). A femtosecond laser pulse with high irradiance can initiate nonlinear refractive index effects in air causing the laser beam to establish a plasma filament with a dynamic balance of energy that allows propagation over long distances.31 Thus, F2-LAMIS can remotely ablate the sample to enable the all-optical isotopic measurements.
Hou et al.8 generated filaments using a Ti:sapphire laser with wavelength of 800 nm, pulse duration 100 fs and energy 7 mJ per pulse at a repetition rate 10 Hz. The laser filaments propagated over several meters before impinging on a Zr metal plate. Isotope-specific molecular emission of ZrO at the band d3Δ3 → a3Δ3 (0–1) within 482.6–483 nm was collected using a lens coupled to an optical fiber, both of which were directly mounted on the sample base to keep identical light collection conditions for different filament propagation distances. Spectra were measured using spectrograph JY-1250M and averaged over 500 pulses. The ICCD delay was set at 3 μs, while gate width was 20 μs. The proportion of zirconium isotopes 90Zr/91Zr/92Zr/94Zr was deduced as 2.5/0.35/1.15/1 by fitting simulated spectra to the experimental. These deduced ratios deviated from the true isotopic composition of the sample, but remained unaffected by a filament propagation distance within a range tested. These results indicated minimal influence of the filament propagation distance on isotopic quantification. More accurate analysis can be expected with the use of reference standards for calibration.
10. Conclusion
LAMIS has been demonstrated for rapid optical analysis of isotopes of hydrogen, boron, carbon, nitrogen, oxygen, chlorine, strontium, and zirconium. Advantages of this technique include the ability to measure isotope abundance with a low-resolution spectrograph. Solid samples can be directly analyzed in their original unaltered condition, without preparation. Gases, vapors, aerosols, and liquids can be analyzed as well. Isotopic depth profiling, two- and three-dimensional mapping are possible. Quantitative measurements have been realized using multivariate regression models that relate the spectral intensities of the isotope-specific molecular spectra to the original abundances of isotopes in the sample. This calibration is based on measuring spectra of known reference samples. In contrast, standardless quantification has been achieved by fitting a simulated sum of the spectra of the relevant isotopologues to the experimental emission spectra.High precision and accuracy of LAMIS was demonstrated for the natural 10B/11B ratio that was determined within relative uncertainty 9‰ for the statistical confidence interval 95%. This level of precision competes favorably with conventional mass spectrometric techniques. LAMIS can be especially advantageous for measuring isobaric masses (e.g., 12C16O versus14N2 or 87Sr versus87Rb) because low-resolution mass spectrometers cannot discriminate them. Accuracy of LAMIS depends on the quality and homogeneity of the reference standards or the quality of spectral simulation. Abundances of individual isotopes in material composition have been measured at least down to atomic fraction ∼1%. Simultaneous determination of isotopes of different elements was shown to be physically possible, while determination of several isotopes of the same element was successfully demonstrated (Sr, Zr).29,30
Introduction of the femtosecond LAMIS indicated further prospects for improving accuracy and sensitivity in this technique.8,20,30 With their relatively low pulse energy at high peak power, the femtosecond pulses do not significantly heat up the sample, and therefore a probability of vaporizing some of the intact native molecular fragments directly from the sample surface should be greatly diminished. Femtosecond ablation should facilitate complete atomization of the ablated material, thus reducing chances for unwanted fractionation effects. As a result, a degree of isotopic equilibration in the plasma plume, and thus accuracy of LAMIS measurements should be improved. However, further research is necessary because of already known examples of incomplete atomization even in the femtosecond regime of ablation. Femtosecond LAMIS was demonstrated with or without gated ICCD registration. Intensity of molecular emission produced by femtosecond ablation was found enhanced relative to that of atomic emission. Double-pulse LAMIS was shown to increase sensitivity and a signal-to-noise ratio of the measurements.9
Similarly to the second laser pulse in the double-pulse technique that provides additional energy to the ablation plasma, a possible alternative in the LAMIS development is a combination of laser ablation with a secondary plasma excitation. The secondary excitation coupled to LIBS has a long history and has been shown as an effective means to boost sensitivity of the analysis. Examples include microwave,32–34 glow discharge,35,36 radiofrequency torch,37 spark38–44 and arc45 as the sources of the secondary excitation. Relative to the single-pulse ablation, a longer sustained plasma at lower temperature ought to be productive in the enhanced formation of molecules in their excited emitting states.
Sensitivity and resolution of LAMIS can be significantly improved at a relatively low cost by replacing emission with enhanced diode laser absorption (e.g., cavity ring-down spectroscopy or cavity enhanced absorption spectroscopy) as a spectrum registration method.19 A similar technique is being developed for atomic uranium isotopes.46,47 Furthermore, laser ablation followed with detection of molecular radicals by laser induced fluorescence can present a very sensitive analytical technique for the isotopic measurements. Laser induced fluorescence spectra are usually simpler and can be significantly more intense compared to spontaneous emission. The later possibility has been recently explored for the detection of 10BO and 11BO in laser ablation plasma.48 Both absorption and fluorescence techniques have a common benefit of probing the gas-phase molecules in the late and quenched plasma (dark, cold, equilibrated) when all molecular excited states decay to their ground states, strongly reducing any interfering emission background.
The recently introduced F2-LAMIS technology revealed an ability to ablate the sample remotely from a long distance. In general, femtosecond laser filaments are known to propagate in air up to a range of several kilometers. A combination of filament-induced ablation from a distance with remote detection of laser induced molecular fluorescence can eventually establish a new sensitive analytical technique for the long-distance isotopic measurements. Thus far, the standoff nanosecond LIBS measurements were demonstrated at a distance up to 120 m using a 400 mm aperture telescope to collect emission from the ablation plasma.49 Similar standoff measurements are conceivably possible using F2-LAMIS with a large telescope. However, laser induced fluorescence can be more intense than spontaneous emission, therefore reducing the requirements on the size of the telescope.
Acknowledgements
This work was funded by NASA SBIR program through the Contract No. NNX14CA03C granted to Applied Spectra, Inc. The work at the Lawrence Berkeley National Laboratory was supported by the Defense Nuclear Nonproliferation Research and Development Office and the Office of Basic Energy Sciences of the U.S. Department of Energy under contract number DE-AC02-05CH11231.References
- D. A. Cremers and L. J. Radziemski, Handbook of Laser-Induced Breakdown Spectroscopy, John Wiley, 2nd edn, 2013 Search PubMed.
- D. M. Wong, A. A. Bol'shakov and R. E. Russo, Laser Induced Breakdown Spectroscopy, in Encyclopedia of Spectroscopy and Spectrometry, ed. J. Lindon, G. Tranter and D. Koppenaal, Academic Press, 2nd edn, 2010, pp. 1281–1287 Search PubMed.
- D. W. Hahn and N. Omenetto, Laser-induced breakdown spectroscopy (LIBS), part II: review of instrumental and methodological approaches to material analysis and applications to different fields, Appl. Spectrosc., 2012, 66, 347–419 CrossRef CAS PubMed.
- Laser-Induced Breakdown Spectroscopy. Theory and Applications, ed. S. Musazzi and U. Perini, Springer, 2014 Search PubMed.
- Laser-Induced Breakdown Spectroscopy, ed. J. Singh and S. Thakur, Elsevier, 2007 Search PubMed.
- Laser-Induced Breakdown Spectroscopy (LIBS). Fundamentals and Applications, ed. A. W. Miziolek, V. Palleschi and I. Schechter, Cambridge University Press, 2006 Search PubMed.
- R. E. Russo, A. A. Bol'shakov, X. Mao, C. P. McKay, D. L. Perry and O. Sorkhabi, Laser ablation molecular isotopic spectrometry, Spectrochim. Acta, Part B, 2011, 66, 99–104 CrossRef.
- H. Hou, G. C.-Y. Chan, X. Mao, R. Zheng, V. Zorba and R. E. Russo, Femtosecond filament-laser ablation molecular isotopic spectrometry, Spectrochim. Acta, Part B, 2015, 113, 113–118 CrossRef CAS.
- X. Mao, A. A. Bol'shakov, D. L. Perry, O. Sorkhabi and R. E. Russo, Laser ablation molecular isotopic spectrometry: parameter influence on boron isotope measurements, Spectrochim. Acta, Part B, 2011, 66, 604–609 CrossRef CAS.
- G. Herzberg, Molecular Spectra and Molecular Structure. I. Spectra of Diatomic Molecules, Van Nostrand, New York, 2nd edn, 1950 Search PubMed.
- K. P. Huber and G. Herzberg, Molecular Spectra and Molecular Structure. VI. Constants of Diatomic Molecules, Van Nostrand, New York, 1979 Search PubMed.
- C. G. Parigger, A. C. Woods, D. M. Surmick, G. Gautama, M. J. Witte and J. O. Hornkohl, Computation of diatomic molecular spectra for selected transitions of AlO, CN, C2, and TiO, Spectrochim. Acta, Part B, 2015, 107, 132–138 CrossRef CAS.
- A. Sarkar, X. Mao, G. C.-Y. Chan, V. Zorba and R. E. Russo, Laser ablation molecular isotopic spectrometry of water for 1D2/1H1 ratio analysis, Spectrochim. Acta, Part B, 2013, 88, 46–53 CrossRef CAS.
- A. A. Bol'shakov, X. Mao, D. L. Perry and R. E. Russo, Laser ablation molecular isotopic spectrometry for rare isotopes of the light elements, Spectroscopy, 2014, 29(6), 30–39 Search PubMed.
- J. Serrano, J. Moros and J. J. Laserna, Exploring the formation routes of diatomic hydrogenated radicals using femtosecond laser-induced breakdown spectroscopy of deuterated molecular solids, J. Anal. At. Spectrom., 2015, 30, 2343–2352 RSC.
- J. Luque and D. R. Crosley, LIFBASE: Database and spectral simulation program, SRI International Report MP 99–009, 1999 Search PubMed.
- H. Niki, T. Yasuda and I. Kitazima, Measurement technique of boron isotopic ratio by laser-induced breakdown spectroscopy, J. Nucl. Sci. Technol., 1998, 35, 34–39 CrossRef CAS.
- A. Sarkar, X. Mao and R. E. Russo, Advancing the analytical capabilities of laser ablation ablation molecular isotopic spectrometry for boron isotopic analysis, Spectrochim. Acta, Part B, 2014, 92, 42–50 CrossRef CAS.
- A. A. Bol'shakov, X. Mao, C. P. McKay and R. E. Russo, Laser ablation – optical cavity isotopic spectrometer for Mars rovers, Proc. SPIE, 2012, 8385, 83850C CrossRef.
- B. Yee, K. C. Hartig, P. Ko, J. McNutt and I. Jovanovic, Measurement of boron isotopic ratio with non-gated molecular spectroscopy of femtosecond laser-produced plasma, Spectrochim. Acta, Part B, 2013, 79–80, 72–76 CrossRef CAS.
- P. Ko and I. Jovanovic, Boron isotopic measurements from spectrally filtered non-gated molecular spectra induced by laser ablation, Spectrochim. Acta, Part B, 2013, 90, 68–71 CrossRef CAS.
- S. Brown, A. Ford, C. C. Akpovo, J. Martinez and L. Johnson, Matrix effects in laser ablation molecular isotopic spectrometry, Spectrochim. Acta, Part B, 2014, 101, 204–212 CrossRef CAS.
- C. G. Parigger, J. O. Hornkohl, A. M. Keszler and L. Nemes, Measurement and analysis of atomic and diatomic carbon spectra from laser ablation of graphite, Appl. Opt., 2003, 42, 6192–6198 CrossRef CAS PubMed.
- M. Dong, G. C.-Y. Chan, X. Mao, J. J. Gonzalez, J. Lu and R. E. Russo, Elucidation of C2 and CN formation mechanisms in laser-induced plasmas through correlation analysis of carbon isotopic ratio, Spectrochim. Acta, Part B, 2014, 100, 62–69 CrossRef CAS.
- R. Glaus, J. Riedel and I. Gornushkin, Insight into the formation of molecular species in laser-induced plasma of isotopically labeled organic samples, Anal. Chem., 2015, 87, 10131–10137 CrossRef CAS PubMed.
- M. Dong, X. Mao, J. J. Gonzalez, J. Lu and R. E. Russo, Carbon isotope separation and molecular formation in laser-induced plasmas by Laser Ablation Molecular Isotopic Spectrometry, Anal. Chem., 2013, 85, 2899–2906 CrossRef CAS PubMed.
- A. A. Bol'shakov, X. Mao, J. Jain, D. L. McIntyre and R. E. Russo, Laser ablation molecular isotopic spectrometry of carbon isotopes, Spectrochim. Acta, Part B, 2015, 113, 106–112 CrossRef.
- A. T. Patrascu, S. N. Yurchenko and J. Tennyson, ExoMol molecular line lists – IX. The spectrum of AlO, Mon. Not. R. Astron. Soc., 2015, 449, 3613–3619 CrossRef.
- X. Mao, A. A. Bol'shakov, I. Choi, C. P. McKay, D. L. Perry, O. Sorkhabi and R. E. Russo, Laser ablation molecular isotopic spectrometry: strontium and its isotopes, Spectrochim. Acta, Part B, 2011, 66, 767–775 CrossRef CAS.
- H. Hou, G. C.-Y. Chan, X. Mao, V. Zorba, R. Zheng and R. E. Russo, Femtosecond laser ablation molecular isotopic spectrometry for zirconium isotope analysis, Anal. Chem., 2015, 87, 4788–4796 CrossRef CAS PubMed.
- S. L. Chin, Femtosecond Laser Filamentation, Springer Series on Atomic, Optical, and Plasma Physics, Springer, 2010, vol. 55 Search PubMed.
- A. Ciocan, J. Uebbing and K. Niemax, Analytical application of the microwave induced plasma used with laser ablation of solid samples, Spectrochim. Acta, Part B, 1992, 47, 611–617 CrossRef.
- Y. Liu, B. Bousquet, M. Baudelet and M. Richardson, Improvement of the sensitivity for the measurement of copper concentrations in soil by microwave-assisted laser-induced breakdown spectroscopy, Spectrochim. Acta, Part B, 2012, 73, 89–92 CrossRef CAS.
- M. Tampo, M. Miyabe, K. Akaoka, M. Oba, H. Ohba, Y. Maruyama and I. Wakaida, Enhancement of intensity in microwave-assisted laser-induced breakdown spectroscopy for remote analysis of nuclear fuel recycling, J. Anal. At. Spectrom., 2014, 29, 886–892 RSC.
- C. D. Quarles Jr, J. Gonzalez, I. Choi, J. Ruiz, X. Mao, R. K. Marcus and R. E. Russo, Liquid sampling-atmospheric pressure glow discharge optical emission spectroscopy detection of laser ablation produced particles: a feasibility study, Spectrochim. Acta, Part B, 2012, 76, 190–196 CrossRef.
- B. T. Manard, J. J. Gonzalez, A. Sarkar, M. Dong, J. Chirinos, X. Mao, R. E. Russo and R. K. Marcus, Liquid sampling-atmospheric pressure glow discharge as a secondary excitation source: assessment of plasma characteristics, Spectrochim. Acta, Part B, 2014, 94–95, 39–47 CrossRef CAS.
- J. D. Pedarnig, J. Heitz, E. R. Ionita, G. Dinescu, B. Praher and R. Viskup, Combination of RF-plasma jet and laser-induced plasma for breakdown spectroscopy analysis of complex materials, Appl. Surf. Sci., 2011, 257, 5452–5455 CrossRef CAS.
- H. Moenke and L. Moenke-Blankenburg, Laser Micro-Spectrochemical Analysis, Hilger, London, 1973 Search PubMed.
- O. A. Nassef and H. E. Elsayed-Ali, Spark discharge assisted laser induced breakdown spectroscopy, Spectrochim. Acta, Part B, 2005, 60, 1564–1572 CrossRef.
- V. S. Burakov, V. V. Kiris and S. N. Raikov, Optimization of conditions for spectral determination of chlorine content in cement-based materials, J. Appl. Spectrosc., 2007, 74, 321–327 CrossRef CAS.
- M. V. Belkov, V. S. Burakov, A. de Giacomo, V. V. Kiris, S. N. Raikov and N. V. Tarasenko, Comparison of two laser-induced breakdown spectroscopy techniques for total carbon measurement in soils, Spectrochim. Acta, Part B, 2009, 64, 899–904 CrossRef.
- Y. Chen, Q. Zhang, G. Li, R. Li and J. Zhou, Laser ignition assisted spark-induced breakdown spectroscopy for the ultra-sensitive detection of trace mercury ions in aqueous solutions, J. Anal. At. Spectrom., 2010, 25, 1969–1973 RSC.
- W. Zhou, K. Li, X. Li, H. Qian, J. Shao, X. Fang, P. Xie and W. Liu, Development of a nanosecond discharge-enhanced laser plasma spectroscopy, Opt. Lett., 2011, 36, 2961–2963 CrossRef CAS PubMed.
- W. Zhou, K. Li, H. Qian, Z. Ren and Y. Yu, Effect of voltage and capacitance in nanosecond pulse discharge enhanced laser-induced breakdown spectroscopy, Appl. Opt., 2012, 51, B42–B48 CrossRef CAS PubMed.
- S. Eschlböck-Fuchs, P. J. Kolmhofer, M. A. Bodea, J. G. Hechenberger, N. Huber, R. Rössler and J. D. Pedarnig, Boosting persistence time of laser-induced plasma by electric arc discharge for optical emission spectroscopy, Spectrochim. Acta, Part B, 2015, 109, 31–38 CrossRef.
- B. A. Bushaw and N. C. Anheier, Isotope ratio analysis on micron-sized particles in complex matrices by Laser Ablation-Absorption Ratio Spectrometry, Spectrochim. Acta, Part B, 2009, 64, 1259–1265 CrossRef.
- N. R. Taylor and M. C. Phillips, Differential laser absorption spectroscopy of uranium in an atmospheric pressure laser-induced plasma, Opt. Lett., 2014, 39, 594–597 CrossRef CAS PubMed.
- L. Nagli and M. Gaft, Combining laser-induced breakdown spectroscopy with molecular laser-induced fluorescence, Appl. Spectrosc., 2015, Search PubMed in print.
- J. J. Laserna, R. F. Reyes, R. González, L. Tobaria and P. Lucena, Study on the effect of beam propagation through atmospheric turbulence on standoff nanosecond laser induced breakdown spectroscopy measurements, Opt. Express, 2009, 17, 10265–10276 CrossRef CAS PubMed.
| This journal is © The Royal Society of Chemistry 2016 |