Determination of 22 trace elements in high-purity copper including Se and Te by ETV-ICP OES using SF6, NF3, CF4 and H2 as chemical modifiers
J.
Hassler
*a,
R.
Matschat
b,
S.
Richter
b,
P.
Barth
c,
A. K.
Detcheva
d and
H.-J.
Waarlo
e
aIfenstr. 16, D-87471 Durach, Germany. E-mail: juergen_hassler@t-online.de
bBAM, Federal Institute for Material Research and Testing, Richard-Willstätter Str. 11, D-12489 Berlin, Germany
c3MTechnical Ceramics Kempten, Zweigniederlassung der 3M Deutschland GmbH, Max-Schaidhauf-Strasse 25, 87437, Kempten, Germany
dInstitute of General and Inorganic Chemistry, Bulgarian Academy of Sciences, Acad. G. Bonchev Str., Bl 11, BG-1113 Sofia, Bulgaria
eSPECTRO Analytical Instruments GmbH, Boschstrasse 10, 47533 Kleve, Germany
First published on 14th December 2015
Abstract
In supplementary work to the one published earlier, experiments with SF6, NF3, CF4 and H2 as new modifier gases for the matrix studied were performed. Our investigations were continued to improve the described analytical method and to achieve additional insights into the mechanism of analyte release. Our new survey is split in two parts. At first fluorinating modifiers were used to investigate the behaviour of a variety of trace elements (Ag, Al, As, Au, Bi, Cd, Co, Cr, Fe, Mg, Mn, Ni, P, Pb, Sb, Se, Si, Sn, Te, Ti, Zn and Zr). Most of them (exceptions Au, Se, and Te) could be effectively released from the copper matrix by thermo-halogenation reactions and by partial sub-sample evaporation. Using SF6 and NF3 as modifier gases, low limits of quantification (LOQs) were achieved for the 19 well released trace elements (typical ≤0.1 mg kg−1). Most elements (exceptions Ag, Mg, and Ni) could be calibrated by using aqueous calibration solutions without any sample pretreatment. For the trace determination of Se, Te, and Au, a further analytical method of ETV-ICP OES is described in the second part based on thermo-hydrogenation reactions by using a hydrogen/argon mixture as a modifier gas. The determination of Se and Te with very high analytical performance (LOQ < 0.1 mg kg−1) can either be carried out in a second analytical step succeeding the halogenation procedure, or the sub-sample is directly treated with H2 without previous halogenation procedure whereby the sub-sample can either be partially or totally evaporated. In this case some other analytes (Ag, Au, As, Bi, Cd, Fe, Mg, Ni, Pb, Sb, Sn, and Zn) can additionally be quantified simultaneously with Se and Te.
Introduction
An increasing demand for high-purity copper in various fields is dominating the market, especially in microelectronics2 and other fields of modern technology.3–6 Even low levels of impurities can negatively influence its electrical conductivity and many other important physical properties. Particularly the importance of traces of Se and Te made their determination the subject of this paper. The ability to produce high-purity copper is directly linked to the availability of sensitive and efficient analytical methods. Different analytical methods were discussed7 and compared8 in the past to determine the degree of purity of copper materials including the determination of all traces in a primary copper reference material.9Direct solid sampling methods for multi-element determination
In metallurgical production direct and automatable analytical methods are preferred. Already in early times “arc spectral analysis” was used for copper trace analysis.10–13 The spectral analysis of pure copper by the globule arc technique was summarized by MAASEN.14,15 Its performance was further developed by different authors.11,16,17 TYMCHUK18,19 reported on the enhancement of emission signals by solid halogenating substances. Different authors reported on the positive analytical effect of using oxidized sub-sample surfaces.20,21 The globule arc technique combined with modern spectrometers7 is still in use. With this technique Mahar22et al. achieved very high analytical performance.Analytical procedures of copper analysis using spark-OES23 and X-ray fluorescence spectrometry (XRF),24,25 respectively, were standardized as European standards, even though their detection power, especially of XRF, is limited. This also applies to glow discharge optical emission spectrometry (GD-OES),26 but its sensitivity can be improved using the hollow cathode effect.27 The very sensitive glow discharge mass spectrometry (GD-MS)28 can be calibrated by synthetic calibration samples29–32 but needs a high-cost instrumentation. Nuclear analytical methods33 such as instrumental neutron activation analysis (INAA) or activation analysis with high-energy photons (PAA) as well as XRF with synchrotron radiation (SY-XRF)34 are specialized and expensive methods mainly restricted to research institutes. Laser ablation inductively coupled plasma mass spectrometry (LA-ICP-MS) is gaining importance in the metallurgical field35–39 because of its high sensitivity, but its use for routine bulk analysis of pure metals is currently not state of the art because its robustness was not widely demonstrated up to now.
Methods with chemical decomposition of the samples
The drawbacks of wet-chemical methods are well known (time need, risk of losses, contamination, etc.). But the preparation of matrix adapted calibration solutions is much easier than the production of appropriate solid calibration samples.Atomic absorption spectrometry (AAS)40 has very high selectivity and high precision, but is a sequential mono-elemental method (exception HR-CS AAS). Flame AAS (F-AAS) is very robust, but matrix separation can be necessary.41 Electro-thermal atomization AAS (ET-AAS) can be used for trace determination in high-purity copper.42–44 Inductively coupled plasma optical emission spectrometry (ICP OES) and ICP-MS are mostly accepted analytical methods for the multielement trace determination in solutions of decomposed pure metals. ICP OES was used for pure copper45,46 also combined with the hydride generation technique.47 The capability of HR-ICP-MS for multielement trace determination in high purity copper was investigated35,36,48,49 and compared with those of ICP-MS and ICP OES.50,51 Extremely accurate results were achieved combining the isotope dilution technique with ICP-MS (ID ICP-MS).52–54 Total reflexion X-ray fluorescence (TXRF) spectrometry was used for trace analysis87 of high-purity copper in combination with electrolytic removal of the copper matrix.
Basic consideration of the ETV-ICP OES method for copper
The globule arc technique and the use of halogenating substances lead to our idea to investigate the usability of ETV-ICP OES for the analysis of pure copper combined with the application of halogenating gases.Main advantages of ETV-ICP OES compared to the DC arc techniques are the superior precision and trueness and that chemical modifiers, mostly halocarbons, can be used easily and effectively. Additionally the use of autosamplers of ETV systems is a very important aspect for routine analysis. In the past many different matrices were successfully analyzed by ETV-ICP OES, biological samples,55,56,88,89 soil, sediments,57,90 ceramic materials58–63 refractory metals64 and coal.91 As shown in the first part of our publication to avoid strong matrix load in the ICP plasma only a small part of the Cu matrix is evaporated under the optimized conditions (about 0.1 to 0.4 mg of a 20 mg sample). In our first paper we considered effects described in the literature20,21,65,66 of the globule arc technique concerning the significant and positive influence of oxygen or of an oxide layer at the sub-sample surface on the analytical performance. The usage of halogenating gases in ETV was described before only for matrices other than copper.55,56,59,60,67-71,88-91 In our current work an improved method was developed based on the first satisfying results of our previous investigation.1
Basic considerations for further development of our method
The efficient analytical method developed in our previous work1 based on the application of CHF3 as a modifier gas showed some limitations and problems summarized here. With the development of the new method they were considered or tried to overcome:(1) The necessity to apply a “roasting” (surface oxidizing) procedure as a preliminary sample preparation step to guarantee trustable results.
(2) Not all analytes could be calibrated by using dried amounts of calibration solutions, which would be of metrological and practical advantage.
(3) Some elements could not (Se and Te) or not sufficiently (Ag, Mg, and Ni) be released from the matrix by halogenation reactions and could therefore not (or only limited) be determined and quantified.
At first, the modifiers SF6, NF3 and CF4 were used as alternatives to halocarbons for the first time in ETV-ICP OES. They were studied concerning the items (1) and (2). Subsequently, our investigations were mainly focussed on item (3). H2 was added in defined concentrations to Ar to release Se and Te from the matrix by thermo-hydride formation. In this frame several other analytes were also investigated.
Experimental
Instrumentation and working parameters
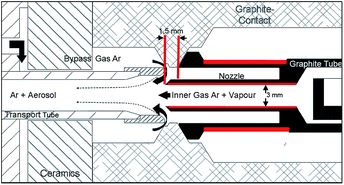
For sample introduction electrothermal vaporization units (ETV 4050 A, Spectral Systems, Fürstenfeldbruck, Germany) were used. The set-up of the ETV system in detail is shown in Fig. 1 of our previous work.1 For higher amounts of evaporated copper, especially arising with H2 as a modifier, the ETV configuration was modified (see Fig. 1, red marked parts) by shortening the outside part (from 3.5 mm to 1.5 mm) and by increasing the inner diameter of the nozzle (from 2 mm to 3 mm) as well as by reducing the wall thickness of the outer graphite tube at the side of the nozzle (from 1.0 mm to 0.6 mm). The changes led to higher temperatures of the graphite tube near the nozzle and thus to higher nozzle temperatures at its end mainly caused by radiation transfer (an increase of 200 °C–300 °C was measured at the end of the nozzle). The long-term stability of the ETV unit could be increased by two times (up to 60 measurements) and potential depositions resulting from the matrix or from decomposition products (carbon) of the modifier gases dropped by more than half. The temperature control of the furnace was performed by using a built-in optical pyrometer. The flow rates for inner-gas, bypass-gas and modifier-gas were mass-flow controlled. The ETV system was equipped with a 50-fold autosampler. The synchronization of the ETV system and the spectrometers was realized by using a software integrated handshake signal. For drying of aqueous element solutions a drying device (T/IR 250, Spectral Systems, Fürstenfeldbruck, Germany) was used. For all relevant technical data see Table 1.
| Apparatus | Parameter | SPECTRO ARCOS | IRIS ADVANTAGE |
|---|---|---|---|
| a Investigations were carried out by using two different ARCOS spectrometers only differing in (a) radial observation (side on plasma SOP) or (b) axial observation (end on plasma EOP). b Relevant only for the second part of this publication. c () determined optimum range. | |||
| OES | Mounting | Paschen Runge | Echelle |
| Focal length/mm | 750 | 381 | |
| Grating/grooves mm−1 | 2 × 3600, 1 × 1800 | 60 | |
| Wavelength range/nm | 130–770 (first order) | 175–1000 | |
| Detector | 32 CCD arrays | CID chip | |
| Number of pixels | 32 × 3648 | 512 × 512 | |
| Dispersion/nm per pixel | at 130 to 340 nm 0.0030 | at 200 nm 0.0035 | |
| Plasma observation | (a) Radial (SOP) | Only axial used | |
| (b) Axial (EOP)a | |||
| ICP | ICP plasma RF-power/W | 1500 | 1150 |
| Coolant gas flow rate/L min−1 | 15 | 14 | |
| Auxiliary gas flow rate/L min−1 | 1.3 | 1 | |
| Aerosol gas flow rate/L min−1 | 0.55 | 0.52 | |
| Inner diameter of alumina injector tube/mm | 1.5 | 1.5 | |
| ETV | Length of PTFE transport tube/mm | ca. 400 | ca. 450 |
| Inner diameter of transport tube/mm | 4 | 4 | |
| Inner-gas flow rate/L min−1 | 0.15 | 0.14 | |
| Bypass gas flow rate/L min−1 | 0.4 | 0.38 | |
| Modifier gas flow/mL min−1 | |||
| For SF6 | 1.2 (0.8–1.2)c | 1.2 (0.8–1.2)c | |
| For NF3 | 2.7 (2.5–3.0)c | 2.7 (2.5–3.0)c | |
| For CF4 | 2.4 (not determined)c | 2.4 (not determined)c | |
| For H2/Ar mixture (0–30 vol% H2) (optimum 28 vol%)b | See inner-gas flow rate | See inner-gas flow rate | |
| Shape of graphite sample boat | Modified globule type boat as shown in Fig. 2b of our previous work1 | ||
| Step | T-program standard (TP-stand) | T-program const. ramp (TP-ramp) | T-program plateau (TP-plat) | T-program part. evap. (TP-part) | T-program tot. evap. (TP-tot) | |||||
|---|---|---|---|---|---|---|---|---|---|---|
| Time/s | Temp/°C | Time/s | Temp/°C | Time/s | Temp/°C | Time/s | Temp/°C | Time/s | Temp/°C | |
| a RT = room temperature. b Ramp time (rt) and end temperature (ET) depending on the experiment (e.g. rt = 140 s and ET = 2300 °C). | ||||||||||
| Start | 0 | RTa | 0 | RTa | 0 | RTa | 0 | RTa | 0 | RTa |
| Ramp 1 | 13 | RT → 480 | 15 | RT → 400 | 10 | RT → 650 | 10 | RT → 500 | 10 | RT → 700 |
| Hold 1 | 12 | 480 | 10 | 400 | 15 | 650 | 10 | 500 | 0 | 700 |
| Ramp 2 | 7 | 480 → 1200 | rtb | 400 → ETb | 3 | 650 → 1200 | 10 | 500 → 1200 | 10 | 700 → 1100 |
| Hold 2 | 0 | 1200 | 10 | ETb | 27 | 1200 | 0 | 1200 | 0 | 1100 |
| Ramp 3 | 8 | 1200 → 1500 | 20 | Cooling | 20 | Cooling | 10 | 1200 → 1750 | 10 | 1100 → 1600 |
| Hold 3 | 0 | 1500 | 0 | 1750 | 0 | 1600 | ||||
| Ramp 4 | 10 | 1000 → 1630 | 2 | 1750 → 2250 | 3 | 1600 → 2400 | ||||
| Hold 4 | 0 | 1630 | 0 | 2250 | 0 | 2400 | ||||
| Ramp 5 | 20 | Cooling | 4 | 2250 → 2300 | 27 | 2400 → 2600 | ||||
| Hold 5 | 0 | 2300 | 0 | 2600 | ||||||
| Ramp 6 | 20 | Cooling | 20 | Cooling | ||||||
All reagents were of high purity. HNO3 (Merck, Darmstadt, Germany) was distilled under sub-boiling conditions in a PFA sub-boiling system. Ultrapure water (18.2 MΩ) was obtained from a Milli-Q-Plus system (Millipore, Schwalbach, Germany). The aqueous stock solutions were prepared from pure metals (Alfa Johnson Matthey, Karlsruhe, Germany) or from materials of the National Primary Standards for Elemental Analysis certified by BAM.16 To stabilize the final calibration solutions, 2 mL sub-boiled HNO3 per 100 mL were added.
As pure copper materials six certified reference materials BAM-M381, BAM-M382, ERM®-EB383, ERM®-EB384, ERM®-EB385, and BCR 074 were used. All information and mass fractions of impurities of CRMs used are available in their certificates.72,73 The sub-sample masses of CRMs were chosen in a range of about 5 mg–40 mg, according to their analyte mass fractions and depending on the analytical technique used.
Results and discussion
General remarks
To compare signal intensities of spectral lines between copper CRMs and aqueous element solutions the different absolute analyte masses of their sub-samples were taken into account via the peak area of background corrected transient signals (intensities versus time curves). These signal intensities are assumed to correspond with the release behaviour of the analytes from the copper sub-samples. For better visualization in the figures only a representative selection of elements is shown. Therefore the number of analytes and their selection are different in the different figures.The time interval of measurement was determined and, if necessary individually fixed for each analyte starting about 1 s before first appearance and ending about 1 s after disappearence of spectral line intensity of the respective spectral line. Thus the optimum signal to background ratios (SBRs) could be achieved.
All time resolved measurements were carried out using specific excel-sheets basing on ASCII raw data recorded by using the spectrometer.
Halogenating modifier gases
Fig. 2 gives an impression of the different release behaviour of the copper matrix material (ca. 0.2 mg to 0.4 mg) from sub-samples (ca. 20 mg). From the observed release behaviour it can be concluded that SF6 and NF3 are decomposed in an Ar atmosphere generating reactive fluorine gas and/or other reactive decomposition products at much lower temperatures than CF4. This holds for CF4 independent from the surface state of the sub-samples (unoxidized or oxidized state after “roasting” at 400 °C in air for 30 min in a muffle furnace). However the signal of the “roasted” sub-sample achieves clearly higher values than the one arising from the unprepared sub-sample, whereas a comparable significant effect was not found for SF6 and NF3. This may be a first declaration for different release behaviour of roasted and not roasted copper samples using CF4. The differences between the copper signals determined for the modifiers SF6 and NF3, respectively, could be explained by the different reactivity of sulphur and nitrogen. The very low copper signal using no modifier is clear evidence of the reactivity of the modifiers with the matrix and therefore also for most of the analytes having a similar chemical reactivity with halogens. From this fact the necessity of using the modifiers in the analytical process can be concluded. The reproducible significant intensity drop-off measured for SF6 and NF3 between about 1500 °C and 1600 °C was not a consequence of a special boiling behaviour of the sample material but rather of chemical reactions between the modifier constituents and the copper material depending on the reaction temperature. As observed by additional measurements this drop-off is independent of purity grade of copper samples.
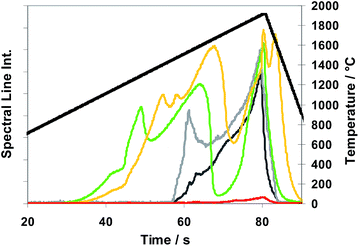 | ||
Fig. 2 Spectral line intensities of copper using CRM ERM®-EB385 (20 mg ± 1 mg) with modifier gases SF6 , NF3 , NF3 , CF4 , CF4 , and CF4 sub-sample oxidized (roasted) , and CF4 sub-sample oxidized (roasted)  and without modifier gas and without modifier gas  ; temperature T versus time ; temperature T versus time  , according to the temperature program “TP-ramp” of Table 2, for gas flow rates see Table 1. , according to the temperature program “TP-ramp” of Table 2, for gas flow rates see Table 1. | ||
In Fig. 3 the release behaviour of 11 analytes as well as that of Cu measured in sub-samples of the CRM ERM®-EB385 in unoxidized state of surface is depicted exemplarily using NF3 as a modifier gas.
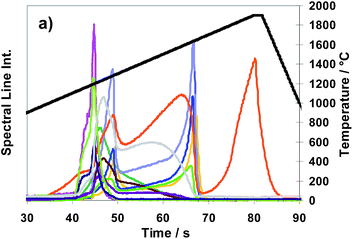 | ||
Fig. 3 Spectral line intensities of Al  , As , As  , Cd , Cd  , Co , Co  , Cr , Cr  , Fe , Fe  , Ni , Ni  , Pb , Pb  , Sn , Sn  , Ti , Ti  and Zn and Zn  as well as that of Cu as well as that of Cu  using CRM ERM®- EB385 and NF3 as modifier gas; temperature T versus time using CRM ERM®- EB385 and NF3 as modifier gas; temperature T versus time  , according to temperature program “TP-ramp” shown in Table 2. , according to temperature program “TP-ramp” shown in Table 2. | ||
As shown in Fig. 3 the analytes itself can be divided in three groups concerning their release behaviour, using NF3 as a modifier (nearly the same analyte behaviour can be stated for SF6):
• First group: As, Bi, P, Sb, Si, Sn, Ti, Zr
• Second group: Cd, Co, Cr, Mn, Ni
• Third group: Al, Fe, Pb, Zn
• Not assignable: Ag, Mg
The release behaviour of analytes using CF4 shows only one group like the first group of NF3 or SF6 beginning with the appearance of the copper signal, with a very narrow temperature range in which the signals start or reach their peak maxima. This can be explained by the significantly delayed reaction of CF4 with copper, – see Fig. 2.
To study the effect of the oxidation step of sub-sample surfaces and the possibility to calibrate with solutions, the intensities of 19 analytes (Ag, Al, As, Bi, Cd, Co, Cr, Fe, Mg, Mn, Ni, P, Pb, Sb, Si, Sn, Ti, Zn, and Zr) were measured using the three modifiers and applying the temperature program “T-stand” (Table 2) to roasted (oxidized) and not roasted (unoxidized) sub-samples of CRM ERM®-EB385 as well as to dried sub-samples of aqueous element solutions. Excluding the analytes Ag, Mg, Ni, and Sb which showed “critical” results, the results of comparisons of the mean values (n = 4) of intensities of the remaining 15 analytes can be summarized:
SF6 and NF3 used as modifiers. The expected trueness of results of calibration using aqueous solutions will be high, because the relative deviation of compared intensities of solid CRM's and of aqueous sub-samples was <15% and in most cases even <5% (up to 73% of all elements). For aqueous calibration the quality of results would not (SF6) or not essentially (NF3) be improved by a preceding roasting procedure. The most important conclusion was that for all analytes trustable results are to be expected when copper CRMs will be used for calibration independent from the oxidation state. This can be concluded, because the relative deviation of measured intensities of roasted and not roasted sub-samples, respectively, was <15 rel%, in most cases even <10% (SF6, 66% of all) or <5% (NF3, 73% of all). In other words: the oxidation state of the surface of sub-samples has no influence of calibration with CRMs.
CF4 used as a modifier. Among the three investigated halogenating modifiers CF4 was the least appropriate one, as well in the case of aqueous calibration as of calibration based on solid copper CRMs. Compared to CHF3 (found to be the best modifier in our former publication1), the performance of CF4 was worse; accordingly CF4 was not included into all our subsequent experiments.
A comparison of the boiling points of fluoride compounds as well as those of the pure elements of all analytes with their observed maximum release temperatures led to the following summary of results:
• Most analytes including Cu (exceptions are Cd, Mg, and Zn) have boiling points of their fluorides at lower temperatures than those of the elements themselves.
• The boiling points of most elements (exceptions are As, Bi, Cd, Mg, P, and Zn) are higher than the highest heating temperature of the optimized temperature program “TP-stand” (1650 °C).
• The maximum release temperatures of all analytes with boiling points >1100 °C (≈melting point of Cu) are below their boiling points.
• The maximum release temperatures of all analytes with boiling points <1100 °C (As, Cd, Mg, P, and Zn) are above their boiling points.
The facts can be interpreted as a clear indication that from the moment when the matrix liquefies/melts, chemical reactions especially halogenation reactions dominate the release behaviour of most elements. Based on these results the standard temperature program “TP-stand” as depicted in Fig. 4 was developed which can be used for both modifiers SF6 and NF3 and which leads to very acceptable analytical results concerning trueness, precision and limits of quantification. From Fig. 4 it can be concluded that analytes of different release behavior can be released from the samples in a way that all analyte signals drop to the baseline before the end of the program time. There are differences between the time dependent spectral line intensities of the different analytes as also described in connection with Fig. 3. Nearly the same release behaviour of analytes as shown in Fig. 4 using SF6 was found for NF3.
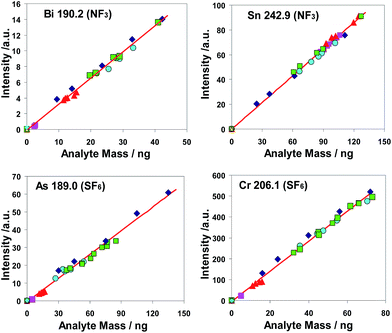
The common linear regression lines of different analytes are depicted based on measurements of copper CRMs as well as of dried aqueous calibration solutions. As a result of statistical tests,74,75 the statistical equivalence of both calibration methods could be stated for the elements Al, As, Bi, Cd, Co, Cr, Fe, Mn, P, Pb, Sb, Si, Sn, Ti, Zn and Zr. This was evidence of the high trueness of results which can be achieved for these elements using a calibration with aqueous sub-samples. For Ag, Mg and Ni the calibration functions differed significantly. However, for these analytes a calibration with matrix reference materials led to results of very satisfying trueness and reproducibility.
The coefficients of determination (R2) based on the linear calibration functions were calculated for all investigated elements, except Ag. For NF3 as well as SF6 15 of 18 analytes have R2 values higher than 0.99 with the exception of Cd, Sb and Ti (for NF3) and of Mg. Ni and Zr (for SF6), though these outlying values were only slightly smaller than 0.99. This result was assessed as an indication of a sufficient grade of linearity of the calibration functions and of a satisfying statistical compatibility of the calibration points derived from different sources of calibration materials namely from different CRMs as well as from an aqueous calibration solution. Exceptions from the statistical homogeneity of results of different calibration modes were the results of analytes Mg and Ni for which satisfying calibration could only be achieved based on calibration with copper CRMs.
| Device modifier plasma element | Limit of quantification (LOQ) calculated by 9s-crit. | |||||
|---|---|---|---|---|---|---|
| ARCOS SOP SF6 radial mg kg−1 | ARCOS SF6 axial mg kg−1 | ARCOS SOP NF3 radial mg kg−1 | Device modifier plasma element | IRIS Adv. SF6 axial mg kg−1 | IRIS Adv. NF3 axial mg kg−1 | |
| a Si signals were not calculated in most cases because of high memory values in the entire systems used coming from matrices of type SiX analysed routinely before. | ||||||
| Ag 338.2 | 0.29 | 0.08 | 0.10 | — | — | — |
| Al 308.2 | 0.07 | 0.15 | 0.09 | Al 237.3 | 0.05 | 0.21 |
| As 189.0 | 0.07 | 0.05 | 0.08 | As 189.0 | 0.03 | 0.03 |
| Bi 190.2 | 0.24 | 0.13 | 0.36 | Bi 190.2 | 0.03 | 0.05 |
| Cd 226.5 | 0.03 | 0.04 | 0.03 | Cd 226.5 | 0.01 | 0.01 |
| Co 230.7 | 0.05 | 0.07 | 0.01 | Co 230.7 | 0.02 | 0.01 |
| Cr 267.7 | 0.04 | 0.04 | 0.01 | Cr 266.6 | 0.02 | 0.03 |
| Fe 241.3 | 0.08 | 0.13 | 0.07 | Fe 233.2 | 0.36 | 0.07 |
| Mg 279.0 | 0.10 | 0.09 | 0.12 | Mg 202.5 | 0.44 | 0.29 |
| Mn 293.3 | 0.16 | - - | 0.06 | Mn 191.5 | 0.04 | 0.06 |
| Ni 231.6 | 0.11 | 0.14 | 0.09 | Ni 232.0 | 0.26 | 0.31 |
| P 178.2 | 0.38 | — | 0.46 | P 178.2 | 0.11 | 0.13 |
| Pb 168.2 | 0.12 | 0.04 | 0.14 | Pb 261.4 | 0.11 | 0.06 |
| Sb 206.8 | 0.53 | 0.13 | 0.35 | Sb 206.8 | 0.16 | 0.07 |
| Si 288.1a | 0.08 | — | 0.21 | Si 288.1a | — | — |
| Sn 189.9 | 0.05 | 0.04 | 0.07 | Sn 189.9 | - - | 0.02 |
| Ti 316.2 | 0.02 | 0.06 | 0.07 | Ti 252.5 | 0.14 | 0.04 |
| Zn 334.5 | 0.57 | 0.41 | 0.43 | Zn 206.2 | 0.03 | 0.02 |
| Zr 273.4 | 0.06 | — | 0.02 | — | — | — |
• All determined LOQ values are in the sub-mg kg−1 region, independent of spectrometer type and kind of plasma observation.
• In the case of SF6 two different kinds of plasma observation were compared. Only for Ag, Bi, Pb, and Sb a significant increase of sensitivity could be found for axial viewing.
• A relatively high number of different LOQs were found when in the case of SF6 results were compared coming from different types of spectrometers (ARCOS, IRIS) both using axial plasma observation.
It can be concluded for most analytes that very similar LOQs were achieved independent of the modifier used (SF6 or NF3) if the same kind of instrumentation was used for measurements.
| Sample ERM®-EB384 | Certified values of ERM®-EB384 | Calibration using NF3-Modifier | Calibration using SF6-modifier | ||||||||||||||
|---|---|---|---|---|---|---|---|---|---|---|---|---|---|---|---|---|---|
| Dried aqueous calibration solution | Cu CRMs | Dried aqueous calibration solution | Cu CRMs | ||||||||||||||
| Element λ/nm | Cert. val. U (k = 2)/mg kg−1 | m/mg kg−1 | s/mg kg−1 | RSD/rel% | RD/rel% | m/mg kg−1 | s/mg kg−1 | RSD/rel% | RD/rel% | m/mg kg−1 | s/mg kg−1 | RSD/rel% | RD/rel% | m/mg kg−1 | s/mg kg−1 | RSD/rel% | RD/rel% |
| a — = not certified; () = indicative values in the CRM certificate, m = mean integrated net intensity values of 5 parallel measurements, and s = standard deviation based on the 5 parallel measurements. | |||||||||||||||||
| Al 257.5 | 13.0 ± 0.8 | 13.1 | 0.3 | 2.4 | 0.4 | 12.7 | 0.3 | 2.1 | 2.2 | 12.7 | 0.3 | 2.1 | 2.1 | 12.7 | 0.3 | 2.1 | 2.7 |
| As 189.0 | 5.0 ± 0.4 | 5.0 | 0.1 | 1.6 | 0.3 | 5.7 | 0.1 | 1.7 | 13.8 | 5.6 | 0.4 | 7.7 | 11.7 | 5.6 | 0.0 | 0.5 | 11.1 |
| Bi 190.2 | 3.34 ± 0.22 | 3.32 | 0.24 | 7.1 | 0.5 | 3.58 | 0.07 | 2.0 | 7.3 | 3.31 | 0.05 | 1.6 | 0.8 | 3.19 | 0.03 | 0.9 | 4.5 |
| Cd 226.5 | 3.95 ± 0.09 | 4.77 | 0.09 | 1.9 |

|
4.01 | 0.09 | 2.2 | 1.4 | 4.22 | 0.09 | 2.1 | 6.7 | 4.02 | 0.11 | 2.6 | 1.7 |
| Co 228.6 | 3.88 ± 0.16 | 3.49 | 0.05 | 1.5 | 10.2 | 3.83 | 0.06 | 1.6 | 1.4 | 3.34 | 0.12 | 3.6 | 13.8 | 4.01 | 0.15 | 3.6 | 3.3 |
| Cr 206.1 | 6.53 ± 0.21 | 6.10 | 0.14 | 2.3 | 6.6 | 6.57 | 0.15 | 2.3 | 0.6 | 6.55 | 0.15 | 2.3 | 0.3 | 6.31 | 0.19 | 3.0 | 3.4 |
| Fe 216.6 | 32.8 ± 1.9 | 34.3 | 0.1 | 0.4 | 4.5 | 31.8 | 0.1 | 0.4 | 3.1 | 29.4 | 0.4 | 1.3 | 10.5 | 32.7 | 0.4 | 1.3 | 0.4 |
| Mg 202.5 | 14.6 ± 0.5 | 9.8 | 0.5 | 5.3 |

|
15.2 | 0.8 | 4.9 | 3.8 | 7.4 | 0.6 | 7.4 |

|
16.8 | 2.6 |

|
15.0 |
| Mn 191.5 | 6.88 ± 0.15 | 7.18 | 0.12 | 1.7 | 4.3 | 7.01 | 0.12 | 1.8 | 1.8 | 6.85 | 0.17 | 2.4 | 0.5 | 6.84 | 0.17 | 2.5 | 0.6 |
| Ni 232.0 | 5.7 ± 0.4 | 3.8 | 0.3 | 7.4 |

|
6.0 | 0.5 | 8.8 | 5.3 | 3.1 | 0.8 |

|

|
4.8 | 1.3 |

|
15.6 |
| P 185.9 | — | 0.4 | 0.1 |

|
— | 0.2 | 0.0 |

|
— | 0.7 | 0.1 |

|
— | 0.5 | 0.1 |

|
— |
| Pb 261.4 | 5.7 ± 0.5 | 6.2 | 0.1 | 0.9 | 7.8 | 5.7 | 0.1 | 1.1 | 0.4 | 5.4 | 0.1 | 2.6 | 5.6 | 6.2 | 0.2 | 2.8 | 8.9 |
| Sb 206.8 | 12.0 ± 0.4 | 17.6 | 0.4 | 2.0 |

|
12.2 | 0.2 | 2.0 | 1.9 | 19.1 | 1.4 | 7.1 |

|
12.9 | 0.6 | 4.8 | 7.5 |
| Sn 189.9 | (10.2 ± 0.9) | 10.8 | 0.1 | 1.3 | 6.0 | 9.9 | 0.2 | 1.6 | 3.1 | 10.2 | 0.3 | 3.3 | 0.1 | 10.3 | 0.3 | 3.2 | 1.4 |
| Ti 190.8 | (2.1 ± 0.23) | 2.2 | 0.3 |

|
5.8 | 1.9 | 0.1 | 5.2 | 11.4 | 2.1 | 0.1 | 2.4 | 0.4 | 1.9 | 0.0 | 2.3 | 8.0 |
| Zn 206.2 | (12.7 ± 2.1) | 13.2 | 0.3 | 2.1 | 4.2 | 13.7 | 0.2 | 1.4 | 8.1 | 13.4 | 0.7 | 5.2 | 5.2 | 13.0 | 0.8 | 6.3 | 2.5 |
| Zr 257.1 | (<9) | 3.7 | 0.1 | 3.0 | — | 4.1 | 0.4 | 9.0 | — | 3.1 | 0.3 | 8.0 | — | 2.7 | 0.2 | 8.0 | — |
Some results based on calibration with aqueous calibration solutions are different from the results based on copper CRMs insofar as in this case the value of 15 rel% was exceeded by RDs of several elements (for Cd, Mg, Ni and Sb with NF3 modifier and for Mg, Ni and Sb with SF6 modifier). For all the other analytes the deviation of the measured values (based on a calibration with solutions) from the certified values was very (partly extremely) low (relative deviation of measured from certified values RD < 15 rel% or even <1 rel%), indicating that for most elements very trustable results based on calibration with aqueous solutions are achievable, too. Summarizing it can be stated that
• The calibration based on copper CRMs will lead to results of high trueness for practically all analytes under investigation and independent of the kind of modifier gas used (NF3 or SF6, respectively) or the oxidation state of sub-sample surfaces.
• The calibration based on aqueous solutions will lead to very trustable results for most analytes. Intolerable large deviations of measured from true values of mass fractions were only determined in the case of SF6 as a modifier for three elements and in the case of NF3 as a modifier for four elements (out of 15).
Hydrogen/argon modifier gas mix
In different investigations ET AAS was used to determine Se and Te in pure copper by enrichment procedures based on co-precipitation;77–80 LOD values down to sub-mg kg−1 level were achieved. Hydride generation AAS (HG AAS) is used to determine Se and Te by chemical hydride formation,81 but several procedures include additional chemical82 or electrolytic83 removal of the copper matrix. Also ICP OES was combined with hydride generation steps for determination of hydride forming elements84–86 in pure copper.
Method 1 (M1) – determination of all relevant analytes in two steps. First step: halogenation including partial evaporation (0.1–0.3 mg of 20 mg) of a Cu sub-sample and determination of relevant analytes as described in the first part of this paper.
Second step: treatment with hydrogen including partial evaporation (3–4 mg) of the same Cu sub-sample for the determination of Se, Te and Ag (>90% of Ag remain in the sub-sample) by using an Ar/H2 mixture at high temperatures (short temperature peak > 2200 °C).
Method 2 (M2) – determination of Bi, Se, and Te and several other analytes in one single step by partial evaporation. Single step: treatment with hydrogen including partial evaporation (3–4 mg of 20 mg) of a Cu sub-sample by using an Ar/H2 mixture at high temperatures (short temperature peak > 2200 °C) and determination of Bi, Se and Te and several other analytes which are also released from the copper sub-sample.
Method 3 (M3) – determination of Bi, Se, and Te and several other analytes in one single step by total evaporation. Single step: treatment with hydrogen including total evaporation of a Cu sub-sample (2–5 mg) at high temperatures (up to 2500 °C) and determination of Bi, Se and Te and some other analytes which are also quantitatively released.
In the following basic investigations with H2 as reaction gas the Methods M2 and M3 were preferably considered. The signal intensities in all the following figures are averages of at least three replicated measurements.
H2–Ar ratio in the inner gas flow. Note: the temperature conditions of TP part (see Table 2) or similar were used for successive investigations.
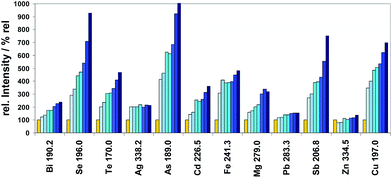
As first investigations to study the dependence of the spectral line intensities of the elements released by hydrogenation on the hydrogen concentration in the inner gas flow, copper CRM ERM®-EB385 was used. The results for 11 selected analytes plus copper are depicted in Fig. 6 depending on increasing hydrogen concentrations in the inner Argon flow.
It can be concluded from Fig. 6 that the signals of almost all selected hydride forming elements (Bi, Se, Te, As, Sb, and Sn) are significantly increased by increasing the concentration of the hydrogen modifier gas. This fact can only be interpreted by improved release and transport efficiencies of formed analyte hydrides. The intensities of some of the other elements (Cd, Fe, and Mg) and of the copper matrix are also increased, whereas the intensities of all other elements (Ag, Pb, and Zn) are not much changed. Additional investigations were restricted to Bi, Se, and Te (as most important analytes). Intensities as well as mass losses were clearly increased with increasing H2 concentration; however the increase of the intensities was larger than the increase of the mass loss, especially for Se, Te and Cu. It could be concluded that these three trace elements as well as the copper matrix react with hydrogen by forming their hydrides. Even for the matrix Cu the increase of intensity is higher than the increase of sub-sample mass loss. One explanation could be that the transport efficiency of the copper atoms in the case of measurements without modifier or with low concentrations of the modifier is lower than that with higher concentrations because copper hydride molecules are formed at a progressive rate.
Optimization of the releasing temperature. As the optimum release temperature for the different analyte elements by using CRM ERM®-EB385 and H2 as a modifier gas an optimal temperature of TP-part (see Table 2) of about 2200 °C ± 50 °C was identified. At higher temperatures lower intensities were observed for most elements, probably resulting from the change of plasma conditions according to higher concentrations of copper atoms in the plasma (plasma loading).
Gas flow rate of inner gas flow. To investigate the influence of the flow rate of the inner gas on the line intensities of the analytes the flow rate of the inner gas flow was varied from 90 mL min−1 to 210 mL min−1. The concentration of the H2 gas in the inner gas flow was adjusted to 29% while the flow rate of the bypass gas was 400 mL min−1 for all measurements. The maximum intensities of the analyte elements were observed with inner gas flow rates of 120–170 mL min−1. From this result a compromised optimum inner gas flow rate of 150 mL min−1 by using a bypass gas flow rate of 400 mL min−1 was defined as a constant parameter of Methods M2, M1 (second step) and M3.
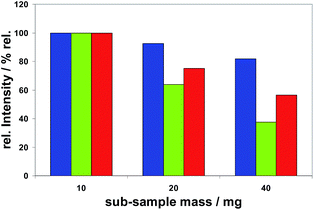
Sub-sample mass. The dependence of measured spectral line intensities on the sub-sample mass was investigated using Method M2. It was found that the intensities of all analytes normalized to the corresponding analyte mass were not constant, but decreasing with increasing sub-sample masses. The different extent of this effect is demonstrated in Fig. 7 for Bi, Se and Te. Among all analytes (as listed in Tables 5 or 6) this effect was most distinct for Se and smallest for Mg.
| Element λ/nm | LOQ 9s-crit./mg kg−1 and coefficients of determination (R2) | |||
|---|---|---|---|---|
| Part. evap. (M2) | Tot. evap. (M3) | |||
| LOQ calc. for 20 mg | R 2 | LOQ calc. for 3 mg | R 2 | |
| a — = could not be measured (overflow of signal or signal too low). b Wave length 338.2 nm. | ||||
| Ag 243.7 |

|
0.9939 | 0.23 |

|
| Ag 328.0 | 0.03 | 0.9977 | 0.02b | — |
| As 189.0 | 0.17 | 0.9983 | 0.04 | 0.9937 |
| Bi 190.2 | 0.02 | 0.9995 | 0.03 | 0.9992 |
| Cd 228.8 | 0.03 | 0.9963 | — | — |
| Fe 241.3 |

|
0.9910 |

|
0.9942 |
| Mg 279.0 | 0.13 | 0.9902 | 0.97 | 0.9974 |
| Mg 285.2 | 0.03 | 0.9902 | 0.11 |

|
| Ni 231.6 | — | — | 0.10 | 0.9985 |
| Pb 168.2 | 0.03 |

|
0.11 |

|
| Pb 283.3 | 0.08 |

|
0.23 |

|
| Sb 206.8 | 0.22 | 0.9958 | 0.15 | 0.9956 |
| Se 196.0 | 0.03 | 0.9986 | 0.07 | 0.9923 |
| Sn 140.0 | — | — | 0.86 | 0.9982 |
| Te 170.0 | 0.03 | 0.9989 | 0.06 | 0.9977 |
| Zn 334.5 | 0.06 | 0.9944 | 0.79 |

|
| Element, λ/nm | Cu-CRM ERM®-EB383 | Part. evap. (M2) SOP | Tot. evap. (M3) SOP | ||||||
|---|---|---|---|---|---|---|---|---|---|
| Cert. val. U*/mg kg−1 | m/mg kg−1 | s/mg kg−1 | RSD/rel% | RD/rel% | m/mg kg−1 | s/mg kg−1 | RSD/rel% | RD/rel% | |
| Ag 328.0 | 4.70 ± 0.20 | 5.04 | 0.43 | 8.5 | 7.3 | — | — | ||
| As 189.0 | 1.93 ± 0.15 | 1.99 | 0.18 | 9.2 | 3.3 | 2.02 | 0.07 | 3.7 | 4.6 |
| Bi 190.2 | 1.02 ± 0.09 | 1.11 | 0.03 | 2.3 | 9.3 | 1.06 | 0.02 | 1.6 | 4.4 |
| Cd 228.8 | 1.48 ± 0.15 | 1.56 | 0.08 | 5.2 | 5.6 | — | — | ||
| Fe 241.3 | 10.9 ± 0.5 | 10.4 | 0.7 | 6.9 | 5.0 | 11.7 | 0.6 | 5.2 | 7.3 |
| Mg 279.0 | 2.37 ± 0.29 | 2.54 | 0.08 | 3.1 | 7.3 | 2.32 | 0.3 | 12.8 | 2.3 |
| Ni 231.6 | 3.59 ± 0.21 | — | — | 3.48 | 0.20 | 5.6 | 2.9 | ||
| Pb 168.2 | 1.31 ± 0.20 | 1.39 | 0.03 | 2.5 | 6.5 | 1.23 | 0.11 | 8.6 | 6.2 |
| Sb 206.8 | 1.44 ± 0.17 | 1.46 | 0.1 | 7.1 | 1.7 | 1.45 | 0.08 | 5.4 | 0.4 |
| Se 196.0 | (1.16 ± 0.19) | 1.32 | 0.05 | 3.6 | 13.7 | 1.24 | 0.01 | 0.6 | 7.1 |
| Sn 140.0 | 4.7 ± 0.6 | — | — | 5.0 | 0.2 | 3.5 | 7.3 | ||
| Te 170.0 | 1.40 ± 0.16 | 1.36 | 0.01 | 1.1 | 2.5 | 1.33 | 0.03 | 1.9 | 5.1 |
| Zn 334.5 | (7.8 ± 0.4) | 7.5 | 0.1 | 1.5 | 4.3 | 7.7 | 0.6 | 7.7 | 0.8 |
| Element, λ/nm | Cu-CRM BCR 074 | Part. evap. (M2)EOP | Tot. evap. (M3) EOP | ||||||
|---|---|---|---|---|---|---|---|---|---|
| Cert. val. U**/mg kg−1 | m/mg kg−1 | s/mg kg−1 | RSD/rel% | RD/rel% | m/mg kg−1 | s/mg kg−1 | RSD/rel% | RD/rel% | |
| a — = could not be measured (overflow of signal or signal too low or analyte not certified). () = indicative values in the CRM certificate. U* = expanded uncertainty with a coverage factor k = 2. U** = uncertainty expr. as half-width of the 95% confidence interval of the certif. mean. | |||||||||
| Ag 328.0 | 12.8 ± 0.7 | 12.8 | 0.3 | 2.1 | 0.2 | — | — | ||
| As 189.0 | 0.78 ± 0.14 | 0.79 | 0.06 | 7.9 | 1.3 | 0.85 | 0.05 | 5.6 | 9.4 |
| Bi 190.2 | 0.10 ± 0.03 | 0.09 | 0.004 | 4.5 | 8.8 | 0.1 | 0.01 | 11.8 | 1.4 |
| Cd 228.8 | — | — | — | — | — | ||||
| Fe 241.3 | 1.14 ± 0.06 | 1.03 | 0.21 |

|
9.7 | 1.23 | 0.56 |

|
7.7 |
| Mg 279.0 | — | — | — | — | — | ||||
| Ni 231.6 | 1.04 ± 0.11 | — | — | 1.15 | 0.03 | 2.6 | 10.8 | ||
| Pb 168.2 | 0.97 ± 0.05 | 0.96 | 0.06 | 6.6 | 1.4 | 0.96 | 0.04 | 4.2 | 0.7 |
| Sb 206.8 | 0.58 ± 0.03 | 0.76 | 0.03 | 3.4 |

|
0.65 | 0.07 | 11.2 | 12.2 |
| Se 196.0 | 0.37 ± 0.04 | 0.40 | 0.03 | 8.1 | 7.1 | 0.39 | 0.03 | 7.2 | 4.3 |
| Sn 140.0 | <0.07 | <0.1 | — | <0.1 | — | ||||
| Te 170.0 | 0.21 ± 0.08 | 0.22 | 0.01 | 3.1 | 4.6 | 0.21 | 0.03 | 12.9 | 1.6 |
| Zn 334.5 | 0.46 ± 0.07 | 0.52 | 0.02 | 4.3 | 12.8 | — | — | ||
The decrease of the normalized intensities with increasing sub-sample masses would lead to curved calibration functions if these would be based on different masses. To achieve straight calibration functions sub-sample masses of about 20 mg ± 1 mg were recommended for Method M2. The same holds for Method M1, if not only its first part is intended to be used. The observed effect can be explained by the fact that the mass of an analyte in a sub-sample is proportional to the sub-sample mass, and therefore in the case of a globular sub-sample (with a radius of r) proportional to r3, whereas the surface of this globular sub-sample is proportional to r2. Hence the relationship between the surface area which is available for hydrogenation reactions and the analyte mass in the sub-sample ready to move to and to react with hydrogen at this surface becomes step by step smaller with increasing sub-sample masses. This fact seems to be the main reason for the observed effect. An increasing effect of plasma loading can probably be excluded because the evaporated mass of copper cannot be directly correlated to the sub-sample mass: 10 (4.5) mg, 20 (4.8) mg and 40 (5.3) mg, evaporated mass of Cu in brackets. For Method M3 sub-sample masses of 3–5 mg were fixed to come to reproducible evaporation times and to minimize potentially caused depositions in the ETV system. All subsequent studies with this method showed no significant dependencies of the results on sub-sample masses within this small range of weighing.
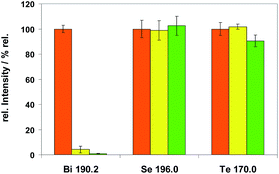
Checking calibration by dried element solutions. Intensities of different analytes (Ag, Bi, Cd, Mg, Pb, Se, Te, and Sn) coming from dried sub-samples of a calibration solution were compared with intensities from sub-samples of copper CRM ERM®-EB385. It could be concluded that in the case of both methods (M2 and M3) based on hydrogenation reactions the quantification via dried aqueous solutions is limited and would only allow semi-quantitative analyses.
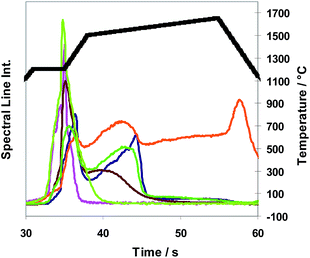
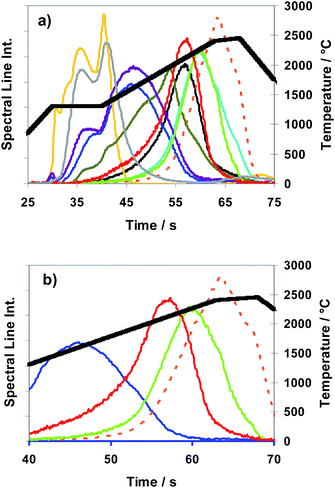
The T-program TP-rampspez depicted in Fig. 8 was modified to the optimized T-program TP-part (see Table 2) which was used for all the following quantitative measurements with Method M2 (partial evaporation of sub-samples). Compared with TP-rampspez it has a shortened high temperature plateau which moreover starts at earlier time. At this time, after a temperature ramp (at 38 s), Se and Te begin to be released. A rough impression of the release behaviour of elements using TP-part can be gained observing Fig. 9 (TP-tot) because the temperature progress is very similar up to 37 s where TP-part ends.
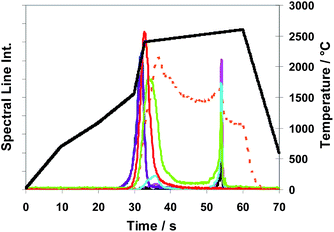 | ||
Fig. 9 Method M3 (total evaporation): spectral line intensities with H2 as a modifier (29% H2; inner gas flow rate 150 mL min−1) for As  , Au , Au  , Bi , Bi  , Cu , Cu  , Pb , Pb  , Sb , Sb  , Se , Se  and Te and Te  , using sub-samples of copper CRM ERM®-EB385, and temperature T , using sub-samples of copper CRM ERM®-EB385, and temperature T using T-program TP-tot shown in Table 2. using T-program TP-tot shown in Table 2. | ||
In Fig. 9 time and temperature dependent spectral line intensities of seven analytes and of the copper matrix are depicted for the case of total sub-sample evaporation (Method M3) by using temperature program TP-tot (see Table 2). The very different behaviour of different groups of analytes in the case of a total evaporation (Method M3) is a fact, being most noticeable in view of Fig. 9. The intensity maxima of the elements as already investigated in the case of partial evaporation of sub-samples, (such as of Bi, Pb, (Se) and Te) and also those of elements here not depicted (such as of Ag, Cd, Mg, Mn, Zn) appear in the first part of the temperature program before the copper intensity achieves its maximum, whereas the other investigated elements, which cannot be determined by Method M2, such as As, Au, Sb and Sn, have their intensity maxima distinctly resembling the latter. Their sharp intensity peaks appear after the last phase of copper matrix evaporation. To interpret the results of Fig. 9, it is necessary to note that the signal of copper at >55 s is only an artefact coming from memory effects of the system. The intensities of Se and Sb have maxima at two different temperatures. Both elements have a second smaller peak in addition to the main peak; the smaller peak appears for Se in the last part and for Sb in the first part of the temperature program. The fractions of the analyte masses of the four elements released in the last phase of the temperature program (approximately expressed as fractions of their spectral line intensities) are: Sb (60–70%), As, Sn (>90%) and Au (≈100%). From first exploratory investigations it could be concluded additionally that platinum metals show release behaviour very similar to that of Au. One aspect of a succeeding publication could be further and more detailed investigations to this point.
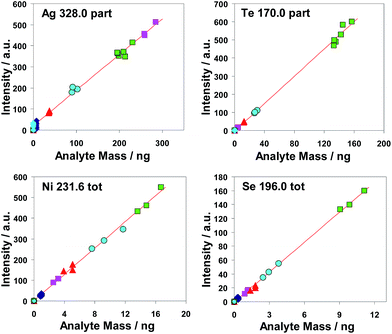
The investigated calibration functions are straight regression lines; they have negligible or very low intercepts. All measured points lay very near to the common calibration functions. These facts can be interpreted as an indication to the high trueness of both methods. To underpin this statement their coefficients of determination R2 were recorded in according columns in Table 5. The majority of the values of most coefficients of determination are >0.99.
Au is not listed because no CRM was at our disposal. An LOQ value at the low ppb level can be given as a first estimation. From the results of Table 5 high detection power for the investigated 13 analytes (15 pairs of analyte/spectral line) of the investigated methods based on hydrogenation is evident. It can be concluded that the most important result is that Se and Te can be determined with very low LOQ values using all three Methods.
• Elements Ag, Mg and Ni can also be determined with low LOQ values by Methods M2 and/or M3 using hydrogenation reactions.
• The LOQs determined for the great majority of elements/spectral lines (the three exceptions are marked gray) are lying in the sub-mg kg−1 region independently if Method M2 or M3 were applied.
• LOQ values below 0.1 mg kg−1 could be achieved for 8 elements (of 13) using Method M2.
• The LOQs determined for Method M3 are for most analytes higher than those determined for Method M2 (exceptions Ag, As, Sb).
Conclusions
By the results of our investigations essential answers could be given to the open questions listed in the introduction:(1) The necessity to apply the preliminary time consuming “roasting” (surface oxidizing) procedure: this step can now be omitted when SF6 or NF3 are used as modifiers and copper CRMs are used for calibration.
(2) The fact that not all analytes could be calibrated by using dried residua of calibration solutions: the problem could not really be solved by using SF6 or NF3. CF4 used instead of CHF3 did not show the expected improvement. However, a high quality of analytical performance was achieved with SF6 or NF3 for Ag, Al, As, Bi, Cd, Co, Cr, Fe, Mg, Mn, Ni, P, Pb, Sb, Si, Sn, Ti, Zn, and Zr. The analytes Ag, Mg and Ni stayed “critical”, but strongly improved results could be achieved for their determination, as described in the following item.
(3) Some elements could not (Se and Te) or not sufficiently (Ag, Mg, and Ni) be released from the matrix by halogenation reactions and could therefore not (or only limited) be determined and quantified: this drawback was totally overcome using hydrogen as a modifier. Optimized methods were developed based on partial as well as on total evaporation using hydrogenation reactions and higher temperatures than for halogenation reactions. This is true for Ag, Mg, and Ni in the case of partial evaporation only without any previous halogenation step (M2), or in the case of total evaporation of copper samples (M3). Additionally several other elements besides Se and Te and Ag, Mg, and Ni can be quantified simultaneously: Au, As, Bi, Cd, Fe, Pb, Sb, Sn and Zn, but for some of them better analytical performance can be achieved using the first step of Method M1 based on halogenation reactions. Very low limits of quantification, especially for Se and Te, but also for the “critical” elements Ag, Mg, and Ni, as well as high trueness and sufficiently high reproducibility of all results were achieved.
The analytical performance of the optimized methods now presented offers the possibility of a very fast comprehensive analysis of pure and high purity copper with excellent analytical performance. The physicochemical processes on which the analytical methods are based were interpreted in different passages of both parts of analytical investigations of this paper.
Acknowledgements
The authors gratefully thank Peter Perzl, Spectral Systems, Fürstenfeldbruck, Germany, for his very helpful and manyfold technical support of this work. Our special thanks also go to Ms Angela Meckelburg, BAM, Berlin, Germany, for her great engagement and very helpful experimental support.References
- J. Hassler, P. Barth, S. Richter and R. Matschat, J. Anal. At. Spectrom., 2011, 26, 2404–2418 RSC
.
-
S. P. Murarka and R. J. Gutmann, Copper-Fundamental Mechanisms for Microelectronic Applications, John WileySons, Inc., New York, 2000 Search PubMed
.
- S. P. Murarka and S. W. Hymes, Crit. Rev. Solid State Mater. Sci., 1995, 20, 87–124 CrossRef CAS
.
- P. Singer, Semicond. Int., 2002, 25, 46–53 CAS
.
- E. Borowiak-Palen, A. Steplewska and M. H. Rummeli, Phys. Status Solidi B, 2009, 246, 2448–2452 CrossRef CAS
.
-
E. N. Grilli, S. Blanco, F. S. Sbrana, A. Zanini and A. Das, Unbekannt Edle, Instituto Salesiano Pio XI, 2002 Search PubMed
.
- M. Steffen, Erzmetall, 2002, 55, 366–368 CAS
.
- B. Lange, S. Recknagel, M. Czerwensky, R. Matschat, M. Michaelis, B. Peplinski and U. Panne, Mikrochim. Acta, 2008, 160, 97–107 CrossRef CAS
.
- R. Matschat, M. Czerwensky, S. Pattberg and H. J. Heinrich, Phys. Status Solidi A, 2002, 189, 107–122 CrossRef CAS
.
- M. Milbourn, J. Inst. Met., 1934, 55, 275–281 Search PubMed
.
- M. Milbourn, J. Inst. Met., 1943, 69, 441–463 CAS
.
- M. Milbourn, Proceedings of the Physical Society, 1947, 59, 273–275 CrossRef CAS
.
- G. Maassen, Angew. Chem., 1953, 65, 113–114 CrossRef
.
- G. Maassen, Angew. Chem., 1953, 65, 286–291 CrossRef CAS
.
- G. Maassen, Rev. Univers. Mines, Metall., Mec., 1959, 15, 300–303 Search PubMed
.
- R. H. Price, Met. Ind., 1960, 97, 167–170 CAS
.
- W. E. Publicover, Anal. Chem., 1965, 37, 1680–1684 CrossRef CAS
.
- P. Tymchuk, D. S. Russell and S. S. Berman, Spectrochim. Acta, 1965, 21, 2051 CrossRef CAS
.
- P. Tymchuk, A. Mykytiuk and D. S. Russell, Appl. Spectrosc., 1968, 22, 268 CrossRef CAS
.
- L. N. Filimonov, Zavod. Lab., 1953, 19, 569 Search PubMed
, 16, 1200.
- H. Gantzkow, Neue Huette, 1964, 3, 188–190 Search PubMed
.
-
M. Mahar, G. Kunselman, P. Brown, P. Dalager and P. Perzl, American Laboratory January 2010 Search PubMed
.
- European Standard, EN 15079, 2007.
- European Standard, EN 15063–1, 2006.
- European Standard, EN 15063–2, 2006.
-
J. D. R. Payling and A. Bengston, Glow Discharge Optical Emission Spectrometry, New York, 1997 Search PubMed
.
- T. Gusarova, V. D. Hodoroaba, R. Matschat, H. Kipphardt and U. Panne, J. Anal. At. Spectrom., 2009, 24, 680–684 RSC
.
- M. Kasik, C. Venzago and R. Dorka, J. Anal. At. Spectrom., 2003, 18, 603–611 RSC
.
- R. Matschat, J. Hinrichs and H. Kipphardt, Anal. Bioanal. Chem., 2006, 386, 125–141 CrossRef CAS
.
-
T. Gusarova, PhD Thesis, Humboldt University, Berlin, 2009
.
- T. Gusarova, T. Hofmann, H. Kipphardt, C. Venzago, R. Matschat and U. Panne, J. Anal. At. Spectrom., 2010, 25, 314–321 RSC
.
- B. Lange, R. Matschat and H. Kipphardt, Anal. Bioanal. Chem., 2007, 389, 2287–2296 CrossRef CAS
.
- H. P. Weise, W. Gorner and M. Hedrich, Fresenius' J. Anal. Chem., 2001, 369, 8–14 CrossRef CAS PubMed
.
- R. Simon, G. Buth and M. Hagelstein, Nucl. Instrum. Methods Phys. Res., Sect. B, 2003, 199, 554–558 CrossRef CAS
.
- S. Pattberg and R. Matschat, Fresenius' J. Anal. Chem., 1999, 364, 410–416 CrossRef CAS
.
-
S. Pattberg, PhD Thesis, Humboldt University, Berlin, 1999
.
- H. Traub, M. Czerwensky, R. Matschat, H. Kipphardt and U. Panne, J. Anal. At. Spectrom., 2010, 25, 690–696 RSC
.
- H. Traub, M. Walle, J. Koch, U. Panne, R. Matschat, H. Kipphardt and D. Gunther, Anal. Bioanal. Chem., 2009, 395, 1471–1480 CrossRef PubMed
.
- J. Wienold, H. Traub, B. Lange, T. Giray, S. Recknagel, H. Kipphardt, R. Matschat and U. Panne, J. Anal. At. Spectrom., 2009, 24, 1570–1574 RSC
.
-
C. M. Domizel, Modern Methods of analysis of copper and its alloys, Amsterdam, London, New York, 1963 Search PubMed
.
- K. Z. Balla, E. G. Harsanyi, L. Polos and E. Pungor, Mikrochim. Acta, 1975, 107–116 CrossRef CAS
.
- E. Milella, E. Sentimenti and G. Mazzetto, At. Spectrosc., 1993, 14, 1–3 Search PubMed
.
-
B. Field, The Determination of Trace Metals in High Puritiy Copper with the GTA-95 Graphite Tube Atomizer, Varian, 1982 Search PubMed
.
- S. A. Kumar, M. B. Sanglikar, M. S. Shaikh and M. Sudersanan, Indian J. Chem. Technol., 2004, 11, 170–177 Search PubMed
.
- T. D. Lopez, M. T. L. Marin and A. G. Coedo, J. Anal. At. Spectrom., 1988, 3, 447–452 RSC
.
-
P. S. Doidge, Determination of trace impurities in high-purity copper by sequential ICP-AES with axial viewing, Varian, 1998 Search PubMed
.
- S. D. Overduin and I. D. Brindle, J. Anal. At. Spectrom., 2001, 16, 289–292 RSC
.
- R. Matschat, M. Czerwensky, M. Hamester and S. Pattberg, Fresenius' J. Anal. Chem., 1997, 359, 418–423 CrossRef
.
- R. Matschat, M. Czerwensky, S. Pattberg, H. J. Heinrich and S. Tutschku, Mater. Trans., 2002, 43, 90–97 CrossRef CAS
.
- R. Matschat and M. Czerwensky, Phys. Status Solidi A, 1997, 160, 567–574 CrossRef CAS
.
- E. J. dos Santos, A. B. Herrmann, J. L. Olkuszewski, T. D. Saint'Pierre and A. J. Curtius, Braz. Arch. Biol. Technol., 2005, 48, 681–687 CrossRef CAS
.
- H. Umeda, I. Inamoto and K. Chiba, Bunseki Kagaku, 1990, 39, 283–287 CrossRef CAS
.
- K. Chiba, I. Inamoto and M. Saeki, J. Anal. At. Spectrom., 1992, 7, 115–119 RSC
.
- C. J. Park, S. R. Park, S. R. Yang, M. S. Han and K. W. Lee, J. Anal. At. Spectrom., 1992, 7, 641–645 RSC
.
- A. Detcheva, P. Barth and J. Hassler, Anal. Bioanal. Chem., 2009, 394, 1485–1495 CrossRef CAS PubMed
.
- S. Z. Chen, F. Li, Z. H. Liao, T. Y. Peng and Z. C. Jiang, Fresenius' J. Anal. Chem., 1999, 364, 556–559 CrossRef CAS
.
- G. Zaray and T. Kantor, Spectrochim. Acta, Part B, 1995, 50, 489–500 CrossRef
.
- J. Hassler, G. Zaray, K. Schwetz and K. Florian, J. Anal. At. Spectrom., 2005, 20, 954–956 RSC
.
- G. Zaray, F. Leis, T. Kantor, J. Hassler and G. Tolg, Fresenius' J. Anal. Chem., 1993, 346, 1042–1046 CrossRef CAS
.
- P. Barth, J. Hassler, I. Kudrik and V. Krivan, Spectrochim. Acta, Part B, 2007, 62, 924–932 CrossRef
.
- S. Z. Chen, Spectrosc. Spectral Anal., 2005, 25, 1697–1699 CAS
.
- H. Nickel, Z. Zadgorska and G. Wolff, Spectrochim. Acta, Part B, 1993, 48, 25–38 CrossRef
.
- J. A. C. Broekaert and M. A. Amberger, J. Anal. At. Spectrom., 2010, 25, 1308–1315 RSC
.
- K. C. Friese and V. Krivan, Fresenius' J. Anal. Chem., 1999, 364, 72–78 CrossRef CAS
.
- O. Werner, Fresenius' J. Anal. Chem., 1963, 198, 70–79 CrossRef CAS
.
- H. Tolle, Fresenius' J. Anal. Chem., 1968, 240, 162–170 CrossRef
.
- J. M. Ren and E. D. Salin, Spectrochim. Acta, Part B, 1994, 49, 555–566 CrossRef
.
- M. E. Rybak and E. D. Salin, Spectrochim. Acta, Part B, 2001, 56, 289–307 CrossRef
.
- K. C. Friese, U. Watjen and K. H. Grobecker, Fresenius' J. Anal. Chem., 2001, 370, 843–849 CrossRef CAS PubMed
.
- T. Kantor, Spectrochim. Acta, Part B, 1988, 43, 1299–1320 CrossRef
.
- P. Barth, S. Hauptkorn and V. Krivan, J. Anal. At. Spectrom., 1997, 12, 1359–1365 CAS
.
- IRMM European Commission, JRC, Certified Reference Material, Certificate BCR®–074, https://ec.europa.eu/jrc/sites/default/files/rm/BCR-074_cert.pdf.
- BAM Federal institute for Materials Research and Testing, Germany, Copper CRM certificates, http://www.rm-certificates.bam.de/de/certificates/non_ferrous_and_alloys/copper/index.htm.
- J. Mandel, Journal of Quality Technology, 1984, 16, 1–14 Search PubMed
.
- DIN Standard 38 402 71, 2002.
- DIN Standard 32645, 2008.
- W. Reichel and B. G. Bleakley, Anal. Chem., 1974, 46, 59–61 CrossRef CAS
.
- G. Schulze and R. Martens-Menzel, J. Anal. Chem., 1993, 346, 663–666 Search PubMed
.
- J. D. Mullen, Talanta, 1976, 23, 846–848 CrossRef CAS PubMed
.
- P. Grünwald, P. Tschöpel and G. Tölg, Z. Anal. Chem., 1976, 279, 187–193 CrossRef
.
-
J. Dedina and L. Dimiter, Hydride Generation Atomic Absorption Spectrometry, J. Wiley and Sons Ltd., UK, 1995, 2015 Search PubMed
.
- H. Ming Liu, S.-Y. Chen, P.-H. Chang and S.-J. Jane Tsai, Anal. Chim. Acta, 2002, 459, 1161–1168 Search PubMed
.
- R. Bye, Anal. Chem., 1985, 57, 1481–1482 CrossRef CAS
.
- I. Rojas, M. Murillo, N. Carrión and J. Chirinos, Anal. Bioanal. Chem., 2003, 376, 110–117 CAS
.
- M. Grotti, C. Lagomarsino and R. Frache, J. Anal. At. Spectrom., 2005, 20, 1365–1373 RSC
.
- G. Tyler, A. Cosnier, S. Velasquez, A. Bartha and M. Ballók, Horiba, Technical Reports, JY Division, Feature Article Engl. Ed., vol. 7, pp. 38–43, http://www.horiba.com/uploads/media/RE07-08-038.pdf Search PubMed.
- H. Yamaguchi, S. Itoh, S. Igarashi, K. Naitoh and R. Hasegawa, Fresenius' J. Anal. Chem., 1998, 362, 395–398 CrossRef CAS
.
- N. Sadiq and D. Beauchemin, Anal. Chim. Acta, 2014, 851, 23–29 CrossRef CAS PubMed
.
- W. Nischkauer, E. Herincs, M. Puschenreiter, W. Wenzel and A. Limbeck, Spectrochim. Acta, Part B, 2013, 89, 60–65 CrossRef CAS
.
- F. Kaveh and D. Beauchemin, J. Anal. At. Spectrom., 2014, 29, 1371–1377 RSC
.
- T. Vogt, D. Bauer, M. Neurot and M. Otto, Fuel, 2015, 152, 96–102 CrossRef CAS
.
| This journal is © The Royal Society of Chemistry 2016 |

