
Use of Ga for mass bias correction for the accurate determination of copper isotope ratio in the NIST SRM 3114 Cu standard and geological samples by MC-ICPMS
QingHua
Hou
a,
Lian
Zhou
*a,
Shan
Gao
a,
Ting
Zhang
a,
Lanping
Feng
a and
Lu
Yang
*b
aState Key Laboratory of Geological Processes and Mineral Resources, China University of Geosciences, Wuhan, 430074, China. E-mail: zhcug@163.com
bChemical Metrology, Measurement Science and Standards, National Research Council Canada, Ottawa, Ontario, Canada K1A 0R6. E-mail: lu.yang@nrc-cnrc.gc.ca
First published on 24th March 2015
Abstract
The absolute determination of the Cu isotope ratio in NIST SRM 3114 based on a regression mass bias correction model is performed for the first time with NIST SRM 944 Ga as the calibrant. A value of 0.4471 ± 0.0013 (2SD, n = 37) for the 65Cu/63Cu ratio was obtained with a value of +0.18 ± 0.04‰ (2SD, n = 5) for δ65Cu relative to NIST 976. The availability of the NIST SRM 3114 material, now with the absolute value of the 65Cu/63Cu ratio and a δ65Cu value relative to NIST 976 makes it suitable as a new candidate reference material for Cu isotope studies. In addition, a protocol is described for the accurate and precise determination of δ65Cu values of geological reference materials. Purification of Cu from the sample matrix was performed using the AG MP-1M Bio-Rad resin. The column recovery for geological samples was found to be 100 ± 2% (2SD, n = 15). A modified method of standard-sample bracketing with internal normalization for mass bias correction was employed by adding natural Ga to both the sample and the solution of NIST SRM 3114, which was used as the bracketing standard. An absolute value of 0.4470 ± 0.0013 (2SD, n = 37) for 65Cu/63Cu quantified in this study was used to calibrate the 69Ga/71Ga ratio in the two adjacent bracketing standards of SRM 3114, their average value of 69Ga/71Ga was then used to correct the 65Cu/63Cu ratio in the sample. Measured δ65Cu values of 0.18 ± 0.04‰ (2SD, n = 20), 0.13 ± 0.04‰ (2SD, n = 9), 0.08 ± 0.03‰ (2SD, n = 6), 0.01 ± 0.06 (2SD, n = 4) and 0.26 ± 0.04‰ (2SD, n = 7) were obtained for five geological reference materials of BCR-2, BHVO-2, AGV-2, BIR-1a, and GSP-2, respectively, in agreement with values obtained in previous studies.
Introduction
Copper has two stable isotopes, 63Cu and 65Cu, with relative abundances of 69.17% and 30.83%, respectively.1,2 As an important ore-forming element, copper exists widely in different geological systems and is active in ore-forming and rock-forming processes.3 Therefore, copper isotopes can be a useful geochemical tracer and play an important role in the study of sources of Cu in the ore-forming process and mechanism.4–6 Copper isotopes have also been used as a new tracer in the study of the evolution of the Earth's environment, geosphere and biosphere interactions, and other aspects of the formation mechanism of deposits.7,8 It is of great significance to obtain high precision and accuracy copper isotope ratio data. Significant variations of the copper isotope composition have been reported in nature. Walker et al.1 and Shields et al.2 used thermal ionization mass spectrometry (TIMS) to investigate the distribution of the Cu isotope ratio in natural samples. Modern advances in multi-collector inductively coupled plasma mass spectrometry (MC-ICPMS) have allowed high precision isotope ratio measurements, and the relative precision of Cu isotope ratio measurements can be as low as 40–50 ppm on a variety of ores, rocks, and biological materials.9,10 Moreover, MC-ICPMS benefits from simple and robust sample introduction, high sample throughput, and high mass resolution. The advantages mentioned above have generated renewed research interest in copper isotopes.11,12MC-ICPMS suffers from a large mass bias which needs to be properly corrected for accurate isotope ratio measurements. For Cu isotope ratio measurements, various mass bias correction models, such as the direct standard-sample bracketing (SSB) model,13 combined SSB with internal mass bias correction model and regression mass bias correction model, can be employed.9 The SSB approach is capable of correcting instrumental mass bias provided the analyte and the sample matrix are matched between the standard and the sample. However, it does not account for short-term fluctuations in mass bias between bracketing standards. Recent studies14–19 have reported the use of a combined SSB with internal mass bias correction model whereby a standard with a known analyte ratio is used to calibrate the ratio of the internal standard; this calibrated ratio of the internal standard is then used to calibrate the analyte ratio in the sample. The advantage of this correction model is that the short-term fluctuations in mass bias between bracketing standards are corrected. As demonstrated in these studies,14–19 precision of the analyte ratio has improved at least twofold by using the combined SSB with internal standard when compared to the direct SSB.
Previously published Cu isotope data are reported relative to the reference material of NIST SRM 976, which is certified for use in Cu isotope amount ratio measurements.20–23 Unfortunately, NIST SRM 976 is no longer available, thus alternative reference materials with known isotopic composition are in urgent need for Cu isotope ratio studies in various scientific fields. Ideally, the new reference material is calibrated against NIST SRM 976 in order to obtain comparative data from different research labs. For example, the reference materials ERM-AE633 and ERM-AE647 from IRMM (Institute for Reference Materials and Measurements, Belgium) were calibrated against NIST SRM 976 for δ65Cu.22 Liu et al.24 also used GSB from the National Standard Substances of China as a new Cu standard, where the average δ65CuGSB value for Cu solutions was +0.44 ± 0.04 (2SD; n = 32) relative to NIST 976. However, the absolute isotope amount ratio of Cu in these standards was not measured.
The homogeneous quantities and proper storage of reference materials from international reference producers, such as the National Institute of Standards and Technology (NIST), the Institute for Reference Materials and Measurements (IRMM), the International Atomic Energy Agency (IAEA), or the Federal Institute for Materials Research and Testing (BAM), are guaranteed. In this study, the NIST 3114 copper standard solution was selected as a candidate Cu reference material and its absolute Cu isotope amount ratio was determined by MC-ICPMS using the regression mass bias correction model25 which is based on temporal drifts between the measured Cu and Ga isotope ratios in their log space. Note that other calibrants, such as the Zn isotopic standard, can also be used. However, Ga isotopes have no isobaric interferents and less polyatomic interferents compared to Zn isotopes. Moreover, the isotopic reference material NIST SRM 994 Ga is certified for Ga isotopic composition with high precision and accuracy, and is commercially available. Thus, it was used as the calibrant for the absolute determination of the Cu isotope ratio. The Cu isotope ratio of several common geological reference materials was determined relative to the newly characterized reference material (NIST SRM 3114) using the combined SSB and internal normalization method with the internal standard of Ga. These geological reference materials were subjected to ion exchange column separation of Cu from geological and Fe-rich matrices prior to MC-ICPMS measurements.
Experimental section
Instrumentation
All Cu isotope ratio measurements were carried out on a MC-ICPMS (Neptune Plus, Thermo Finnigan Scientific, Bremen, Germany) at the State Key Laboratory of Geological Processes and Mineral Resources, Wuhan, China. This instrument is equipped with nine Faraday cups, a spray chamber containing a Scott-type spray chamber on the top and a cyclonic spray chamber on the bottom with a MCN50 PFA self-aspirating nebulizer (Elemental Scientific, Omaha, NE, USA) operating at 50 μl min−1, which was used for Cu isotope ratio measurements in the low-resolution mode. Optimization of the Neptune was performed daily, and typical operating conditions are summarized in Table 1. The gain calibration for Faraday cups was performed daily to ensure correction for its efficiency. A quadrupole ICPMS from Agilent Technologies (Yokogawa, Japan) was used for the semi-quantitative analysis of matrix element concentrations in rinse and eluate fractions collected from column separation.| Instrument settings | ||
|---|---|---|
| Forward power | 1183 W | |
| Plasma gas flow rate | 16.0 L Ar min−1 | |
| Auxiliary gas flow rate | 0.95 L Ar min−1 | |
| Carrier gas flow rate | 1.030 L Ar min−1 | |
| Sample cone (H) | Nickel, 1.1 mm (orifice) | |
| Skimmer cone (X) | Nickel, 0.88 mm (orifice) | |
| Lens settings | Focus: −880 V; X deflection: 0.21 V; Y deflection: −0.41 V; shape: 202 V; rot quad 1: 3.00 V; foc quad 1: −19.89 V; rot quad 2: 5.78 V; source offset: 1.00 V; focus offset: 50.00 V | |
| Data acquisition parameters | |
|---|---|
| Faraday cup configuration | L4 (63Cu), L2 (65Cu), C (67Zn), H2 (69Ga), H4 (71Ga) |
| Zoom optics | Focus quad: 0 V and dispersion quad: 0 V |
| Mass resolution, m/Δm at 5 and 95% | ∼300 |
| Sensitivity | 13 V for 63Cu at 200 ng g−1 |
| Blank signal (2% HNO3) | 3 mV for 63Cu |
| Signal integration time | 4.194 s |
| No. of integrations, cycles, blocks | 1, 10, 5 |
Reagents and materials
Nitric and hydrofluoric acids were purified in-house prior to use by sub-boiling distillation of reagent grade feedstock in a DST-1000 acid purification system (Savillex, Eden Prairie, USA), and hydrochloric acid used to load samples was prepared by dilution of Suprapur® grade hydrochloric acid (Merck KGaA., Darmstadt, Germany) with DI water. High purity deionized water (DIW) 18 MΩ was obtained from a Milli-Q water system (Millipore Corp., Billerica, MA, USA). All labware, including Savillex® containers and disposable plastics, was cleaned in concentrated reagent-grade acids and deionized H2O prior to use.The candidate reference material NIST SRM 3114 Cu and the internal standard of NIST SRM 994 Ga were purchased from the National Institute of Standards and Technology (NIST, Gaithersburg, MD, USA). The gallium metal isotopic reference material, NIST SRM 994, is certified for 69Ga/71Ga = 1.50676 ± 0.00039 (U, at 95% confidence interval), determined by thermal-ionization mass spectrometry.26 A 2000 μg g−1 stock solution of NIST SRM 994 was prepared by quantitative dissolution of Ga in concentrated HNO3 and HCl with heating and then diluted with DIW. In addition, for comparison of SRM 3114 Cu to other Cu standards, a 100 μg g−1 standard solution of copper was prepared by dilution of a high-purity Cu solution of 1000 mg l−1 Cu (copper ICP standard, Merck KGaK, Darmstadt, Germany batch Cu011017) in 2% nitric acid. A 200 ng g−1 Cu (Alfa Cu A) solution was prepared by dilution of the 10![[thin space (1/6-em)]](https://www.rsc.org/images/entities/char_2009.gif) 040 μg g−1 Cu stock (Alfa Aesar, Karlsruhe, Germany; batch 23-16498C) in 2% HNO3 solution. Another Alfa Aesar Cu stock solution (Alfa Cu B) of 1000 μg g−1 was prepared by quantitative dissolution of Puratronic® Cu wire (batch 04-1792K) in HNO3 and diluted with DIW. The GSB Cu standard was obtained from the Isotope Geochemistry Laboratory of the China University of Geosciences, Beijing, China.
040 μg g−1 Cu stock (Alfa Aesar, Karlsruhe, Germany; batch 23-16498C) in 2% HNO3 solution. Another Alfa Aesar Cu stock solution (Alfa Cu B) of 1000 μg g−1 was prepared by quantitative dissolution of Puratronic® Cu wire (batch 04-1792K) in HNO3 and diluted with DIW. The GSB Cu standard was obtained from the Isotope Geochemistry Laboratory of the China University of Geosciences, Beijing, China.
Five geological reference materials of BCR-2, BHVO-2 and BIR-1a (basalts), AGV-2 (andesite) and GSP-2 (granite) purchased from the United States Geological Survey (Reston, VA, USA) were used as test samples for Cu isotope ratio measurements.
Sample preparation and analysis of the NIST SRM 3114 Cu standard for absolute Cu isotope ratio measurement
The absolute isotope ratio of the Cu standard (NIST 3114) was measured following a previous method described by Yang et al.,25 using a regression mass bias correction model with Ga as the calibrant. Replicate solutions of 200 ng g−1 Cu were prepared by diluting the Cu stock solution in 2% HNO3 followed by spiking with the gallium standard solution, yielding a mass fraction of 200 ng g−1 for Ga. Samples were introduced into MC-ICP-MS at a flow rate of 50 μl min−1. Intensities of Cu and Ga isotopes obtained from a 2% HNO3 blank solution were subtracted from those of all samples. A static run was employed to collect 63Cu and 65Cu, and 69Ga and 71Ga isotopes simultaneously using the Faraday cup configuration shown in Table 1. A total of 15 measurements were made on each sample solution and the duration of each session of measurements was about 5–6 h. Data acquisition parameters are summarized in Table 1.Geological sample preparation and analysis
Sample preparation was carried out in a metal-free clean room fitted with an HEPA-filtered air supply and laminar flow benches. 50 mg sub-samples were dissolved in 3 ml HF–HNO3 (1:1) at 190 °C for 48 h in Teflon beakers. The contents were evaporated to dryness on a hot plate at 105 °C. 1 ml of HNO3 was added to each sample and then evaporated to dryness to completely remove HF. 1 ml of 8.5 N HCl + 0.03% H2O2 solution was then added to each beaker. All beakers were placed in an oven and heated at 120 °C for 10 h. The contents were then evaporated to dryness on a hot plate at 105 °C. 0.25 ml 8.5 N HCl + 0.03% H2O2 solution was added to each beaker and the contents were evaporated to dryness. This process was repeated three times to ensure that all cations were converted to chloride species. The final residues were redissolved in 8 ml 8.5 N HCl + 0.03% H2O2 for the purification of Cu using an anion exchange resin.
Copper was separated from the matrix using a new type of anion exchange resin (AG MP-1M Bio-Rad, 100–200 mesh) and following a protocol by Maréchal et al.11 (1999) with some modifications. Instead of 7 N HCl used by Maréchal et al. 8.5 N HCl was used in this study to achieve more efficient separation of Cu from matrix elements, especially Co. The resin was first cleaned by sequential leaching twice with 10 ml of 2 N HNO3 and twice with 10 ml 2 N HCl, respectively.27,28 Columns containing 1 ml of AG MP-1M resin were cleaned and preconditioned using acidic solutions as detailed in Table 2. Most matrix elements (e.g. Na, Mg, Al, K, Ca, Ti, Cr, Ni and Mn) were eluted in the first 4 ml of 8.5 N HCl, and Cu was eluted in the following 8 ml 8.5 N HCl, leaving Co, Fe and Zn on the resin. These eluents containing Cu were evaporated to dryness on a hot plate at 105 °C and redissolved in 0.1 ml concentrated HNO3 and diluted to 4 ml with DIW.
| Separation steps | Volume of elute and acid type | Volume/ml |
|---|---|---|
| Cleaning | 2 N HNO3, 2 N HCl | 10 × 2, 10 × 2 |
| Conditioning | 8.5 N HCl + 0.03% H2O2 | 2 |
| Sample loading | 8.5 N HCl + 0.03% H2O2 | 1 |
| Matrix elution | 8.5 N HCl + 0.03% H2O2 | 4 |
| Cu elution | 8.5 N HCl + 0.03% H2O2 | 8 |
0.5 ml of purified Cu fractions were taken and diluted to 4 ml in 2% HNO3 (v/v), and were measured by ICP-MS (POEMS III ICP-MS) to obtain the total Cu concentration to check the recovery of column separation for each sample. The remaining purified Cu fractions in 2% HNO3 were spiked with Ga standard solution, yielding a concentration of 200 ng g−1. Solutions of SRM 3114 in 2% HNO3 containing similar concentrations of Cu to that in the purified BCR-2, BHVO-2, BIR-1a, AGV-2 and GSP-2 solutions, respectively, were prepared and spiked with Ga to yield a concentration of 200 ng g−1. Samples and standards were introduced into the MC-ICPMS in the following sequence: SRM 3114–sample–SRM 3114. Four replicate measurements or more of each sample solution were performed.
Results and discussion
Absolute Cu isotope ratio measurements in NIST SRM 3114
For the absolute determination of the Cu isotope ratio in NIST SRM 3114, the log-linear regression mass bias correction model was used to measure the isotope ratio of Cu in this study, in a manner similar to that used in previous studies of Cu,11 Fe,29,30 Hg,31,32 Ge,25 Ag15 and In15 isotopes. This model is based on monitoring the temporal drift in the simultaneous isotopic ratio measurements where the intercept and slope of the constructed log-linear regressions between the observed (uncorrected) isotope ratio of the measurand rCu65/63 and the calibrant rGa69/71 form the basis for the calibration of the Cu isotope ratio. The major advantage of the regression model over the traditional exponential correction model is that the regression approach is free of the requirement for identical fractionation behavior between the element pairs.25,33 In recent years, the assumption of identical mass bias for the analyte and internal standard used in the traditional exponential correction model has proven to be wrong within MC-ICPMS (fPb ≠ fTl, fHg ≠ fTl or fSr ≠ fZr, etc.)9,14–19 and thus it should not be used for the absolute ratio measurements. From our preliminary experiments, the Cu isotope ratio measured in a 15 ng g−1 Cu standard solution of SRM 3114 was found to be significantly different from that measured in a 700 ng g−1 Cu standard solution of SRM 3114 using the traditional exponential mass bias correction model with Ga as an internal standard (eqn (4)), confirming that mass bias for Ga and Cu is not identical. Additionally, the regression model is not hampered by the untestable assumption regarding the very nature of the fractionation (linear, exponential, etc.) since it is based on measured raw data, but the measurement time required for the regression model is longer. Eqn (1) forms the basis for the Cu isotope ratio calibration with Ga as the calibrant:18,25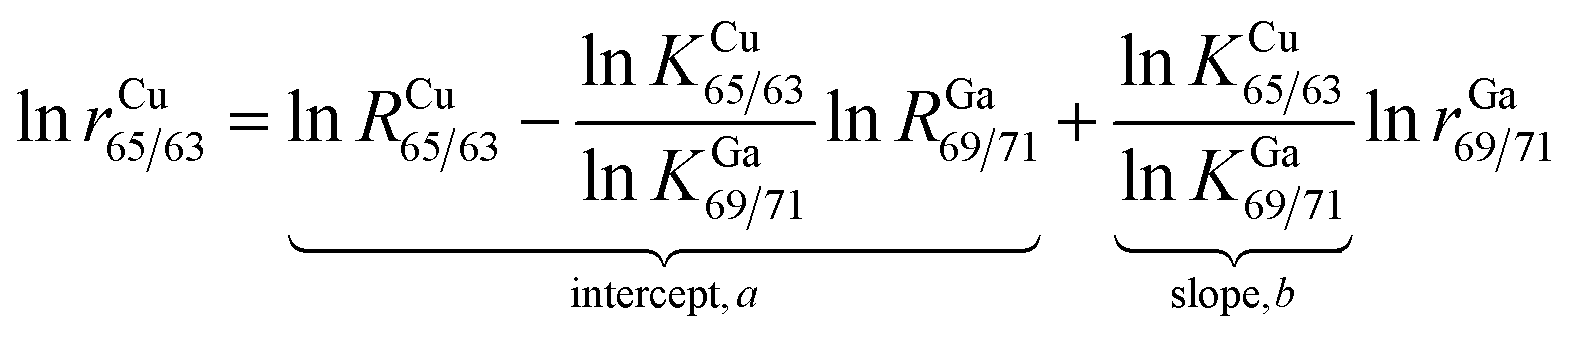 | (1) |
| RCu65/63 = (RGa69/71)bea | (2) |
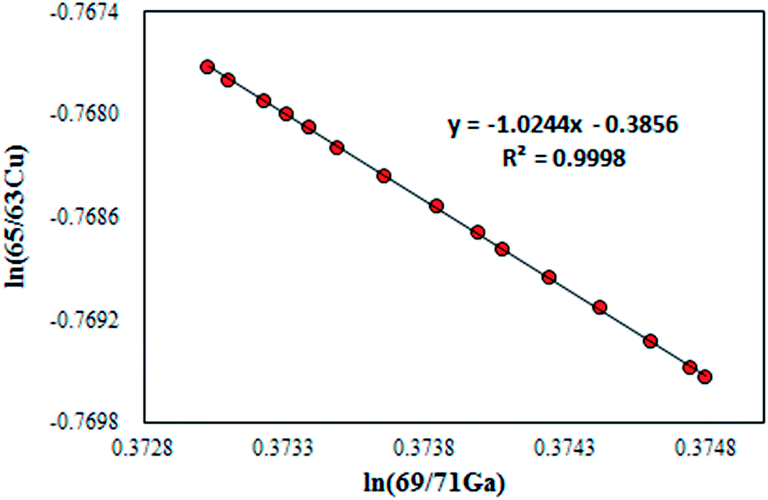 | ||
| Fig. 1 Temporal drift of the copper and gallium isotope ratios during a 6 h measurement session. The log-linear regression plot is the basis for calibration of the copper isotope ratio via the RGa69/71 certified reference value (NIST SRM 994). | ||
In this work, the NIST certified value26 of 1.50676(39)95% was used for RGa69/71 to obtain the mass bias corrected RCu65/63. Although eqn (2) resembles the traditional exponential mass-bias correction in its appearance, the underlying logic is not the same.14,25 This “regression” approach is capable of generating accurate isotope ratio results as demonstrated in previous studies,15,25,31,34 however, it suffers from poorer precision due to the need for linear regression fitting to generate the slope and intercept, which are subsequently used to calculate the mass bias corrected analyte ratio. To reduce the uncertainty associated with this process, the number of measurement sessions should be increased.14 During a six-month period between December 2013 and June 2014, many sets of isotope ratio log-linear regressions were acquired for 65Cu/63Cu vs.69Ga/71Ga, each yielding the respective intercept and slope. Of these, 37 high-quality sets exhibiting a coefficient of determination larger than 0.999 (R2 ≥ 0.999) were selected for calculation of the final results. The mass bias corrected Cu isotope ratio of 0.4470 ± 0.0013 (2SD, n = 37) was obtained.
Comparison of SRM 3114 to other Cu standards
As mentioned above, previously published Cu isotope data are reported relative to the reference material of NIST SRM 976, which is certified for Cu isotope amount ratio measurements.24,35–39 Unfortunately, this reference material is no longer available. In order to compare results of the Cu isotope ratio generated from different research labs, it is essential to compare the Cu isotope ratio value of SRM 3114 to other Cu standards or an internationally accepted common standard material. Delta notation (δ) for the Cu isotope ratio is thus employed relative to SRM 3114 in accordance with: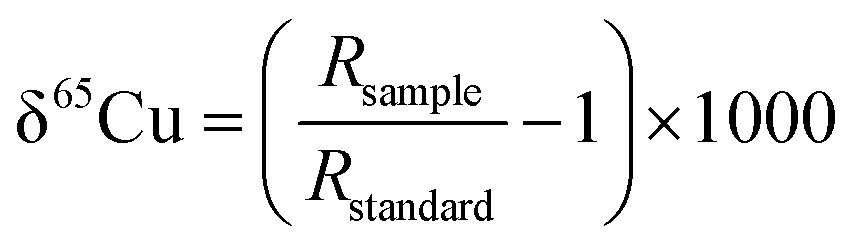 | (3) |
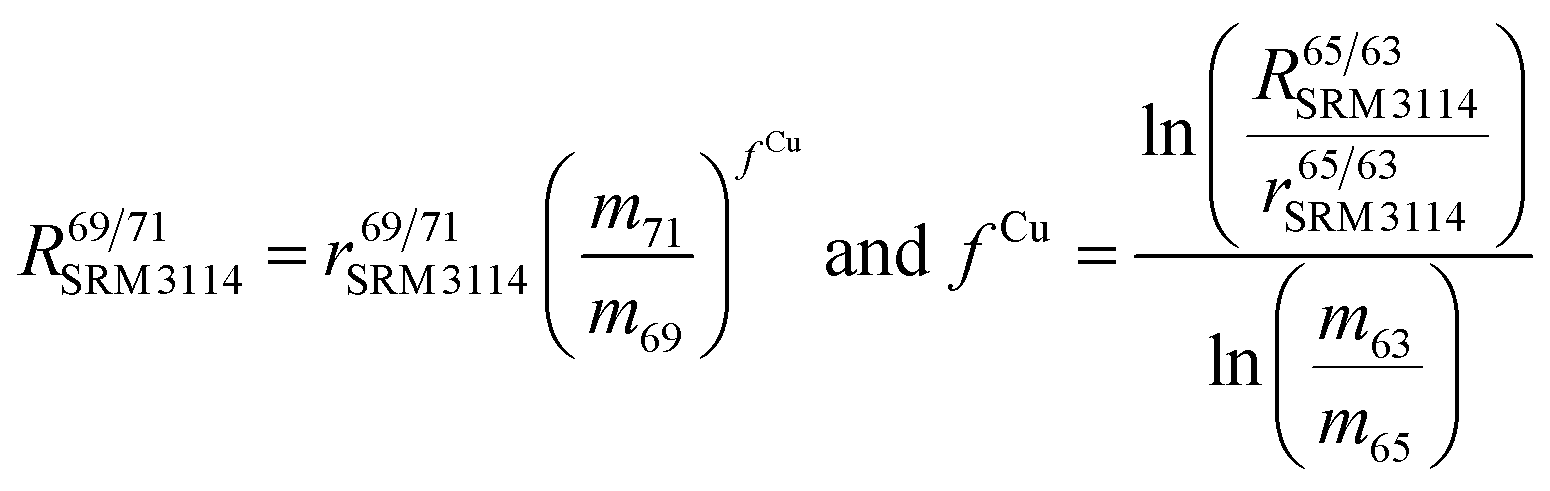
To correct mass bias, a combined standard sample bracketing and internal normalization method (C-SSBIN) is used in this study. Ga is used as the internal standard and added to both sample and standard solutions, a variation of the methodology as typically used for other isotope systems.14–19 However, this mass bias correction model still requires matching of the analyte concentration in the sample and standard solutions.24 Thus in this study, concentrations of the analyte and the internal standard in the sample and standard were matched within 10% to ensure accurate measurement results. To the best of our knowledge, this is the first report implementing this C-SSBIN mass bias correction model with the use of Ga as the internal standard for the determination of the Cu isotope ratio. The obtained absolute value of 0.4470 ± 0.0013 (2SD, n = 37) for 65Cu/63Cu in SRM 3114 was used to calculate mass bias corrected ratios of 69Ga/71Ga in two adjacent bracketing standard solutions of SRM 3114 in accordance with eqn (4) of Russell's law:40,41
 | (4) |
 | (5) |
Results from the measurements of an Alfa Cu (A) standard solution relative to NIST SRM 3114 using direct SSB (Fig. 2a) and C-SSBIN (Fig. 2b) mass bias correction models, respectively, are presented in Fig. 2. The results were acquired over a period of four days. Values of 0.22 ± 0.05‰ (2SD, n = 10) and 0.20 ± 0.01‰ (2SD, n = 10) for δ65Cu in Alfa Cu (A) relative to the NIST 3114 standard were obtained with the use of direct SSB and C-SSBIN for mass bias correction, respectively. Clearly both mass bias models could generate accurate results for δ65Cu, but an approximately five-fold improvement in precision of the determination of δ65Cu was obtained with the use of the proposed C-SSBIN mass bias correction approach compared to that obtained solely using the SSB approach. Based on this observation, the C-SSBIN mass bias correction approach was thus selected for all subsequent measurements. A value of 0.06 ± 0.03‰ (2SD, n = 6) for δ65Cu in Alfa Cu (B) relative to the NIST 3114 standard was obtained. The long-term reproducibility of Alfa Cu (A) was 0.01‰ (2 SD, n = 32). Hence, both standards of Alfa Cu (A) and Alfa Cu (B) may be used as in-house standards for quality control.
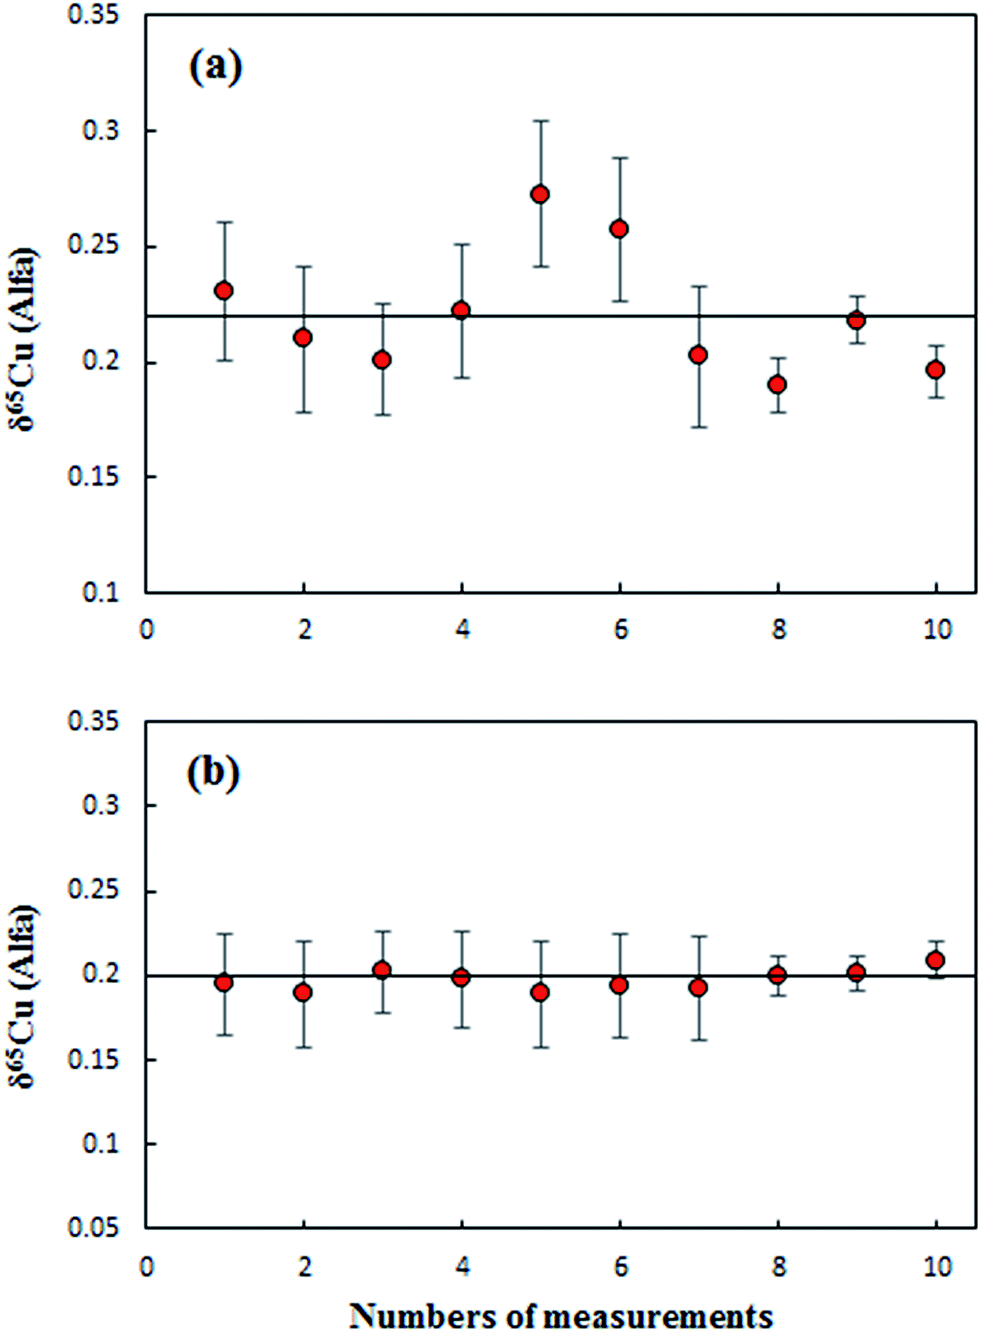 | ||
| Fig. 2 Comparison of two mass bias correction models for the determination of the 65Cu/63Cu ratio in the Alfa Cu standard, error bars are 2SD. (a) Direct SSB mass bias correction approach; (b) proposed C-SSBIN mass bias correction approach. | ||
The GSB Cu (>99.99%) standard was measured against the SRM 3114 using the C-SSBIN for mass bias correction, and a value of +0.27 ± 0.02‰ (2SD, n = 6) for δ65Cu was obtained, in agreement with the value of +0.26 ± 0.04‰ (2SD, n = 5) measured by the Isotope Geochemistry Laboratory of the China University of Geosciences, Beijing, China. Liu et al.24 reported a value of +0.44 ± 0.04‰ (2SD, n = 32) for δ65CuGSB in GSB Cu relative to NIST SRM 976. Based on these results, a δ65Cu value of +0.18 ± 0.02‰ (2SD, n = 6) relative to NIST SRM 976 for NIST 3114 is thus calculated.
Since NIST SRM 3114 is commercially available and now with the absolute Cu isotope ratio determined, we recommend the use of this material over SRM 976 for future Cu isotopic studies. Based on the study by Moeller et al.22 wherein the δ65/63Cu isotope ratio of NIST SRM 976 was determined against ERM-AE633 and ERM-AE647 Cu reference standards and values of −0.01 ± 0.05‰ (2SD, n = 40) and −0.21 ± 0.05‰ (2SD, n = 60) were obtained, respectively. Alternatively, the two Cu standards, ERM-AE633 and ERM-AE647, can also be used as new certified reference materials for future Cu isotopic studies. Regardless of which Cu standard is selected, we strongly recommend reporting final Cu isotope ratio data relative to NIST SRM 976 by using available δ65/63Cu values between these four Cu standards of NIST SRM 976, SRM 3114, IRMM ERM-AE633 and ERM-AE647 for calculations, in order to obtain comparable results from different research labs.
Matrix separation
As noted earlier, the CSSBIN mass bias correction model and other correction models require matrix matching between the sample and the standard solutions to ensure accuracy. Since it is practically impossible to match all matrix elements between a sample (e.g. geological samples) and a standard solution, separation of matrix elements is the method of choice. It is widely recognized that non-quantitative recovery of analytes during such a process may result in isotope fractionation,43,44 and quantitative recovery (above 95%) of analytes is thus required to ensure accurate results. Recovery was thus checked for every geological sample by ICP-MS and a value of 100 ± 2% (2 SD, n = 15) was obtained for these samples.The collected Cu fractions in 2% HNO3 solution were examined by semi-quantitative analysis to check the efficiency of matrix separation. Concentrations of concomitants were significantly reduced and only a few matrix elements (i.e., Na, Fe, Co and Ti) remained at levels greater than 0.01 (expressed as the ratio of the individual matrix element concentration to the Cu concentration in the purified digests). These matrix elements not only potentially generate polyatomic interferents such as 23Na40Ar+, 23Na216O1H, 23Na218O1H+, 47Ti16O+, 46Ti16O1H+, 49Ti16O+, 48Ti16O1H+on 63Cu and 65Cu, but also induce matrix effects, which could bias the final results. Thus the effects of Na, Fe, Co and Ti on δ65Cu were investigated by examining 0.2 μg g−1 Cu standard solutions of NIST SRM 3114 in the presence of various amounts of Na, Fe, Co and Ti, relative to a pure 0.2 μg g−1 Cu standard solution of SRM 3114. Measured intensities for Ga isotopes in the 2% HNO3 solution and in the purified Cu fractions (prior to being spiked with the Ga internal standard) were at background levels of <0.0001 V, confirming insignificant polyatomic interferents of 40Ar29Si+ and 40Ar15N16O+ on 69Ga and 71Ga.
Fig. 3 shows the effect of Na on δ65Cu. It is evident that when the concentration ratio of Na/Cu is less than 0.5, no significant effect on δ65Cu is observed. In this study, the measured concentration ratios of Na/Cu in purified digests were found to be less than 0.05, therefore the influence of Na+ on the final Cu isotope ratios can be neglected.
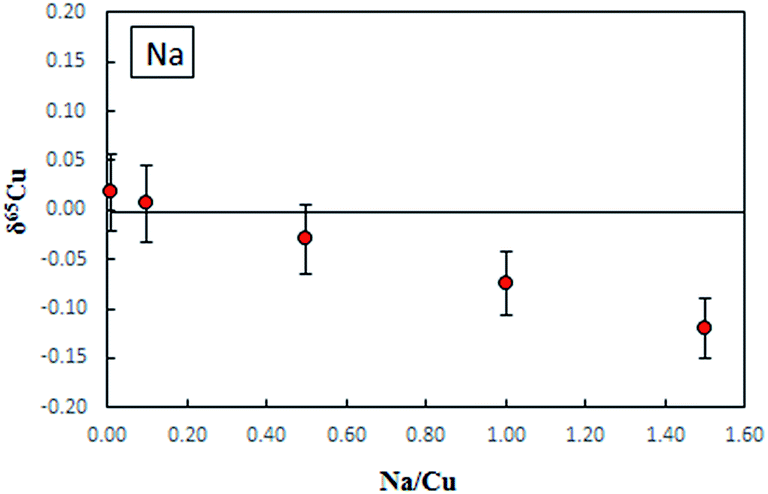 | ||
| Fig. 3 The effect of Na on δ65Cu measured in NIST SRM 3114 Cu standard solutions spiked with different amounts of Na, error bars are 2SD. C-SSBIN mass bias correction approach was used. | ||
The matrix effects of Fe and Co on the 65Cu/63Cu ratio measured are presented in Fig. 4. No significant effect was observed on δ65Cu during the tested range of the concentration ratio of Fe/Cu from 1 to 20, as shown in Fig. 4a. Since the measured concentration ratios of Fe/Cu in purified digests were less than 15, the influence of Fe on the final Cu isotope ratio can be neglected. Unlike iron, the effect of Co on δ65Cu became significant when the Co/Cu ratio increased to 1. The Co/Cu ratio was found to be less than 0.02 in the purified digests, confirming no significant effect on the final δ65Cu values.
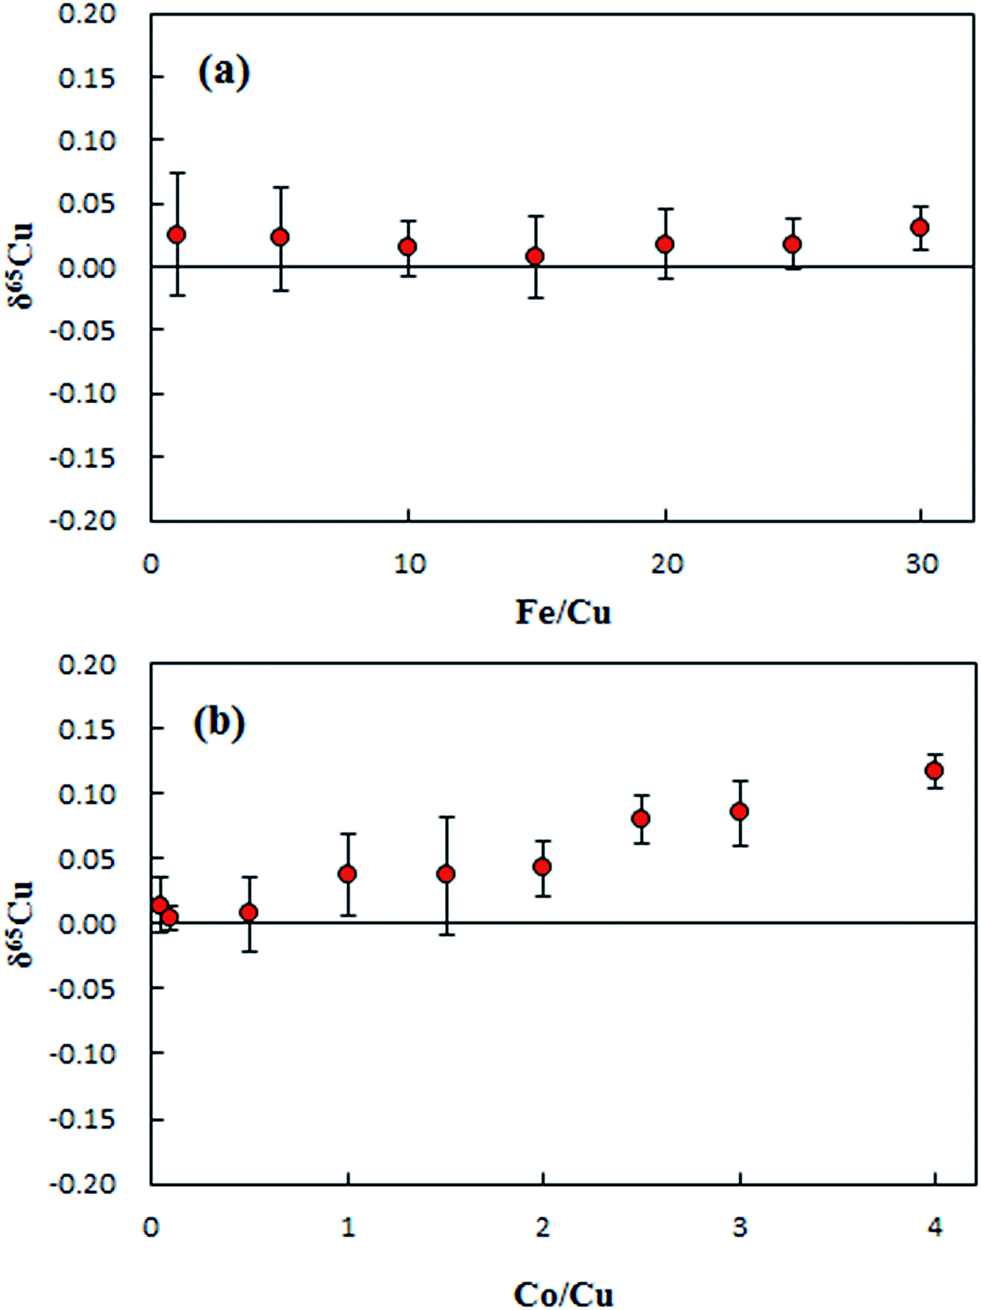 | ||
| Fig. 4 Assessment of effects of Fe (a) and Co (b) contents on δ65Cu measurements, error bars are 2SD. The errors (2SD) were calculated based on four times replicate measurements. C-SSBIN mass bias correction approach was used. | ||
The residual Ti content in the range of 0–1.0 for the concentration ratio of Ti/Cu was found in the purified digests. Based on the relative isotope abundance of Ti, polyatomic interferents of 47Ti(7.44%)16O+ and 46Ti(8.25%)16O1H+ on 63Cu; 49Ti(5.41%)16O+ and 48Ti(73.72%)16O1H+ on 65Cu would induce the measured δ65Cu towards a higher value. As shown in Fig. 5a, measured δ65Cu values in SRM 3114 solutions spiked with various amounts of Ti increased significantly as the Ti concentration increased. Since the residual Ti contents in the purified geological digests have a significant effect on δ65Cu, correction for such interferents remains essential. Instead of performing a second chemical separation, the bracketing standard SRM 3114 solution was doped with the same amount of Ti as in the purified geological digests. As shown in Fig. 5b, accurate δ65Cu values can be obtained when the matrix is matched for Ti for both the sample and the bracketing standard. Thus for the determination of δ65Cu in purified geological digests, each bracketing standard solution of SRM 3114 was doped with the same amount of Ti in each purified digest to achieve accurate δ65Cu measurements.
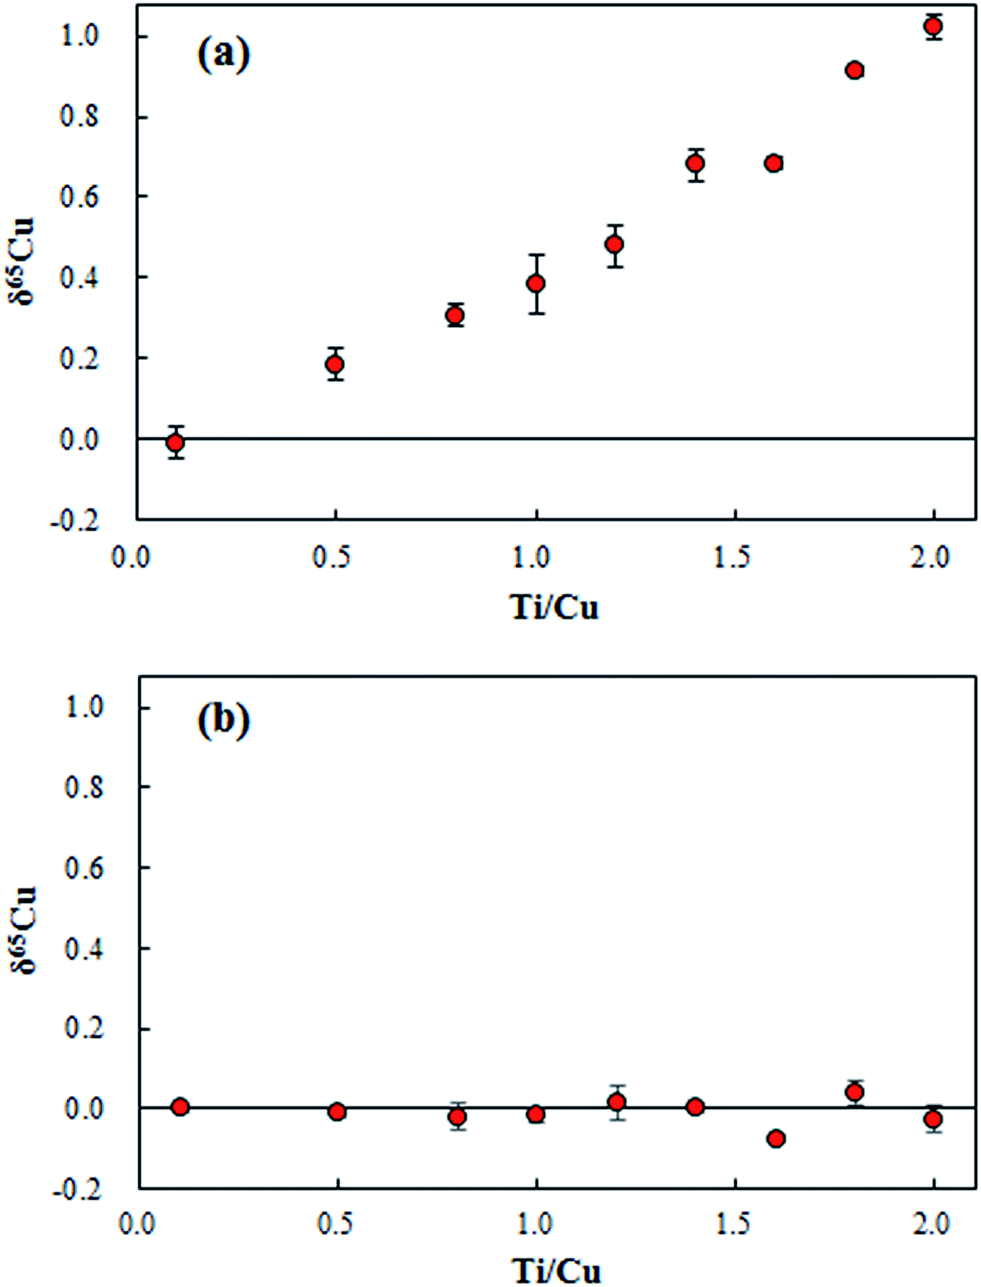 | ||
| Fig. 5 The effect of Ti concentration on δ65Cu, error bars are 2SD. (a): SRM 3114 solutions containing 0.2 μg g−1 Cu spiked with different amounts of Ti relative to the pure SRM 3114 0.2 μg g−1 Cu solution; (b): SRM 3114 solutions containing 0.2 μg g−1 Cu and different amounts of Ti measured against themselves, respectively. C-SSBIN mass bias correction approach was used. | ||
Results for geological reference materials
A total process blank of 2 ng was found for Cu, typically less than 1–2% of Cu found in the purified geological sample digests. Nevertheless, intensities of all measured isotopes obtained from the process blank were subtracted from those of all samples. Results for Cu isotope ratios in five geological reference materials are summarized in Table 3. Based on the δ65Cu value of +0.18 ± 0.02‰ (2SD, n = 6) for NIST 3114 relative to NIST SRM 976 calculated previously, final results for δ65Cu in the geological reference materials were converted relative to SRM 976 for comparison. The δ65Cu values for basaltic reference materials (BCR-2, BHVO-2 and BIR-1a) as well as for andesite (AGV-2) and granodiorite (GSP-2) spanned over a rather narrow range between 0.01 and 0.26‰ relative to NIST SRM 976. All results are in good agreement with previously determined Cu isotope ratio data of these reference materials,35–39 confirming the accuracy of the proposed method.| Sample name | δ65Cu relative to SRM 3114 | δ65Cu relative to SRM 976 | Reporteda | Sources |
|---|---|---|---|---|
| a The reported values of δ65Cu were calculated relative to SRM 976. | ||||
| BCR-2 | 0.00 ± 0.04 (n = 20) | 0.18 ± 0.04 (n = 20) | 0.22 ± 0.05 | Bigalke et al. (2010a)35 |
| 0.22 ± 0.04 | Liu et al. (2014)24 | |||
| 0.18 ± 0.09 | Bigalke et al. (2011)36 | |||
| 0.16 ± 0.04 | Tang et al. (2012)37 | |||
| BHVO-2 | −0.05 ± 0.04 (n = 9) | 0.13 ± 0.04 (n = 9) | 0.10 ± 0.07 | Moynier et al. (2010)21 |
| 0.15 ± 0.05 | Liu et al. (2014)24 | |||
| AGV-2 | −0.10 ± 0.03 (n = 6) | 0.08 ± 0.03 (n = 6) | 0.05 ± 0.04 | Liu et al. (2014)24 |
| 0.10 ± 0.10 | Weinstein et al. (2011)38 | |||
| BIR-1a | −0.17 ± 0.06 (n = 4) | 0.01 ± 0.06 (n = 4) | 0.00 ± 0.05 | Liu et al. (2014)24 |
| 0.027 ± 0.019 | Tang et al. (2012)37 | |||
| GSP-2 | 0.08 ± 0.04 (n = 7) | 0.26 ± 0.04 (n = 7) | 0.30 ± 0.04 | Liu et al. (2014)24 |
| 0.25 ± 0.03 | Bigalke et al. (2010a)35 | |||
| 0.35 ± 0.06 | Bigalke et al. (2010b)39 | |||
Conclusion
A method is presented for the first time for the absolute determination of the Cu isotope ratio in NIST SRM 3114, wherein the isotopic ratio was calibrated using the regression mass bias correction model with NIST SRM 944 Ga as the calibrant. A value of 0.4470 ± 0.0013 (2SD, n = 37) for the 65Cu/63 ratio was obtained for NIST SRM 3114 with a value of +0.18 ± 0.04‰ (2SD, n = 5) for δ65Cu in NIST SRM 3114 relative to NIST 976. Based on the above values, NIST SRM 3114 is recommended to be a candidate reference material for future Cu isotope ratio studies.Moreover, an accurate and precise method has been developed for the determination of the Cu isotope ratio in geological samples by MC-ICPMS using the modified mass bias correction approach comprising standard-sample bracketing and internal normalization. To the best of our knowledge, this is the first report implementing this C-SSBIN mass bias correction model with the use of Ga as the internal standard for the determination of the Cu isotope ratio. An approximately five-fold improvement in precision of the determination of δ65Cu was obtained with the use of the proposed C-SSBIN mass bias correction approach compared to that obtained solely using the SSB approach. The proposed method is expected to have applications for Cu isotope ratio measurements in the study of hydrothermal ore-forming processes, paleo-oceanography, and biological processes.
Acknowledgements
This study has been supported financially by the National Natural Science Foundation of China (nos 41273005, 41073007), the Ministry of Education of China (IRT0441 and B07039), and the special fund from the State Key Laboratory of Geological Processes and Mineral Resources (GPMR201106).References
- E. C. Walker, F. Cuttitta and F. E. Senftle, Geochim. Cosmochim. Acta, 1958, 15, 183–194 CrossRef CAS.
- W. R. Shields, S. S. Goldich, E. L. Garner and T. J. Murphy, J. Geophys. Res., 1965, 70, 479–491 CrossRef CAS.
- G. Markl, Y. Lahaye and G. Schwinn, Geochim. Cosmochim. Acta, 2006, 70, 4215–4228 CrossRef CAS.
- X. K. Zhu, R. K. O, Nions, Y. Guo, N. S. Belshaw and D. Rickard, Chem. Geol., 2000, 163, 139–149 CrossRef CAS.
- P. B. Larson, K. Maher, F. C. Ramos, Z. Chang, M. Gaspar and L. D. Meinert, Chem. Geol., 2003, 201, 337–350 CrossRef CAS.
- T. F. D. Mason, D. J. Weiss, M. Horstwood, R. R. Parrish, S. S. Russell, E. Mullane and B. J. Coles, J. Anal. At. Spectrom., 2004a, 19, 209–217 Search PubMed.
- F. Albarède, P. Telouk, J. Blichert-Toft, M. Boyet, A. Agranier and B. Nelson, Geochim. Cosmochim. Acta, 2004, 68, 2725–2744 CrossRef.
- G. Peers and N. M. Price, Nature, 2006, 441, 341–344 CrossRef CAS PubMed.
- L. Yang, Mass Spectrom. Rev., 2009, 28, 990–1011 CrossRef CAS PubMed.
- J. Luck, D. B. Othman and F. Albarède, Geochim. Cosmochim. Acta, 2005, 69, 5351–5363 CrossRef CAS.
- C. N. Maréchal, P. Télouk and F. Albarède, Chem. Geol., 1999, 156, 251–273 CrossRef.
- C. Maréchal and F. Albarède, Geochim. Cosmochim. Acta, 2002, 66, 1499–1509 CrossRef.
- T. F. Mason, D. J. Weiss, M. Horstwood, R. R. Parrish, S. S. Russell, E. Mullane and B. J. Coles, J. Anal. At. Spectrom., 2004b, 19, 218–226 Search PubMed.
- J. Meija, L. Yang, R. E. Sturgeon and Z. Mester, J. Anal. At. Spectrom., 2010, 25, 384–389 RSC.
- L. Yang, R. E. Sturgeon, Z. Mester and J. Meija, Anal. Chem., 2010, 82, 8978–8982 CrossRef PubMed.
- L. Yang, C. Peter, U. Panne and R. E. Sturgeon, J. Anal. At. Spectrom., 2008, 23, 1269–1274 RSC.
- L. Yang, Z. Mester, L. Zhou, S. Gao, R. E. Sturgeon and J. Meija, Anal. Chem., 2011, 83, 8999–9004 CrossRef CAS PubMed.
- J. Irrgeher, T. Prohaska, R. E. Sturgeon, Z. Mester and L. Yang, Anal. Methods, 2013, 5, 1687–1694 RSC.
- D. C. Baxter, I. Rodushkin, E. Engström and D. Malinovsky, J. Anal. At. Spectrom., 2006, 21, 427–430 RSC.
- J. J. Cai, X. K. Zhu, S. H. Tang, X. X. He and S. Z. Li, Acta Geosci. Sin., 2005, 26, 26–29 Search PubMed.
- F. Moynier, C. Koeberl, P. Beck, F. Jourdan and P. Telouk, Geochim. Cosmochim. Acta, 2010, 74, 799–807 CrossRef.
- K. Moeller, R. Schoenberg, R. Pedersen, D. Weiss and S. Dong, Geostand. Geoanal. Res., 2012, 36, 177–199 CrossRef.
- R. Roehl, J. Gomez and L. R. Woodhouse, J. Anal. At. Spectrom., 1995, 10, 15–23 RSC.
- S. A. Liu, L. D. S. Li, F. Z. Teng, S. Ke, Y. He and Y. Lu, J. Anal. At. Spectrom., 2014, 29, 122–133 RSC.
- L. Yang and J. Meija, Anal. Chem., 2010, 82, 4188–4193 CrossRef CAS PubMed.
- L. A. Machlan, J. W. Gramlich, L. J. Powell and G. M. Lambert, J. Res. Natl. Bur. Stand., 1986, 91, 323–331 CrossRef CAS.
- B. J. A. Willigers, J. A. Baker, E. J. Krogstad and D. W. Peate, Geochim. Cosmochim. Acta, 2002, 66, 1051–1066 CrossRef CAS.
- F. Poitrasson and R. Freydier, Chem. Geol., 2005, 222, 132–147 CrossRef CAS.
- K. Kehm, E. H. Hauri, C. M. O. D. Alexander and R. W. Carlson, Geochim. Cosmochim. Acta, 2003, 67, 2879–2891 CrossRef CAS.
- G. L. Arnold, S. Weyer and A. D. Anbar, Anal. Chem., 2004, 76, 322–327 CrossRef CAS PubMed.
- L. Yang and R. E. Sturgeon, Anal. Bioanal. Chem., 2009, 393, 377–385 CrossRef CAS PubMed.
- Q. Xie, S. Lu, D. Evans, P. Dillon and H. Hintelmann, J. Anal. At. Spectrom., 2005, 20, 515–522 RSC.
- D. J. Weiss, B. Kober, A. Dolgopolova, K. Gallagher, B. Spiro, G. Le Roux, T. F. D. Mason, M. Kylander and B. J. Coles, Int. J. Mass Spectrom., 2004, 232, 205–215 CrossRef CAS.
- W. M. White, F. Albarède and P. Télouk, Chem. Geol., 2000, 167, 257–270 CrossRef CAS.
- M. Bigalke, S. Weyer and W. Wilcke, Soil Sci. Soc. Am. J., 2010, 74, 60–73 CrossRef CAS.
- M. Bigalke, S. Weyer and W. Wilcke, Geochim. Cosmochim. Acta, 2011, 75, 3119–3134 CrossRef CAS.
- S. H. Tang, B. Yan, X. K. Zhu, J. Li and S. H. Li, Rock Miner. Anal., 2012, 31, 218–224 CAS.
- C. Weinstein, F. Moynier, K. Wang, R. Paniello, J. Foriel, J. Catalano and S. Pichat, Chem. Geol., 2011, 286, 266–271 CAS.
- M. Bigalke, S. Weyer, J. Kobza and W. Wilcke, Geochim. Cosmochim. Acta, 2010, 74, 6801–6813 CrossRef CAS.
- S. Pichat, C. Douchet and F. Albarède, Earth Planet. Sci. Lett., 2003, 210, 167–178 CrossRef CAS.
- C. P. Ingle, B. L. Sharp, M. S. Horstwood, R. R. Parrish and D. J. Lewis, J. Anal. At. Spectrom., 2003, 18, 219–229 RSC.
- J. R. de Laeter, J. K. Böhlke, P. De Bièvre, H. Hidaka, H. S. Peiser, K. Rosman and P. Taylor, Pure Appl. Chem., 2003, 75, 683–800 CrossRef CAS.
- M. E. Wieser, J. R. De Laeter and M. D. Varner, Int. J. Mass Spectrom., 2007, 265, 40–48 CrossRef CAS.
- K. Irisawa and T. Hirata, J. Anal. At. Spectrom., 2006, 21, 1387–1395 RSC.
| This journal is © The Royal Society of Chemistry 2016 |