
 Open Access Article
 This Open Access Article is licensed under a Creative Commons Attribution-Non Commercial 3.0 Unported Licence
Assessment of predictive models for estimating the acute aquatic toxicity of organic chemicals†
Fjodor
Melnikov
a,
Jakub
Kostal
bc,
Adelina
Voutchkova-Kostal
c,
Julie B.
Zimmerman
ad and
Paul
T. Anastas
*ad
aSchool of Forestry and Environmental Studies, Yale University, New Haven, CT 06520, USA. E-mail: paul.anastas@yale.edu
bComputational Biology Institute, the George Washington University, Washington DC, USA
cDepartment of Chemistry, the George Washington University, Washington, DC, USA
dDepartment of Chemical and Environmental Engineering, Yale University, New Haven, CT 06520, USA
First published on 25th May 2016
Abstract
In silico toxicity models are critical in addressing experimental aquatic toxicity data gaps and prioritizing chemicals for further assessment. Currently, a number of predictive in silico models for aquatic toxicity are available, but most models are challenged to produce accurate predictions across a wide variety of functional chemical classes. Appropriate model selection must be informed by the models’ applicability domain and performance within the chemical space of interest. Herein we assess five predictive models for acute aquatic toxicity to fish (ADMET Predictor™, Computer-Aided Discovery and REdesign for Aquatic Toxicity (CADRE-AT), Ecological Structure Activity Relationships (ECOSAR) v1.11, KAshinhou Tool for Ecotoxicity (KATE) on PAS 2011, and Toxicity Estimation Software Tool (TEST) v.4). The test data set was carefully constructed to include 83 structurally diverse chemicals distinct from the training data sets of the assessed models. The acute aquatic toxicity models that rely on properties related to chemicals’ bioavailability or reactivity performed better than purely statistical algorithms trained on large sets of chemical properties and structural descriptors. Most models showed a marked decrease in performance when assessing insoluble and ionized chemicals. In addition to comparing tool accuracy and, this analysis provides insights that can guide selection of modeling tools for specific chemical classes and help inform future model development for improved accuracy.
Introduction
To protect human health and the environment from exposure to anthropogenic chemicals, global regulations have called for systematic testing of potential environmental contaminants, such as industrial chemicals and pharmaceuticals.1–3 The rapidly growing number of chemicals in commerce presents challenges to traditional ecotoxicity testing strategies, which are expensive, time-consuming and reliant on large number of animal subjects,4 especially in light of new EU legislation to phase out animal testing.5 Furthermore, existing ecotoxicity assessment methods may be inadequate when assessing novel compounds, such as flame retardants, pharmaceuticals, and nanomaterials.6To mitigate the challenges associated with in vitro and in vivo toxicity testing, global regulations, including European Chemical Agency (ECHA) REACH initiative, U.S. Toxic Substances Control Act (TSCA) and Canadian Environmental Protection Act (CEPA), encourage increased reliance on in silico approaches.1,7 Similarly, the 2014 National Research Council (NRC) alternatives assessment framework advocates for increased use of in silico methods.8 While not necessary definitive, in silico models can also inform prioritization of chemicals for further testing.5,7,9–12 The development of reliable in silico models for aquatic toxicity relies on availability of high-quality toxicity data for a range of fish species. Office of Chemical Safety and Pollution Prevention (OCSPP) outlined a list of fish species approved for measuring or estimating toxicity to specific organisms and aquatic systems as a whole.13–15
The cost-benefit advantages and regulatory support of in silico methods,16,17 have led to the development of a number of tools for ecotoxicity assessments. Specifically, several Quantitative Structure–Activity Relationships (QSARs), which relate chemical's structural features and physicochemical properties to biological activity, and read-across models, which estimate the toxicity of chemical by comparison to structurally similar compounds have been developed for chemical toxicity to fish and are widely used for ecological risk assessment.7,8 Such tools include the Ecological Structure Activity Relationships (ECOSAR), Kashinhou Tool for Ecotoxicity (KATE) and Toxicity Estimation Software Tool (TEST), which are freely available standalone packages. Ecological Structure Activity Relationships (ECOSAR) and Toxicity Estimation Software Tool (TEST) were developed by the US EPA and the Syracuse Research Corporation,13 while KATE is a product of The Japanese Ministry of the Environment and the Japanese National Institute for Environmental Studies (NIES).18 ECOSAR and KATE rely on octanol-water partitioning coefficient to estimate fish toxicity via series of linear regression models, while TEST uses a large number of structural and electrotopological properties to estimate acute fish toxicity via a number of statistical algorithms.19 Another tool of interest, ADMET, developed by Simulation Plus,20 relies on a range of chemical properties to estimate acute aquatic toxicity using neural networks. CADRE-Aquatic Toxicity (CADRE-AT) uses a small number of mechanistically-relevant reactivity and bioavailability parameters to predict a category of concern for both acute and chronic aquatic toxicity. CADRE-AT is an extension of a set of heuristic rules for molecular design of chemicals with minimal aquatic toxicity that are based on physicochemical properties and reactivity parameters.21–23 In addition to assessment, CADRE-AT is aimed at helping chemists design (or re-design) compounds in order to minimize likelihood of high concern for aquatic toxicity. Unlike other tools in this evaluation, CADRE-AT is computationally intensive, requiring the use of high-performance computing clusters.23
To ensure model quality and regulatory relevance, the Organization for Economic Cooperation and Development (OECD) created a set of guidelines for model development that require external validation metrics, clear applicability domains, and mechanistic relevance to the modeled biochemical processes.24 Despite these guidelines, lack of external validations and model performance outside the training sets remain a major concern.4,25,26 While clear applicability domain definition ensures that the model assumptions are met and provides a measure of prediction confidence,24,27–29 model overfitting and poor applicability domain definitions may lead to low external prediction accuracy in spite of the high accuracy in the model training set.29–32 Previous validation efforts have suggested that model accuracy for a range of aquatic toxicity endpoints decreases during validation.18,33–37 However, these studies either did not conduct a strictly external validation, relied on small data sets, or evaluated one tool at a time.
This study presents a systematic assessment of the widely used and recently developed software tools to predict acute aquatic toxicity to fish and provides insights into the applicability, accuracy and ease of use (e.g., speed, convenience, and the level of expert knowledge required) of these models. Unlike prior research in the area, the test set used in this evaluation is distinct from the training sets of all evaluated tools. Thus, the assessment gives a common benchmark for model performance and further development. Since best practices in model development dictate that independent variables should be empirically relevant to target endpoints,29 special attention is given to chemical properties considered by each program and their relevance to the current understanding of fish toxicity modes of action (MOAs).
Material and methods
Validation dataset
Systematic and rigorous model evaluation requires reliable experimental data that was not used for model training.31 As such, acute aquatic toxicity experimental thresholds (LC50) were extracted from the EPA ECOTOX database.38 The data was filtered to eliminate compounds that were used in the training sets of the five in silico models being analyzed. Studies that did not meet the OECD testing guidelines were eliminated; data from OECD accepted freshwater fish species and any of the 4 accepted time points (48 h, 72 h, 96 h, 120 h) were considered. The 83 chemicals carried forward for analysis included aldehydes, halides, phenols, alcohols, ketones, aliphatic amines, amides, anilines, esters, and neutral organics functional chemical classes (Tables 1 and S1†). Chemical classes were identified by intrinsic, structural properties and subunits. The resulting classifications aims to reflect the types of chemical interaction and chemical function exerted from the structure.13 Overall, the data showed high correlations between LC50 measurements at different time intervals regardless of the test species (Fig. S1†). This observation is aligned with the most recent US EPA approach to aquatic toxicity prediction, which uses a single time interval and does not distinguish among freshwater fish species when predicting toxicity.13| Chemical ID | Experimental data | Predicted toxicity | |||||||||||||
|---|---|---|---|---|---|---|---|---|---|---|---|---|---|---|---|
| ADMET | CADRE-AT | ECOSAR | KATE | TEST | |||||||||||
| Chemical name | Chemical classa | LC50b | Cat | LC50 | CP | Cat | CP | LC50 | AD | CP | LC50 | AD | CP | LC50 | CP |
| a Chemical class as identified by ECOSAR tool; Cat – regulatory category (1–4); AD – indicated whether the chemical is in the applicability domain; CP? – indicates correct and incorrect predictions based on regulatory categories; NA – not available. b Notes about the LC50 measurements. | |||||||||||||||
| (17beta)Estra-1,3,5(10)triene-3,17-diol | Phenols | 1.55 | 2 | 0.797 | No | 2 | Yes | 1.58 | Yes | Yes | 8.35 | No | Yes | 0.650 | No |
| 5-Fluoro-2,4(1H,3H)pyrionidinedione | Carbonyl Ureas | 2420 | 4 | 1840 | Yes | 4 | Yes | 590 | Yes | Yes | NA | NA | NA | NA | NA |
| 2-Bromo-2-nitro-1,3-propanediol | Halo Alcohols | 27.6 | 2 | 660 | No | 2 | Yes | 778 | Yes | No | 3230 | No | No | 273 | No |
| 1-(4-Chlorobenzoyl)-5-methoxy-2-methyl-1H-indole-3-acetic acid | Pyrazoles/pyrroles -acid | 81.9 | 2 | 0.761 | No | 2 | Yes | 0.878 | Yes | No | 2.32 | No | Yes | 0.440 | No |
| (2S,5R,6R)-6-[[(2R)-2-Amino-2-phenylacetyl]amino]-3,3-dimethyl-7-oxo-4-thia-1-azabicyclo[3.2.0]heptane-2-carboxylic acid | Aliphatic amines-acid | 1000 | >4 | 17.9 | No | 3 | No | 1534 | Yes | Yes | 7920 | No | Yes | 1.21 | No |
| Bromomethane | Neutral organics | 1.82 | 2 | 699 | No | 2 | Yes | 429 | Yes | No | 220 | Yes | No | 554 | No |
| Chloromethane | Neutral organics | 550 | 4 | 639 | Yes | 4 | Yes | 274 | Yes | No | 194 | Yes | No | 415 | No |
| Iodomethane | Neutral organics | 1.26 | 2 | 391 | No | 2 | Yes | 272 | Yes | No | 185 | No | No | 588 | No |
| Methanamine | Aliphatic amines | 237 | 3 | 6349 | No | 3 | Yes | 323 | Yes | Yes | NA | NA | NA | 793 | No |
| Ethanamine | Aliphatic amines | 1000 | 4 | 1512 | Yes | 4 | Yes | 223 | Yes | No | NA | NA | NA | 790 | Yes |
| Isopropyl amine | Aliphatic amines | 1000 | 4 | 1056 | Yes | 4 | Yes | 155 | Yes | No | NA | NA | NA | 902 | Yes |
| 2-Methyloxirane | Epoxides, mono | 215 | 3 | 2373 | No | 3 | Yes | 45.0 | Yes | No | 3.86 | Yes | No | 136 | Yes |
| Acetone cyanohydrin | Nitrile alpha-OH | 0.570 | 1 | 536 | No | 4 | No | 0.933 | Yes | Yes | 3450 | Yes | No | 377 | No |
| Dimethyl sulfate | Esters | 7.50 | 2 | 4119 | No | 2 | Yes | 200 | Yes | No | 1040 | No | No | 67.3 | Yes |
| Triethyl phosphate | Esters (phosphate) | 100 | >3 | 582 | Yes | 4 | Yes | 9.83 | Yes | No | 1740 | Yes | Yes | 85.0 | No |
| Propanoic acid | Neutral organics-acid | 87.2 | 2 | 2739 | No | 2 | Yes | 11![[thin space (1/6-em)]](https://www.rsc.org/images/entities/char_2009.gif) 521 521 |
No | No | 1900 | Yes | No | 248 | No |
| (2S)-2-Hydroxypropanoic acid | Neutral organics-acid | 130 | 3 | 19093 |
No | 3 | Yes | 177000 |
No | No | 16.4 | Yes | No | 1680 | No |
| Camphene | Neutral organics | 1.17 | 2 | 1.53 | Yes | 2 | Yes | 0.873 | Yes | No | 0.714 | Yes | No | 3.07 | Yes |
| 6,15-Dihydro-5,9,14,18-anthrazinetetrone | Neutral organics | 46.0 | 2 | 0.026 | No | 2 | Yes | 0.003 | No | No | NA | NA | NA | 0.013 | No |
| 4-Hydroxy-3-(3-oxo-1-phenylbutyl)-2H-1-benzopyran-2-one | Vinyl/allyl alcohols | 49.2 | 2 | 0.422 | No | 2 | Yes | 5.51 | Yes | Yes | 43.5 | No | Yes | 5.30 | Yes |
| 1,2-Benzenedicarboxylic acid | Neutral organics-acid | 1000 | >4 | 2079 | Yes | 3 | No | 9323 | No | Yes | NA | NA | NA | 38.4 | No |
| o-Chlorobenzaldehyde | Aldehydes (mono) | 2.62 | 2 | 5.62 | Yes | 1 | No | 5.24 | Yes | Yes | 5.75 | Yes | Yes | 6.35 | Yes |
| 2-Ethyl-1,3-hexanediol | Neutral organics | 624 | 4 | 1187 | Yes | 4 | Yes | 275 | Yes | No | 580 | Yes | Yes | 364 | No |
| 2-Imidazolidinethione | Thioureas | 502 | >4 | 324 | No | 3 | No | 79928 |
Yes | Yes | 2790 | No | Yes | 273 | No |
| Benzenesulfonyl chloride | Acid halides | 3.00 | 2 | 3251 | No | 2 | Yes | 3.82 | Yes | Yes | NA | NA | NA | 31.9 | Yes |
| alpha-Terpineol | Neutral organics | 6.53 | 2 | 32.1 | Yes | 2 | Yes | 8.07 | Yes | Yes | 32.1 | Yes | Yes | 28.2 | Yes |
| 1-Chloro-4-nitrobenzene | Neutral organics | 15.0 | 2 | 10.9 | Yes | 1 | No | 50.5 | Yes | Yes | 18.6 | Yes | Yes | 9.67 | Yes |
| 3-Phenyl-2-propenal | Vinyl/allyl aldehydes | 4.64 | 2 | 1.07 | Yes | 2 | Yes | 0.201 | Yes | No | 8.74 | No | Yes | NA | NA |
| 1,2-Dibromoethane | Neutral organics | 24.4 | 2 | 27.9 | Yes | 2 | Yes | 151 | Yes | No | 108 | Yes | No | 14.9 | Yes |
| Butanoic acid | Neutral organics-acid | 65.0 | 2 | 1405 | No | 2 | Yes | 4963 | No | No | NA | NA | NA | 139 | No |
| 2,5-Furandione | Neutral organics | 138 | 3 | 3.18 | No | 3 | Yes | 177 | No | Yes | NA | NA | NA | NA | NA |
| N-(2-Aminoethyl)-1,2-ethanediamine | Aliphatic amines | 1000 | 4 | 737 | Yes | 4 | Yes | 10281 |
Yes | Yes | NA | NA | NA | 1250 | Yes |
| 1,2-Ethanediol, diacetate | Esters | 90.0 | 2 | 40.4 | Yes | 2 | Yes | 167 | Yes | No | 297 | Yes | No | 130 | No |
| 1-Octene | Neutral organics | 3.66 | 2 | 1.27 | Yes | 2 | Yes | 1.12 | Yes | Yes | 0.758 | Yes | No | 1.18 | Yes |
| 2-(2-Methoxyethoxy)ethanol | Neutral organics | 2683 | 4 | 19514 |
Yes | 4 | Yes | 71002 |
Yes | Yes | 22400 |
Yes | Yes | 14800 |
Yes |
| N,N,N-Trimethyl-1-hexadecanaminium, chloride | Neutral organics | 0.158 | 1 | 0.924 | Yes | 1 | Yes | 22.7 | Yes | No | NA | NA | NA | NA | NA |
| 1-Bromodecane | Neutral organics | 18.7 | 2 | 0.295 | No | 2 | Yes | 0.107 | No | No | 0.087 | Yes | No | 0.420 | No |
| 2-(2-Butoxyethoxy)ethanol | Neutral organics | 1300 | 4 | 1285 | Yes | 4 | Yes | 4555 | Yes | Yes | 2000 | Yes | Yes | 750 | Yes |
| Benzoic acid, phenylmethyl ester | Esters | 1.40 | 2 | 1.97 | Yes | 2 | Yes | 3.60 | Yes | Yes | 2.80 | No | Yes | 1.65 | Yes |
| 2-Octanol | Neutral organics | 75.0 | 2 | 36.2 | Yes | 2 | Yes | 23.6 | Yes | Yes | 21.9 | Yes | Yes | 24.2 | Yes |
| Decane | Neutral organics | 530 | >4 | 1.47 | No | 1 | No | 0.140 | No | No | 0.063 | Yes | No | 0.590 | No |
| Methanesulfonyl chloride | Acid halides | 11.0 | 2 | 38841 |
No | 2 | Yes | 16.1 | Yes | Yes | 11.8 | No | Yes | 98.3 | Yes |
| N,N-Dimethyl acetamide | Amides | 1000 | 4 | 2339 | Yes | 4 | Yes | 1558 | Yes | Yes | NA | NA | NA | 1180 | Yes |
| 1-Aminonaphthalene | Anilines (unhindered) | 7.00 | 2 | 6.96 | Yes | 2 | Yes | 13.6 | Yes | Yes | NA | NA | NA | 13.9 | Yes |
| Benzyl acetate | Esters | 4.00 | 2 | 13.6 | Yes | 2 | Yes | 18.0 | Yes | Yes | 21.3 | No | Yes | 38.4 | Yes |
| 1H-1,2,4-Triazole | Triazoles (non-fused) | 498 | 3 | 331 | Yes | 3 | Yes | 3574 | Yes | No | NA | NA | NA | NA | NA |
| Cyanamide | Neutral organics | 90.2 | 2 | 190 | No | 4 | No | 11597 |
No | No | 568 | Yes | No | NA | NA |
| 2-(1,3-Dihydro-3-oxo-2H-indol-2-ylidene)-1,2-dihydro-3H-indol-3-one | Vinyl/allyl ketones | 42.0 | 2 | 2.54 | Yes | 1 | No | 37.7 | Yes | Yes | NA | NA | NA | 0.200 | No |
|
N-[4-[Bis[4-(dimethylamino)phenyl]methylene]-2,5-cyclohexadien-1-ylidene]-N-methylmethanaminiumchloride (1:1) |
Neutral organics | 0.100 | 1 | 0.107 | Yes | 1 | Yes | 2771 | No | No | NA | NA | NA | NA | NA |
| Nitroguanidine | Aliphatic amines | 2268 | >4 | 51.3 | No | 4 | Yes | 5563 | Yes | Yes | 55900 |
No | Yes | NA | NA |
| 2,5-Dichlorophenol | Phenols | 3.30 | 2 | 12.3 | Yes | 2 | Yes | 6.96 | Yes | Yes | 5.42 | Yes | Yes | 5.93 | Yes |
| Acetic acid, ammonium salt (1:1) |
Neutral organics | 72.0 | 2 | NA | NA | 2 | Yes | 1.27 × 10⁶ | No | No | NA | NA | NA | NA | NA |
| 2-Methoxy-2-methylbutane | Neutral organics | 100 | >3 | 315 | Yes | 4 | Yes | 99.0 | Yes | No | 167 | Yes | Yes | 403 | Yes |
| Carbamic acid, monoammonium salt | Neutral organics | 40.6 | 2 | NA | NA | 4 | No | 7.97 × 10⁶ | No | No | NA | NA | NA | NA | NA |
| 4-Chloro-2-methylphenol | Phenols | 2.30 | 2 | 15.7 | Yes | 2 | Yes | 7.22 | Yes | Yes | 7.54 | Yes | Yes | 8.53 | Yes |
| 2-(1,1-Dimethylethyl)-1,4-benzenediol | Hydroquinones | 0.274 | 1 | 10.8 | No | 1 | Yes | 0.099 | Yes | Yes | NA | NA | NA | 21.0 | No |
| 2-(2,4-Dichlorophenoxy)acetic acid compd. with N-methylmethanamine (1:1) |
Neutral organics | 312 | 3 | NA | NA | 3 | Yes | 2427 | No | No | NA | NA | NA | NA | NA |
| 2-[4-(1,1-Dimethylethyl)phenoxy]cyclohexyl-2-propynyl ester sulfurous acid | Neutral organics | 0.154 | 1 | 0.510 | Yes | NA | NA | 0.180 | No | Yes | 0.218 | No | Yes | 1.10 | No |
| N1-(3-aminopropyl)-N1-dodecyl-1,3-propanediamine | Aliphatic amines | 1.01 | 2 | 0.078 | No | 2 | Yes | 1.39 | Yes | Yes | 0.586 | Yes | No | NA | NA |
| Tanone 50 | Aliphatic amines | 0.012 | 1 | 107 | No | NA | NA | 627 | Yes | No | NA | NA | NA | NA | NA |
| 1,2-Dichloro-3-nitrobenzene | Neutral organics | 12.0 | 2 | 7.45 | Yes | 2 | Yes | 16.2 | Yes | Yes | 8.10 | Yes | Yes | 7.82 | Yes |
| 5-Chloro-2-(4-chlorophenoxy)phenol | NA | 0.460 | >1 | NA | NA | 1 | Yes | NA | NA | NA | NA | NA | NA | NA | NA |
| 2-(Octylthio)ethanol | Neutral organics | 2.85 | 2 | 1.96 | Yes | 2 | Yes | 8.95 | Yes | Yes | 3.13 | No | Yes | 2.37 | Yes |
| CI pigment yellow 83 | Amides | 40.2 | 2 | 0.002 | No | NA | NA | 0.027 | No | No | NA | NA | NA | NA | NA |
| 1,3-Bis(hydroxymethyl)-5,5-dimethyl-2,4-imidazolidinedione | Carbonyl ureas | 298 | 3 | 11660 |
No | 3 | Yes | 6331 | Yes | No | 2970 | Yes | No | 6890 | No |
|
N-Decyl-N,N-dimethyl-1-decanaminium chloride (1:1) |
Neutral Organics | 0.750 | 1 | 0.0004 | Yes | 1 | Yes | 1.22 | Yes | No | 4.57 × 10⁻⁶ | No | Yes | NA | NA |
| Dimethyldiallylammonium chloride | Neutral organics | 1.10 | 2 | 0.112 | No | 4 | No | 1.43 × 10⁶ | No | No | NA | NA | NA | NA | NA |
| 7a-Ethyldihydro-1H,3H,5H-oxazolo[3,4-c]oxazole | Aliphatic amines | 169 | 3 | 1555 | No | 3 | Yes | 308 | Yes | Yes | 73.2 | Yes | No | 2410 | No |
| 1-(1-Butoxypropan-2-yloxy)propan-2-ol | Neutral organics | 50.0 | 2 | 2905 | No | 2 | Yes | 45354 |
Yes | No | 7410 | Yes | No | NA | NA |
| alpha-(Nonylphenyl)-omega-hydroxypoly(oxy-1,2-ethanediyl) | Neutral organics | 5.54 | 2 | 2.63 | Yes | 2 | Yes | 2.15 | No | Yes | 0.181 | Yes | No | NA | NA |
| N,N′-1,2-Ethanediylbis N-acetylacetamide | Imides | 140 | >3 | 52.0 | No | 4 | Yes | 1911 | Yes | Yes | 1820 | Yes | Yes | NA | NA |
| 1,3-Dichloro-2-propanol phosphate (3:1) |
Esters (phosphate) | 3.60 | 2 | 2.57 | Yes | 2 | Yes | 2.47 | Yes | Yes | 902 | No | No | 0.650 | No |
| N,N-Dimethyldecanamide | Amides | 21.0 | 2 | 11.8 | Yes | 2 | Yes | 5.53 | Yes | Yes | 6.86 | Yes | Yes | NA | NA |
| alpha-Methyl-4-(2-methylpropyl)benzeneacetic acid | Neutral organics-acid | 100 | >3 | 28.6 | No | 3 | Yes | 41.6 | No | No | 19.4 | Yes | No | 2.55 | No |
| (2R)-2-(4-Chloro-2-methylphenoxy)propanoic acid | Neutral organics-acid | 97.0 | >2 | 38.5 | Yes | 3 | Yes | 254 | No | Yes | 10.4 | No | Yes | 21.0 | Yes |
| Polypropylene glycol | Neutral organics | 4123 | 4 | 9253 | Yes | 4 | Yes | 24424 |
Yes | Yes | 19000 |
Yes | Yes | NA | NA |
| [2S-[2alpha,5alpha,6beta(S*)]]-6-[[Amino(4-hydroxyphenyl)acetyl]amino]-3,3-dimethyl-7-oxo-4-thia-1-azabicyclo[3.2.0]heptane-2-carboxylic acid | Phenol amines -acid | 1000 | >4 | 38.5 | No | 3 | No | 370 | Yes | No | 20400 |
No | Yes | 2.27 | No |
| Tetrkis(hydroxymethyl)phosphonium, sulfate(2:1)(salt) |
Neutral organics | 95.5 | 2 | 1.03 × 10⁶ | No | 4 | No | 4.26 × 10²² | No | No | NA | NA | NA | NA | NA |
| 5-[2-Chloro-4-(trifluoromethyl)phenoxy]-2-nitrobenzoic acid, 2-ethoxy-1-methyl-2-oxoethyl ester | Esters | 0.528 | 1 | 0.061 | Yes | 2 | Yes | 1.22 | No | No | 0.923 | No | Yes | 0.028 | Yes |
| N-[1,3-Bis(hydroxymethyl)-2,5-dioxo-4-imidazolidinyl]-N,N′-bis(hydroxymethyl)urea | Carbonyl ureas | 150 | >3 | 9006 | Yes | 4 | Yes | 6.70 × 10⁶ | Yes | Yes | 9240 | Yes | Yes | 2760 | Yes |
| 2-[(5-Chloro-8-quinolinyl)oxy]acetic acid, 1-methylhexyl ester | Esters | 13.3 | >2 | 0.809 | No | 2 | Yes | 0.544 | No | No | 0.502 | No | No | 0.630 | No |
| 2-Chloro-5-[3,6-dihydro-3-methyl-2,6-dioxo-4-(trifluoromethyl)-1(2H)-pyrimidinyl]benzoic acid 1,1-dimethyl-2-oxo-2-(2-propenyloxy)ethyl ester | NA | 6.02 | 2 | NA | NA | 2 | Yes | NA | NA | NA | NA | NA | NA | 0.095 | No |
| 1-(2,4-Dichlorophenyl)-4,5-dihydro-5-methyl-1H-pyrazole-3,5-dicarboxylic acid 3,5-diethyl ester | Esters | 4.20 | 2 | 0.196 | No | 1 | No | 1.13 | Yes | Yes | 1.97 | No | Yes | 0.370 | No |
Chemical categories were defined based on LC50 values and EPA acute aquatic toxicity categories of concern.39 Category 4 was added to distinguish chemicals with very low hazard potential. The four regulatory categories are: Category 1 – High hazard (LC50 < 1 mg L−1), Category 2 – Moderate hazard (1 < LC50 < 100 mg L−1), Category 3 – Low hazard (100 < LC50 < 500 mg L−1) and Category 4 – No hazard (LC50 > 500 mg L−1). Multiple LC50 thresholds were available for 40 of the 83 chemicals in the data set with the distribution of differences between the minimum and the maximum LC50 thresholds shown in Fig. S2.† When multiple experimental results for a single chemical were available, the geometric mean of the experimental LC50 values was used because LC50 values are typically log-normally distributed; under conditions of log-normality, geometric means are better estimators of centrality than arithmetic means.40 Regardless of the geometric mean, the vast majority of experimental values resulted in classification of the chemical into the same EPA category of concern for aquatic toxicity with six substances having reported LC50 values that spanned two categories. Experimental LC50 values for an anticoagulant, Warfarin, span three regulatory categories, ranging from 0.037 mg L−1 to >1000 mg L−1, and were independent of test duration. The complete data for these seven chemicals is given in Table S2.†
Partition coefficients
All toxicity prediction tools evaluated in this study rely on octanol-water partition coefficient (logP) or octanol-water distribution coefficient (logD) at a particular pH to assess chemical toxicity to fish. LogP is commonly used to predict absorption and toxicity of narcotics to aquatic organisms.41–43 In practice, logP can be calculated with atom-based,44–46 fragment-based,47 whole molecule prediction methods48,49 or more recently, from nuclear magnetic resonance spectra.50 Most of these logP estimation methods are based on neutral molecular species only. While both ionized and non-ionized forms are expected to contribute to absorption and toxicity,51–54 the apparent partition coefficient of the ionic forms is expected to be at least three orders of magnitude smaller than that of the non-ionized forms55 due to the differences in solute–solvent interactions and absorption kinetics.56,57 Consequently, logD, rather than logP, reflects the contribution of all ionized and unionized species at a given pH, providing a more meaningful estimate of bioavailability.58 In order to assess potential errors in partitioning estimates due to lack of ionization considerations, the logP values estimated by each software tool were compared with corresponding logD values, calculated at the biologically-relevant pH of 7.4, using Chem Axon's Marvin suite.59 Compounds with differences between logP and logD7.4 estimates greater than one log unit were identified with logP warnings.
Predictive tools
The following five in silico tools were evaluated for predicting acute aquatic toxicity to fish: ADMET Predictor, CADRE-AT, ECOSAR, KATE and TEST. Brief description of each program is provided below while the pertinent details are summarized in Table 2.| ADMET | CADRE-AT | ECOSAR | KATE | TEST | |
|---|---|---|---|---|---|
| a The exact number of compounds is not available. b Number of chemicals in the validation set (N = 83) that are in the AD of each model. OCSPP – office of chemical safety and pollution prevention; 2D ANNE -two-dimensional artificial neural network ensemble. AD – applicability domain. | |||||
| Free-ware? | No | No | Yes | Yes | Yes |
| Statistical method | 2D ANNE | Classification system | Class-specific linear regression | Class-specific linear regression | Consensus model |
| AD definition | Molecular descriptor space | Molecular descriptor space | LogP range and class categorization concerns |
LogP range and class categorization concerns |
Molecular descriptor space |
| Training set size | 490 | 565 | 1000sa | 535 | 823 |
| Training set species | Pimephales promelas | Pimephales promelas | All OCSPP approved species | Oryzias latipes, pimephales promelas | Pimephales promelas |
| Output | LC50 | Toxicity category (n = 4) | LC50 | LC50 | LC50 |
| # of chemicals in the ADb | 78 | 80 | 61 | 35 | 57 |
ADMET predictor™ estimates acute fish toxicity using two-dimensional (2D) Artificial Neural Network Ensemble (ANNE). Although only limited details for the ANNE are available due to proprietary nature of the algorithm, it is known that the model relies on hundreds of structural, constitutional, topological, and electronic properties as descriptors. Two estimates of logP are available – one based on the internal ANNE model, and another based on the atom fragment contribution (AFC) method outlined elsewhere.46 LogD7.4 is calculated with the ANNE method trained on ionizable compounds.20 ADMET is trained on fathead minnow data available from US EPA.60 The program requires SMILES strings or 3D structure files as inputs to provide estimates of LC50 values and can process multiple substances in batch mode. ADMET generates predictions only for compounds that fall within its applicability domain, which is assessed automatically on the basis of descriptor space in the training set.
CADRE-AT uses a series of classification models to bin chemicals into categories of concern for acute and chronic aquatic toxicity. The models are based on mechanistically-relevant bioavailability and reactivity parameters that include distribution coefficient (logD7.4), global quantum-mechanical reactivity indices and other physicochemical descriptors. Reactivity indices include frontier orbital energies, such as lowest unoccupied molecular orbital (LUMO), the highest occupied molecular orbital (HOMO) and the HOMO–LUMO energy gap (ΔE). These parameters are reflective of non-specific chemical reactivity with macromolecules.23,61 Like ADMET, CADRE-AT was trained on the fathead minnow data available from US EPA.60 Since descriptors are calculated at a high level of theory and require 3D chemical structures as inputs, CADRE-AT does not provide instantaneous predictions; typical processing times range from seconds to a few days per chemical, depending on the size and conformational flexibility of the structure(s) involved. CADRE-AT does not have an applicability domain and provides predictions for all organic chemicals that are amenable to the required computations.
Ecological Structure Activity Relationships (ECOSAR) v1.11 estimates acute aquatic toxicity via the Mayer–Overton relationship for chemicals within a structurally similar class.13,62 ECOSAR is trained on a large data set of Ecotoxicity studies from the ECOTOX database that follow OCSPP guidelines.15 The database is divided into 111 structural classes, and linear regression models between LC50 toxicity estimates and logP were developed for substances in each class. When chemicals belong to multiple chemical classes the most conservative (most toxic) estimate is provided based on the principle of excess toxicity. LogP is calculated with the EPISUITE KOWWIN module v. 1.68 using the AFC method.63,64 The KOWWIN module evaluates partitioning of neutral compounds only; thus, toxicity of organic acids and bases is estimated based on QSARs for non-ionized molecules of the same class. The program requires SMILES strings or CAS numbers as inputs to estimate LC50 thresholds and can process multiple substances in batch mode. ECOSAR is designed to perform best on compounds with logP < 5 and molecular weight < 1000 amu.13,62 Chemicals that do not meet the latter two criteria, or are structurally dissimilar from the domain of every QSAR model within ECOSAR, are considered outside the applicability domain.
KAshinhou Tool for Ecotoxicity (KATE) on PAS 2011 estimates acute aquatic toxicity via Mayer–Overton relationship for chemicals within a structurally similar class, akin to ECOSAR. Forty structural chemical classes are used in KATE. Estimated LC50 values are determined from linear regression models that use logP, which is obtained from an internal experimental database or is estimated with the AFC method.63,64 KATE is trained on the US EPA fathead minnow (Pimephales promelas) and the Japanese Ministry of Environment Oryzias latipes datasets.65,66 The program requires SMILES strings or CAS numbers as inputs to assess chemical toxicity and can process multiple substances in a single run with batch mode. The tool is available as a standalone application or as a web plug-in. The batch mode size is limited to 50 chemicals. KATE internally defines the applicability domains by comparing the logP of the test chemical to the range of logP values in each of the structural classes of the training set.18
Toxicity Estimation Software Tool (TEST) v.4.1 consists of a number of models that estimate acute aquatic toxicity thresholds by read-across among structural analogs or via multivariate regression. The models are based on hundreds of structural, constitutional, connectivity, shape, topological, molecular distance, fragments, and electrotopological property descriptors. Several partition coefficient estimates are provided. LogP is calculated with two group contribution methods derived by Ghose45 or Wang.67 TEST is trained on Fathead minnow dataset from the EPA ECOTOX database.38,65 The program requires only SMILES strings or CAS numbers as inputs to quickly assess chemical toxicity and can process multiple substances in a single run with batch mode. Each read-across or regression model has specific applicability domain. The program provides estimated LC50 threshold based on each model's prediction, as well as a consensus average of the component models. Given that the consensus result was previously reported as the most accurate estimate provided by TEST,68 it was used in this validation exercise.
Structural alerts and modes of action
Model performance often varies between chemicals activing by different modes of action (MOAs). To evaluate model performance within common aquatic toxicity MOA, possible MOAs for chemicals in the test set were identified using the Verhaar scheme69–71 coded in ToxTree v.2.6.13.72 Briefly, the Verhaar classification scheme uses a series of structural alerts derived from chemicals with known toxic modes of action to sort organic chemicals into five categories according to the mechanism of toxicity. The five classes are Class 1 (inert chemicals or non-polar narcotics), Class 2 (less inert chemicals or polar narcotics), Class 3 (reactive chemicals), Class 4 (specifically acting chemicals), and Class 5 (not classifiable chemicals).70,71Statistical analysis
The R language and environment for statistical computing73 (version 3.1.2) was used for data management, analysis, and performance metric valuation. A number of summary statistics were calculated to compare model performance and included both classification and regression model results whenever possible to provide the most comprehensive information for risk assessment.74 Using logarithmically transformed measured and predicted LC50 values, the root of mean squared error (RMSE), correlation coefficient (R2), total categorical accuracy, and predictive power that penalizes programs for predicting the wrong or for not predicting any toxicity category were determined. The percentage of substances with differences between predicted and measured LC50 values within factors of 2, 5, 10, 100, and 1000, were also calculated for consistency with other studies. Failed predictions are defined as cases where no toxicity estimate was afforded by the model.Results
Chemical diversity of external validation dataset
The 83 chemicals assessed represent a diverse array of commercial substances that includes aldehydes, halides, phenols, alcohols, ketones, amines, amides, esters, and carboxylic acids (Tables 1 and S1†). To test for structural similarity, structure clustering analysis was performed with the Marvin MSC software59 and no large clusters were revealed. The three largest clusters were surfactant-like hydrocarbons (n = 6), chlorinated benzo ethers (n = 4), and benzo esters (n = 4). Additional cluster details can be found in Table S1.†Statistical distribution of experimental values
The experimental LC50 thresholds of the 83 chemicals are approximately normally distributed and cover all regulatory categories (Fig. 1). Fig. 2A–C shows the relationships between experimental toxicity estimates and mechanistically relevant chemical parameters in the data set. The parameters include logD7.4, molecular volume, and HOMO–LUMO energy gap (ΔE). Consistent with prior work,21,29,41,75 it is anticipated that logD7.4 and molecular volume of the validation data set compounds show direct univariate relations to increased acute lethality (Fig. 2A and C), while ΔE shows an inverse relationship (Fig. 2B).
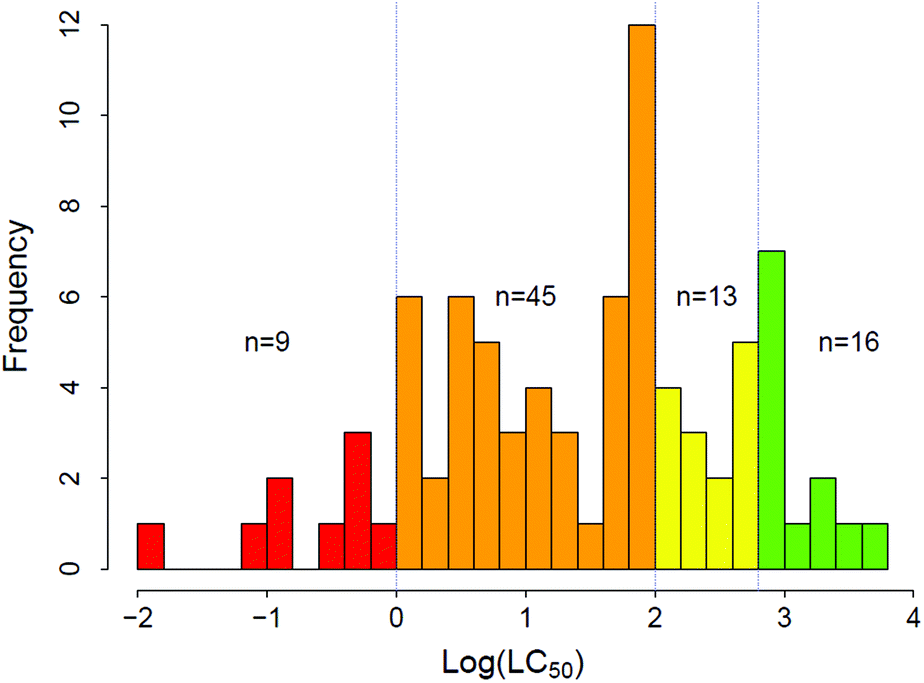 | ||
| Fig. 1 The distribution of log(LC50) thresholds (mg L−1). | ||
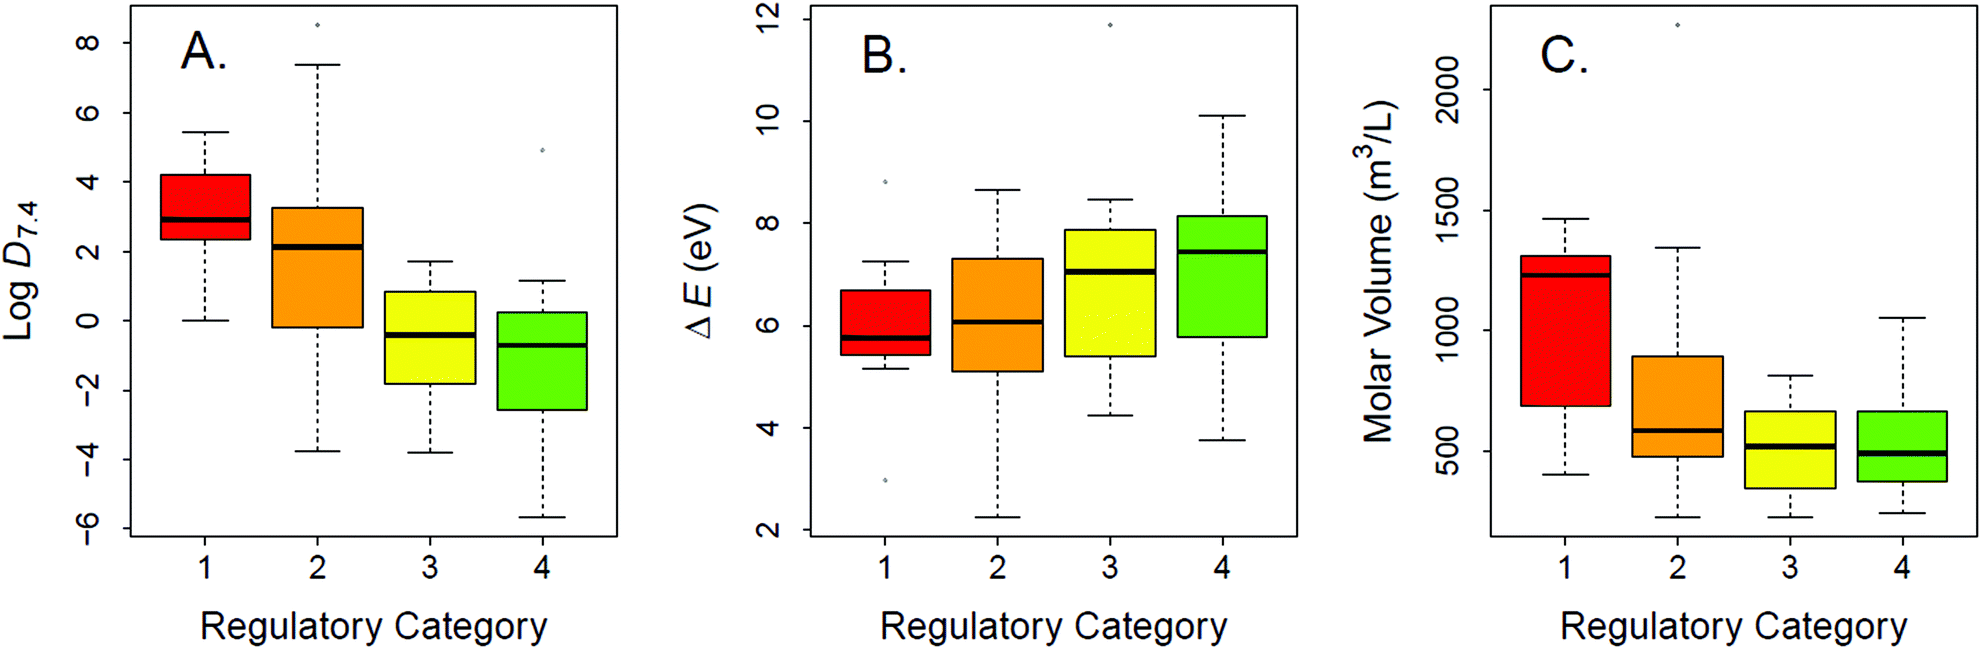 | ||
| Fig. 2 Boxplot of properties mechanistically related to acute aquatic toxicity by acute aquatic toxicity category of concern: (A) logD7.4; (B) energy gap between the highest occupied (HOMO) and the lowest unoccupied (LUMO) molecular orbitals, (ΔE); (C) molecular volume in the test data set. The four regulatory categories high (LC50 < 1 mg L−1), medium (1 < LC50 < 100 mg L−1), low ( 100 < LC50 < 500 mg L−1), and no hazard ( LC50 > 500 mg L−1) are highlighted in red, orange, yellow, and green, respectively. | ||
Model accuracy across the entire test set
The performance metrics for all programs tested in this evaluation are summarized in Table 3 and Fig. 2A–C. Total accuracy measures the fraction of chemicals correctly placed into regulatory categories, with missing prediction discounted in the analysis. Predictive power reflects an ability to assess the toxicity category of any given chemical, i.e. failed predictions are penalized in the computed score as previously discussed (Methods). Model performance is first evaluated on the entire data set regardless of the applicability domain (AD) to assess the tool utility for any new or existing chemical. Based on predictive power of classification into the four toxicity categories of the entire data set, the tested tools can be ranked in the following order from highest- to lowest-performers: CADRE-AT > ECOSAR = Admet > KATE > TEST. KATE and TEST failed to predict LC50 values for 26 and 23 of the 83 compounds, respectively. For the 67 chemicals for which KATE is able to provide an LC50 estimate, the total accuracy is relatively high (58%). However, owing to number of failed predictions, the predictive power is much lower at 40%. Both total accuracy and predictive power of TEST are lower – 48% and 35%, respectively. ADMET, CADRE-AT, and ECOSAR, on the other hand, failed to yield predictions for only 5, 3, and 2 chemicals respectively. Among the toxicity prediction tools that estimate LC50 values (ADMET, ECOSAR, KATE, TEST), little difference is observed in the distribution of errors, as evidenced by percentage of predictions that fall within a factor 2, 5, 10, 100, and 1000 of the measured LC50 and RMSE (Table 3).| Measures of predictive accuracy | ADMET | CADRE-AT | ECOSAR | KATE | TEST |
|---|---|---|---|---|---|
| a Total accuracy is the fraction of chemicals assessed by each tool for which the predicted LC50 falls within the same regulatory category as the measured LC50. b Similar to total accuracy, predictive power measures the total number of correct category assignments. However, lack of prediction is treated as an incorrect assignment. c Cannot be calculated; software tool provides regulatory category designation only. d Parametric correlation might provide poor estimate of covariance due to extreme outliers. RMSE – root mean squared error. | |||||
| Total accuracy (%)a | 53% | 83% | 51% | 58% | 48% |
| Predictive power (%)b | 49% | 80% | 49% | 40% | 35% |
| Number of missing predictions | 5 | 3 | 2 | 26 | 23 |
| Coefficient of variance (R2) | 0.27 | NAc | 0.11d | 0.35 | 0.21 |
| RMSE (log scale) | 1.60 | NAc | 2.94d | 1.47 | 1.32 |
| % within 1 regulatory category | 80.8 | 92.5 | 85.2 | 85.5 | 88.3 |
| % within a factor of 2 (%) | 25.6 | NAc | 25.9 | 26.3 | 30.0 |
| % within a factor of 5 (%) | 48.7 | NAc | 54.3 | 47.4 | 50.0 |
| % within a factor of 10 (%) | 57.7 | NAc | 63.0 | 64.9 | 63.3 |
| % within a factor of 100 (%) | 80.8 | NAc | 76.5 | 82.5 | 85.0 |
| % within a factor of 1000 (%) | 91.0 | NAc | 86.4 | 94.7 | 98.3 |
Applicability domains
Robust and relevant applicability domain (AD) definition is essential for model performance.29 ECOSAR and KATE readily generate toxicity estimates for chemicals outside their applicability domains. To gauge any changes in performance, chemicals solely within the applicability domain (AD) of these two tools were considered in a separate analysis (Table 4). For ECOSAR, the AD is defined in the user manual by structural domain alerts previously discussed in Methods and Table 2. The total accuracy of ECOSAR increases from 51 to 61% when the analysis is limited to chemicals within its AD; 59 of the 83 tested chemicals are within the ECOSAR's AD. The AD for KATE is defined entirely by the program alerts. KATE's total accuracy decreased from 58% to 46% when analysis is limited to the 35 (of the 83) compounds within its AD. As discussed above, little to no difference between the programs is observed in the distributed of errors (Table 3). However, ECOSAR AD definition identifies the large outliers in toxicity prediction. In addition, owing to the transparent nature of the ECOSAR algorithm, other large outliers in ECOSAR LC50 predictions can be attributed to substances for which the internal KOWWIN logP estimates are substantially lower than the logD7.4 estimates (Fig. 3 and 4). These compounds are flagged with logP warnings. The large outliers explain the lowest coefficient of determination (R2) and the largest RMSE of LC50 thresholds estimated by ECOSAR (Table 3, Fig. 3). As parametric estimates, R2 and RMSE are poor measures of model fit when large outliers are present.
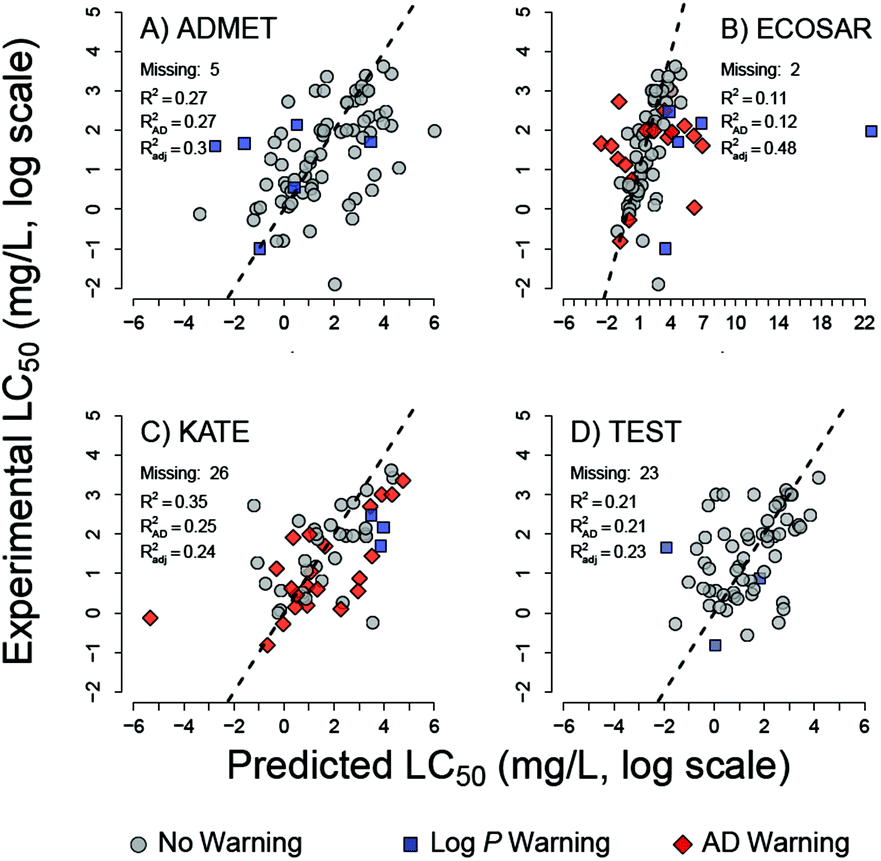 | ||
| Fig. 3 Correlations between predicted and experimental LC50 values on log for (A) ADMET predictor, (B) ECOSAR, (C) KATE, and (D) TEST. Red: chemicals that lie outside the AD; blue: logP estimates used by the tool are >1 log unit below Marvin logD7.4 estimates. R2AD: coefficient of determination for chemicals inside AD; R2adj is the coefficient of determination for chemicals inside the AD and without logP warnings. | ||
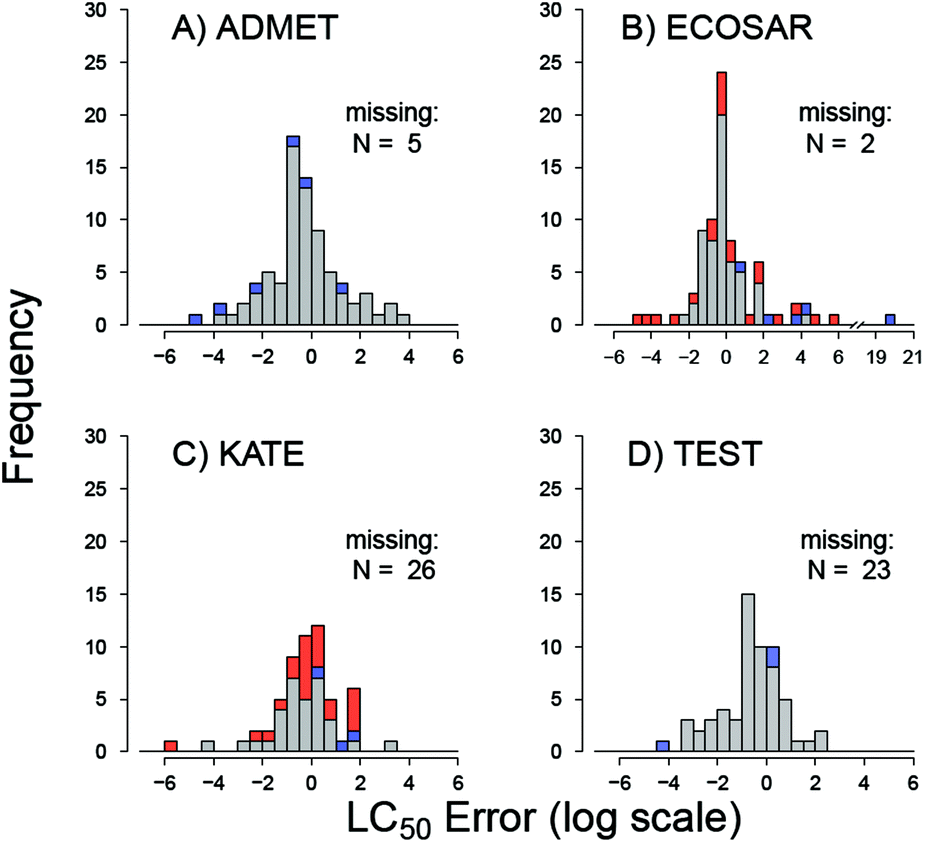 | ||
| Fig. 4 Distribution of prediction errors (predicted – experimental) in logLC50 units for (A) ADMET predictor, (B) ECOSAR, (C) KATE, (D) TEST. Positive errors indicate predicted LC50 above experimental LC50 and toxicity underestimation. Red: “AD warning,” show the errors for chemicals that lie outside applicability domain (KATE and ECOSAR only); blue: “logP warning,” logP estimates are >1 log unit below Marvin logD7.4 estimates. | ||
| Measures of predictive accuracy | ADMET | CADRE-AT | ECOSARa | KATEa | TEST |
|---|---|---|---|---|---|
| a This tool provides predictions when chemicals lie outside the applicability domain (AD). b Total accuracy within the AD is the fraction of chemicals assessed by each tool for which the predicted LC50 falls within the same regulatory category as the measured LC50. The chemicals with AD warnings are excluded from the assessment. c Cannot be calculated; the tool provides regulatory category designation only. d Number chemicals for which the tool provided toxicity estimates that are also within the tool's AD. e Parametric correlation might provide poor estimate of covariance due to extreme outliers. | |||||
| Total accuracy inside AD (%)b* | 53% | 83% | 61% | 46% | 48% |
| Coefficient of variance (R2) | 0.27 | NAc | 0.13e | 0.25 | 0.21 |
| RMSE (log scale) | 1.60 | NAc | 1.29 | 1.35 | 1.32 |
| Number of chemicals (out of 83)d | 78 | 80 | 59 | 35 | 57 |
No explicit AD analyses for ADMET, CADRE-AT, and TEST were performed because the programs do not allow for predictions outside their respective ADs (ADMET, TEST) or lack applicability domain definitions (CADRE-AT). A narrow AD definition may decrease model performance due to large fraction of missed prediction and low predictive power. Furthermore, models trained on small data sets with narrow ADs may be overfitted, resulting in a poor accuracy during evaluation. Among evaluated tools that estimate LC50 values, ECOSAR showed the narrowest error distribution when analysis was limited to chemicals within its AD (Table 4).
Structural alerts for modes of action
The majority of compounds (n = 52) in the training set could not be classified into MOAs by the modified Verhaar scheme,70,71 briefly discussed in Methods. Of the remaining 31 compounds, 24 were identified as narcotics, 6 as generally reactive, and 1 as specifically reactive. Chemicals designated as narcotics included ionized substances and compounds with logP > 5. Since many of the charged and poorly soluble chemicals are outside the applicability domains of the tested tools (Table S1†), prediction accuracy was evaluated with and without these compounds (Table 5). Based on total accuracy for neutral chemicals with logP < 5 designated as narcotics, the tools performed in the following order: CADRE-AT > Admet > TEST > KATE > ECOSAR. All programs showed decreased performance on generally reactive chemicals (n = 6).
| Measures of predictive accuracy | ADMET | CADRE-AT | ECOSAR | KATE | TEST |
|---|---|---|---|---|---|
| Total accuracy – narcotics (total: 24) | 68% | 88% | 52% | 50% | 71% |
| Missing prediction – narcotics | 2/24 | 0/24 | 1/24 | 4/24 | 7/24 |
| Total accuracy – neutral narcotics (logP < 5) |
87% | 94% | 53% | 57% | 77% |
| Missing prediction – neutral narcotics (logP < 5) |
1/17 | 0/17 | 1/17 | 2/17 | 3/17 |
| Total accuracy – reactive chemicals (total: 6) | 33% | 67% | 50% | 40% | 50% |
| Missing prediction – reactive chemicals | 0/6 | 0/6 | 0/6 | 1/6 | 2/6 |
Discussion
Chemicals in the aquatic environment must pass biological membranes in order to interact with biological targets, propagating a cascade of biochemical events that leads to acute lethality.76,77 Mechanistic insights into the bioavailability, distribution, and the nature of interactions between the chemical and its biological target that can be reflected in the predictive models are critical for improving model performance and interpretability.78–80The majority of chemicals impact toxicity through non-specific, reversible interactions with biological membranes, known as narcosis.81–83 Chemicals that primarily act via narcosis include aliphatic and aromatic hydrocarbons, chlorinated hydrocarbons, alcohols, ethers, ketones, aldehydes, weak acids and bases, and some aliphatic nitro compounds.84–86 Narcotics have been shown to exert toxic effects on fish at constant target tissue concentrations on the order of 220–470 mmol kg−1 of lipids.87 Thus, the toxicity of a narcotic is related to its ability to partition across the gill and target membranes and intercalate between the lipid bilayer. Conventionally, this process has been modeled using logP, which provides an estimate of the degree of partitioning across the membranes and the affinity for the hydrophobic region of the lipid bilayer.81,88–94
KATE and ECOSAR predict aquatic toxicity based on single predictor (logP), which has been shown to be mechanistically relevant to compounds acting solely by narcosis.86 Their respective algorithms assume that although toxicants with particular functional groups induce toxicity in excess of that estimated by logP, the “excess” toxicity is constant factor for each category and can be adjusted with an appropriate class-specific correction factor.13,18 Surprisingly, KATE and ECOSAR afford lower accuracy than the other three tools for assessing toxicity categories of chemicals identified as narcotics by the Verhaar scheme (Table 5). The results merit further investigation of the models and the Verhaar classification scheme. It is likely that errors in estimates of logP by ECOSAR and KATE lead to errors in toxicity estimates. Indeed, underestimation of logP by ECOSAR is directly related to its underestimation of toxicity (overestimating LC50) in the set of five chemicals (Fig. 5). The five chemicals are Crystal Violet dye (CAS# 548-62-9), DMDM Hydantoin (CAS# 6440-58-0), Dowanol 54B (CAS# 78491-02-8), and Butafenacil (CAS# 134605-64-4) (Table S1†). On the other hand, overestimated logP values did not lead to proportionally overestimated LC50 results. These differences may arise from the differences in QSAR equations used to predict excess toxicity by ECOSAR; i.e. toxicity above prediction afforded by the baseline octanol-water portioning equation for neutral organic narcotics.13 Furthermore, these differences in ECOSAR and KATE may also be attributed to unstable regression models, as the QSARs for some chemical classes are based on as few as 2 data points (diazonium aromatics).13,31 Previous study on an older ECOSAR version found that 22% of the QSAR equations in the tool were “reliable”.95 In these cases, the tools’ performance would likely be improved if training set chemicals were partitioned into QSAR models by MOA rather than by chemical class.65,96 Further work to test this hypothesis is ongoing. It should be noted that a significant portion of chemicals with large toxicity errors from predictions by KATE and ECOSAR had logP warnings, which should alert the user to discount the accuracy of prediction for those chemicals (Fig. 4).
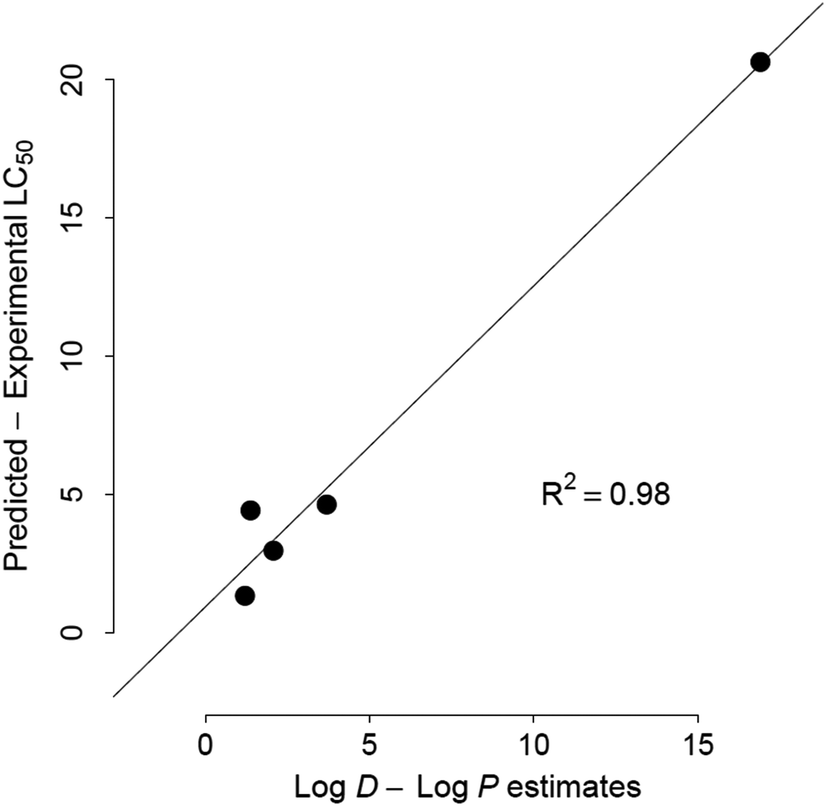 | ||
| Fig. 5 Relationship between underestimated bioavailability, (logP − logD7.4) and acute toxicity thresholds for five chemicals with KOWWIN logP estimates >one order of magnitude below Marvin logD7.4. (R2 = 0.98). | ||
Partitioning coefficients alone are poor predictors of acute aquatic toxicity for chemicals acting though specific interactions with biological macromolecules.97 Such interactions include covalent reactivity with protein residues and nucleic acids, non-covalent binding to enzymes and receptors (e.g. acetylcholinesterase and estrogen receptors), oxidative phosphorylation uncoupling, and central nervous system stress.69,98,99 Predictive toxicology models can be improved by considering chemical properties mechanistically relevant to these interactions, such as reactivity and steric parameters.100–103 CADRE-AT uses global reactivity indices (such as frontier orbital energies) and physicochemical properties (such as logD7.4, molecular volume and accessible surface area) to bin chemicals into EPA's categories of concern. To this end, the higher performance and greater applicability domain (uniform predictive accuracy for soluble, insoluble, charged and neutral compounds – Table 6) noted for CADRE-AT likely stem from the closer mechanistic relevance of its descriptors.23
| Measures of predictive accuracy | ADMET | CADRE-AT | ECOSAR | KATE | TEST |
|---|---|---|---|---|---|
| The accuracy of the tool is significantly different from its accuracy for neutral molecules with logP < 5 at α = 0.05 (*), and α = 0.10 (•). Two-sided Wilcoxon test was used. |
|||||
| Total accuracy – neutral (logP ≤ 5) |
57% | 83% | 63% | 62% | 54% |
| No. of missing predictions – neutral (logP ≤ 5) |
2/53 | 1/53 | 2/53 | 11/53 | 12/53 |
| Total accuracy – neutral (logP > 5) |
38% | 83% | 25%* | 33% | 17%• |
| Missing prediction – neutral (logP > 5) |
0/8 | 2/8 | 0/8 | 2/8 | 2/8 |
| Total accuracy – anionic | 33% | 83% | 33%• | 33% | 57% |
| Missing prediction – anionic | 3/12 | 0/12 | 0/12 | 3/12 | 3/12 |
| Total accuracy – cationic | 60% | 80% | 30%• | 50% | 75% |
| Missing prediction – cationic | 0/10 | 0/10 | 0/10 | 8/10 | 6/10 |
TEST and ADMET rely on machine learning and consensus models with a diverse array of molecular predictors. Thus, it is not possible to ascertain the mechanistic relevance of the molecular parameters, other than partition coefficients, to MOAs. ADMET ANNE method outperforms the TEST consensus algorithm in accuracy (52% vs. 48%, respectively) and provides estimates for a wider range of compounds (5 vs. 23 missing predictions, respectively). However, due to high number of predictors and more complex statistical algorithms as it is nearly impossible to identify sources of misclassification.
Structural alerts for modes of action
The two property-based chemical categories present a particular challenge to toxicity estimation are: (1) compounds with logP values > 5 and (2) compounds that are ionizable at biological pH. All software tools, with the exception of CADRE-AT, suffer a decrease in accuracy when assessing chemicals with either of these attributes (Table 6). The reason is likely associated with the categorical model of CADRE-AT versus the linear QSAR models for estimating LC50 of the other tools. While hydrophobic chemicals partition rapidly into organic layer, their diffusion in aqueous environment is limited. Thus, their toxicity may be controlled by diffusion limits,104 which are not explicitly considered in the modeling approaches evaluated here and may lead to the observed high error rates for insoluble compounds. For example, all tools overestimated the 96 h LC50 of decane due to its high hydrophobicity (logP = 5.01) and low solubility (0.052 mg L−1 at 25 °C). However, decane has experimental LC50 above 530 mg L−1, likely because it is unavailable in aquatic environment due to low solubility.
In contrast, ionized species diffuse rapidly through aqueous phase but have lower partitioning into tissues. However, logP estimates do not consider the contribution of ionized molecular forms to chemical partitioning and toxicity. For this reason, using logD7.4 is likely a better estimate of bioavailability than logP, as the former takes into account the effect of ionization at biologically-relevant pH on the hydrophobicity. Furthermore, ionized compounds may exhibit stronger interactions with biological membranes than other narcotics,105 or cause toxicity by an entirely different mode of action than their neutral counterparts.106,107 Consequently, estimations of the acute toxicity of ionizable compounds requires descriptors that reflect the properties of the compound in the predominant ionization state at biological pH. All tools that do not consider ionization exhibited decreased accuracy or failed predictions for a large fraction of ionizable compounds (Table 6). Notable exceptions to the decreased accuracy include ADMET's assessment of cationic compounds, and TEST's assessment of anionic compounds, which are on par with the programs’ accuracy for neutral chemicals. CADRE-AT retained similar accuracy for ionizable compounds, likely because it uses logD7.4 and calculates the reactivity parameters for predominant species at pH 7.4.
Drug-like compounds
Aquatic toxicity of pharmaceuticals and hormone-like chemicals is of particular concern due to high biological activity of these compounds. Five pharmaceuticals compounds are included in the set of 83 chemicals considered here: estradiol hormone (CAS# 50-28-2), anticoagulant Warfarin (CAS# 81-81-2), and non-steroidal anti-inflammatory drug Indometacin (CAS# 53-86-1) and antibiotics Ampicillin (CAS# 69-53-4) and Amoxicillin (CAS# 26787-78-0) (Tables 1 and S1†). For this set of five pharmaceuticals, the logP-based tools give the most accurate predictions. KATE and ECOSAR correctly categorize 5/5 and 4/5 chemicals respectively. CADRE-AT predicts the toxicity categories of Estradiol, Indometacin and Warfarin correctly, but overestimates the toxicities of the two antibiotics by one category. TEST and ADMET performed worse, correctly categorizing 1/5, and 0/5 compounds, respectively. The tools that rely on large number of structural descriptors to predict toxicity could not accurately predict toxicity of the pharmaceutical compounds analysed here and consistently overestimated their toxicity by 1–2 orders of magnitude (Table 1). However, further research with larger data set of drug-like compounds is necessary to assess the applicability of aquatic toxicity prediction tool to pharmaceuticals more generally.
Conclusions
This analysis assessed the performance of five acute aquatic toxicity prediction tools using an external validation dataset of 83 structurally diverse organic chemicals, which were distinct from the compounds used the training sets of all five tools. Overall, the toxicity estimation tools based on mechanistically-relevant chemical properties performed better than the purely statistical algorithms based on a hundreds of structural properties with unspecified relevance to toxicity. Based on total accuracy within each tool's applicability domains, the tools can be ranked in the following order (from best to worst): CADRE-AT (83%) > ECOSAR (61%) > ADMET (53%) > TEST (48%) > KATE (46%). However, most programs showed a marked decrease in performance when considering insoluble and ionized chemicals. CADRE-AT showed uniform performance with accuracy above 80% in every chemical category. However, CADRE-AT does not provide an exact LC50 estimate, but only a regulatory category assignment. Additionally, the latter is not currently available to the public as a standalone, user-operated tool. Among standalone, user-operated tools ECOSAR outperforms the other algorithms. When using any of these tools, users must be careful to consider the applicability domains and solubility warnings, which are not always available in batch mode. Faster processing times, easy compound entry, and clear AD warnings can help in silico tool integration in global regulatory environments. Model performance can be improved by developing models for specific MOAs, robust partitioning estimates such as distribution coefficients, and solubility considerations. Furthermore, while models based on mechanistically-relevant parameters perform best, chemical properties other than partition coefficients might be necessary to assess toxicity of diverse chemical space.Funding
This material is based on work supported by the NSF Division of Chemistry and the Environmental Protection Agency through a program of Networks for Sustainable Molecular Design and Synthesis. Grant No. 1339637.Acknowledgements
The authors would like to thank Jay Tunkel for his help with data collection and ECOSAR software; Bryan Brooks for aquatic toxicity advice; Jeffrey Jacob, Ayako Furuhama for their assistance with Admet and KATE software, respectively. Paul T. Anastas would like to thank QAFCO for continued financial support.References
- ECHA, https://echa.europa.eu/documents/10162/13632/nutshell_guidance_csa_en.pdf (accessed March, 2015), 2009.
- A. O. Aptula and D. W. Roberts, Chem. Res. Toxicol., 2006, 19, 1097–1105 CrossRef CAS PubMed.
- M. T. D. Cronin, J. S. Jaworska, J. D. Walker, M. H. I. Comber, C. D. Watts and A. P. Worth, Environ. Health Perspect., 2003, 111, 1391–1401 CrossRef CAS PubMed.
- A. Lombardo, A. Roncaglioni, E. Benfenati, M. Nendza, H. Segner, S. Jeram, E. Pauné and G. Schüürmann, Environ. Res., 2014, 135, 156–164 CrossRef CAS PubMed.
- EC, http://eur-lex.europa.eu/legal-content/EN/TXT/PDF/?uri=CELEX:32010L0063&from=EN (accessed March, 2015), 2010.
- H. Sanderson and K. Solomon, Environ. Toxicol. Chem., 2009, 28, 1359–1360 CrossRef CAS PubMed.
- ECHA, http://echa.europa.eu/documents/10162/13639/alternatives_test_animals_2014_en.pdf (accessed March, 2015), 2011.
- NRC, A Framework to Guide Selection of Chemical Alternatives, http://www.laboratoryequipment.com/sites/laboratoryequipment.com/files/legacyimages/18872_0.pdf, (accessed March, 2015), 2014.
- J. G. Hengstler, H. Foth, R. Kahl, P. J. Kramer, W. Lilienblum, T. Schulz and H. Schweinfurth, Toxicology, 2006, 220, 232–239 CrossRef CAS PubMed.
- A. P. Worth, T. Hartung and C. J. Van Leeuwen, SAR QSAR Environ. Res., 2004, 15, 345–358 CrossRef CAS PubMed.
- A. P. Worth, C. J. Van Leeuwen and T. Hartung, SAR QSAR Environ. Res., 2004, 15, 331–343 CrossRef CAS PubMed.
- T. I. Netzeva and T. W. Schultz, Chemosphere, 2005, 61, 1632–1643 CrossRef CAS PubMed.
- US EPA, http://www.epa.gov/sites/production/files/2015-09/documents/ecosartechfinal.pdf (accessed March, 2015), 2012, 1–43.
- D. Hoff, W. Lehmann, A. Pease, S. Raimondo, C. Russom and T. Steeger, US Environ. …, 2010, 1–127 Search PubMed.
- US EPA, http://http//www.epa.gov/sites/production/files/2015-07/documents/850-1075.pdf (accessed May, 2015), 1996, 1–11.
- O. Nicolotti, E. Benfenati, A. Carotti, D. Gadaleta, A. Gissi, G. F. Mangiatordi and E. Novellino, Drug Discovery Today, 2014, 19, 1757–1768 CrossRef CAS PubMed.
- A. M. Voutchkova, T. G. Osimitz and P. T. Anastas, Chem. Rev., 2010, 110, 5845–5882 CrossRef CAS PubMed.
- A. Furuhama, T. Toida, N. Nishikawa, Y. Aoki, Y. Yoshioka and H. Shiraishi, SAR QSAR Environ. Res., 2010, 21, 403–413 CrossRef CAS PubMed.
- US EPA, http://www.epa.gov/chemical-research/toxicity-estimation-software-tool-test (accessed March, 2015), 2010, 1–69.
- SimulationPlus, ADMET Prdictor User Manual, Lancaster, California 93534-7059, 2014 Search PubMed.
- A. M. Voutchkova, J. Kostal, J. B. Steinfeld, J. W. Emerson, B. W. Brooks, P. Anastas and J. B. Zimmerman, Green Chem., 2011, 13, 2373 RSC.
- A. M. Voutchkova-Kostal, J. Kostal, K. A. Connors, B. W. Brooks, P. T. Anastas and J. B. Zimmerman, Green Chem., 2012, 14, 1001 RSC.
- J. Kostal, A. Voutchkova-Kostal, P. T. Anastas and J. B. Zimmerman, Proc. Natl. Acad. Sci. U. S. A., 2014, 112, 6289–6294 CrossRef PubMed.
- OECD, ENV/JM/MONO, 2007, 2, 1–154 Search PubMed.
- E. Benfenati, R. Diaza, A. Cassano, S. Pardoe, G. Gini, C. Mays, R. Knauf and L. Benighaus, Chem. Cent. J., 2011, 5, 58 CrossRef CAS PubMed.
- M. Feher and T. Ewing, QSAR Comb. Sci., 2009, 28, 850–855 CAS.
- C. M. Auer, J. V. Nabholz and P. Karl, Environ. Health Perspect., 1990, 87, 183–197 CrossRef CAS PubMed.
- M. Nendza, M. Muller and A. Wenzel, SAR QSAR Environ. Res., 2014, 25, 393–405 CrossRef CAS PubMed.
- M. T. D. Cronin and T. W. Schultz, J. Mol. Struct.: THEOCHEM, 2003, 622, 39–51 CrossRef CAS.
- T. R. Stouch, J. R. Kenyon, S. R. Johnson, X.-Q. Chen, A. Doweyko and Y. Li, J. Comput. – Aided Mol. Des., 2003, 17, 83–92 CrossRef CAS PubMed.
- P. Gramatica, QSAR Comb. Sci., 2007, 26, 694–701 CAS.
- A. Tropsha, P. Gramatica and V. K. Gombar, QSAR Comb. Sci., 2003, 22, 69–77 CAS.
- E. M. Hulzebos and R. Posthumus, SAR QSAR Environ. Res., 2003, 14, 285–316 CrossRef CAS PubMed.
- A. Golbamaki, A. Cassano, A. Lombardo, Y. Moggio, M. Colafranceschi and E. Benfenati, SAR QSAR Environ. Res., 2014, 1–22 Search PubMed.
- J. Tunkel, K. Mayo, C. Austin, A. Hickerson and P. Howard, Environ. Sci. Technol., 2005, 39, 2188–2199 CrossRef CAS PubMed.
- D. R. J. Moore, R. L. Breton and D. B. MacDonald, Environ. Toxicol. Chem., 2003, 22, 1799–1809 CrossRef CAS PubMed.
- F. Cheng, W. Li, Y. Zhou, J. Shen, Z. Wu, G. Liu, P. W. Lee and Y. Tang, J. Chem. Inf. Model., 2012, 52, 3099–3105 CrossRef CAS PubMed.
- US EPA, http://cfpub.epa.gov/ecotox/blackbox/help/userhelp4.pdf (acessed march, 2015), 2015.
- US EPA, http://www.epa.gov/pesticide-science-and-assessing-pesticide-risks/technical-overview-ecological-risk-assessment-0 (accessed May, 2015), 2015.
- R. R. Sokal and F. J. Rohl, Biometry. The Principles and Practice of Statistics in Biological Research, W. H. Freeman and Co, New York, 2012 Search PubMed.
- T. I. Netzeva, M. Pavan and A. P. Worth, QSAR Comb. Sci., 2008, 27, 77–90 CAS.
- D. Mackay, Environ. Sci. Technol., 1982, 16, 274–278 CrossRef CAS PubMed.
- C. E. Overton, Studien über die Narkose, zugleich ein Beitrag zur allgemeinen Pharmakologie, 1901, 195 p Search PubMed.
- V. N. Viswanadhan, A. K. Ghose, G. R. Reyankar and R. K. Robins, J. Chem. Inf. Comput. Sci, 1989, 29, 163–172 CrossRef CAS.
- A. K. Ghose, V. N. Viswanadhan and J. J. Wendoloski, J. Phys. Chem. A, 1998, 102, 3762–3772 CrossRef CAS.
- I. Moriguchi, S. Hinoro, Q. Liu, I. Nakagome and Y. Matsushita, Chem. Pharm. Bull., 1992, 40, 127–130 CrossRef CAS.
- R. Mannhold and A. Petrauskas, QSAR Comb. Sci., 2003, 22, 466–475 CAS.
- W. L. Jorgensen and E. M. Duffy, Bioorg. Med. Chem. Lett., 2000, 10, 1155–1158 CrossRef CAS PubMed.
- W. L. Jorgensen and E. M. Duffy, Bioorg. Med. Chem. Lett., 2002, 54, 335–366 Search PubMed.
- N. An, F. Van Der Mei and A. Voutchkova-kostal, Mol. Inf., 2014, 33, 2–8 CrossRef.
- J. M. Mckim and R. J. Erickson, Physiol. Zool., 1991, 64, 39–67 CrossRef.
- J. W. Martin, S. A. Mabury, K. R. Solomon and D. C. G. Muir, Environ. Toxicol. Chem., 2003, 22, 196–204 CrossRef CAS PubMed.
- R. J. Erickson, J. M. McKim, G. J. Lien, A. D. Hoffman and S. L. Batterman, Environ. Toxicol. Chem., 2006, 25, 1512–1521 CrossRef CAS PubMed.
- R. J. Erickson, J. M. McKim, G. J. Lien, A. D. Hoffman and S. L. Batterman, Environ. Toxicol. Chem., 2006, 25, 1522–1532 CrossRef CAS PubMed.
- C. Hansch and A. Leo, Substituent constants for correlation analysis in chemistry and biology, New York, NY, USA, 1979 Search PubMed.
- Y. Zhao, X. Yuan, L. Yang and L. Wang, Bull. Environ. Contam. Toxicol., 1996, 57, 242–249 CrossRef CAS PubMed.
- L. S. McCarty and D. Mackay, Environ. Sci. Technol., 1993, 27, 1718–1728 CrossRef CAS.
- F. Csizmadia, A. Tsantili-Kakoulidou, I. Panderi and F. Darvas, J. Pharm. Sci., 1997, 86, 865–871 CrossRef CAS PubMed.
- ChemAxon, http://www.chemaxon.com (accessed March, 2015), 2014.
- C. L. Russom, S. P. Bradbury, S. J. Broderius, D. E. Hammermeister and R. A. Drummond, Enviorn. Toxicol. Chem., 1997, 16, 948–967 CrossRef CAS.
- H. Schmitt, R. Altenburger, B. Jastorff and G. Schüürmann, Chem. Res. Toxicol., 2000, 13, 441–450 CrossRef CAS PubMed.
- US EPA, http://www.epa.gov/sites/production/files/2015-09/documents/ecosarusersguide.pdf (accessed March, 2015), 2012, 1–60.
- W. M. Meylan and P. H. Howard, J. Pharm. Sci., 1995, 84, 83–92 CrossRef CAS PubMed.
- Daylight, CLOGP Program. Daylight Chem. Inf. Syst. Von Karman Ave., Irvine, CA 92715, 1995.
- C. L. Russom, S. P. Bradbury, S. J. Broderius, D. A. Hammermeister and R. A. Drummond, Ennviron. Toxicol. Chem., 1997, 16, 948–967 CrossRef CAS.
- Japanese Ministry of Environment, http://www.env.go.jp/chemi/sesaku/02e.pdf, (accessed March, 2015), 2015, 1–31.
- R. Wang, Y. Gao and L. Lai, Perspect. Drug Discovery Des., 2000, 19, 47–66 CrossRef CAS.
- P. Gramatica, Evaluation of different statistical approaches for the validation of quantitative structure–activity relationships, Ispra, Italy, 2004 Search PubMed.
- H. J. M. Verhaar, J. Solbé, J. Speksnijder, C. J. Van Leeuwen and J. L. M. Hermens, Chemosphere, 2000, 40, 875–883 CrossRef CAS PubMed.
- S. J. Enoch, M. Hewitt, M. T. D. Cronin, S. Azam and J. C. Madden, Chemosphere, 2008, 73, 243–248 CrossRef CAS PubMed.
- H. J. M. Verhaar, C. J. van Leeuwen and J. L. M. Hermens, Chemosphere, 1992, 25, 471–491 CrossRef CAS.
- G. Patlewicz, N. Jeliazkova, R. J. Safford, A. P. Worth and B. Aleksiev, SAR QSAR Environ. Res., 2008, 19, 495–524 CrossRef CAS PubMed.
- R Core Team, Vienna, Austria. http://www.r-project.org/, 2015.
- ECHA, https://echa.europa.eu/documents/10162/13632/information_requirements_r6_en.pdf (accessed March, 2015), 2008, 1–134.
- J. Kostal, A. Voutchkova-Kostal, B. Weeks, J. B. Zimmerman and P. T. Anastas, Chem. Res. Toxicol., 2012, 25, 2780–2787 CrossRef CAS PubMed.
- M. G. Barron, Environ. Sci. Technol., 1990, 24, 1612–1618 CrossRef CAS.
- M. G. Barron, G. R. Stehly and W. L. Haytorr, Aquat. Toxicol., 1990, 17, 187–212 CrossRef CAS.
- S. P. Bradbury, T. C. Feijtel and C. J. Van Leeuwen, Environ. Sci. Technol., 2004, 463–470 CrossRef.
- T. W. Schultz, M. T. D. Cronin, J. D. Walker and A. O. Aptula, J. Mol. Struct.: THEOCHEM, 2003, 622, 1–22 CrossRef CAS.
- B. I. Escher, R. Ashauer, S. Dyer, J. L. M. Hermens, J. H. Lee, H. A. Leslie, P. Mayer, J. P. Meador and M. S. J. Warnekk, Integr. Environ. Assess. Manage., 2011, 7, 28–49 CrossRef CAS PubMed.
- J. M. McKim, P. K. Schmieder, G. J. Niemi, R. W. Carlson and T. R. Henry, Environ. Toxicol. Chem., 1987, 6, 313–328 CrossRef CAS.
- S. P. Bradbury, T. R. Henry, G. J. Neimi, R. W. Carlson and V. M. Snarski, Environ. Toxicol. Chem., 1989, 8, 247–261 CrossRef CAS.
- B. I. Escher and J. L. M. Hermens, Environ. Sci. Technol., 2002, 36, 4201–4217 CrossRef CAS PubMed.
- U. E. Ramos, W. H. J. Vaes, H. J. M. Verhaar and J. L. M. Hermens, J. Chem. Inf. Model., 1998, 38, 845–852 CrossRef.
- G. D. Veith and S. J. Broderius, Environ. Health Perspect., 1990, 87, 207–211 CrossRef CAS PubMed.
- A. P. van Wezel and A. Opperhuizen, Crit. Rev. Toxicol., 1995, 25, 255–279 CrossRef CAS PubMed.
- B. I. Escher, R. I. L. Eggen, U. Schreiber, Z. Schreiber, E. Vye, B. Wisner and R. P. Schwarzenbach, Environ. Sci. Technol., 2002, 36, 1971–1979 CrossRef CAS PubMed.
- G. D. Veith, Can. J. Fish. Aquat. Sci., 1983, 40, 743–748 CrossRef CAS.
- G. D. Veith, D. De Foe and M. Knuth, Drug Metab. Rev., 1984, 15, 1295–1303 CrossRef CAS PubMed.
- G. D. Veith and S. J. Broderius, in QSAR in Environmental Toxicology, ed. K. L. E. Kaiser and D. Reidel, Dordrecht, The Netherlands, 1987, vol. II, pp. 385–391 Search PubMed.
- H. Konemann, Toxicology, 1981, 19, 209–221 CrossRef CAS PubMed.
- T. Schultz and B. A. Moulton, QSAR Environ. Toxicol., 1984, 337–357 CAS.
- T. W. Schultz, Ecotoxicol. Environ. Saf., 1987, 14, 178–183 CrossRef CAS PubMed.
- W. T. Schultz, N. L. Wyatt and D. T. Lin, Bull. Environ. Contam. Toxicol., 1990, 44, 67–72 CrossRef PubMed.
- P. Reuschenbach, M. Silvani, M. Dammann, D. Warnecke and T. Knacker, Chemosphere, 2008, 71, 1986–1995 CrossRef CAS PubMed.
- J. M. McKim, S. P. Bradbury and G. J. Niemi, Environ. Health Perspect., 1987, 71, 171–186 CrossRef CAS PubMed.
- J. Hermens, P. Leeuwangh and A. Musch, Ecotoxicol. Environ. Saf., 1984, 8, 388–394 CrossRef CAS PubMed.
- M. Nendza and A. Wenzel, Environ. Sci. Pollut. Res., 2006, 13, 192–203 CrossRef CAS PubMed.
- C. L. Russom, S. P. Bradbury, S. J. Broderius, D. E. Hammermeister and R. A. Drummond, Environ. Toxicol. Chem., 1997, 16, 948–967 CrossRef CAS.
- J. W. Deneer, T. L. Sinnige, W. Seinen and J. L. M. Hermens, Aquat. Toxicol., 1987, 10, 115–129 CrossRef CAS.
- J. W. Deneer, W. Seinen and J. L. M. Hermens, Aquat. Toxicol., 1988, 12, 185–192 CrossRef CAS.
- J. Hermens, F. Busser, P. Leeuwanch and A. Musch, Toxicol. Environ. Chem., 1985, 9, 219–236 CrossRef CAS.
- T. W. Schultz, T. I. Netzeva, D. W. Roberts and M. T. D. Cronin, Chem. Res. Toxicol., 2005, 18, 330–341 CrossRef CAS PubMed.
- G. L. Flynn and S. H. Yalkowsky, J. Pharm. Sci., 1972, 61, 838–852 CrossRef CAS PubMed.
- J. Saarikoski and M. Viluksela, Ecotoxicol. Environ. Saf., 1982, 6, 501–512 CrossRef CAS PubMed.
- K. Kaila and J. Saarikoski, Comp. Biochem. Physiol. C., 1980, 65C, 17–24 CAS.
- M. E. Farquharson, J. C. Gage and J. Northovert, Br. J. Pharmacol., 1958, 13, 20–24 CrossRef CAS PubMed.
Footnote |
| † Electronic supplementary information (ESI) available: Toxicity and property data for chemicals in the test set and data quality figures. See DOI: 10.1039/c6gc00720a |
| This journal is © The Royal Society of Chemistry 2016 |