DOI:
10.1039/C6GC00541A
(Paper)
Green Chem., 2016,
18, 4198-4204
Influence of irradiance on the photochemical reduction of europium(III)
Received
19th January 2016
, Accepted 26th April 2016
First published on 26th April 2016
Abstract
The influence of irradiance on the photochemical reduction of europium(III) to europium(II) is studied. It is known that europium removal from various rare-earth mixtures is feasible by means of photochemical reduction followed by precipitation, but the effect of the nature of the light source has not been investigated in detail yet. It is shown that irradiance rather than electrical power is a key parameter to characterize light sources used for photochemical experiments and to compare experiments with set-ups using different light sources. The irradiance of a light source, expressed in Watts per unit of area (mW cm−2), has a crucial impact on the photochemical reduction of europium(III) in aqueous media, in particular on the illumination time needed for europium removal from the solution. The influence of the irradiance on the induction time (a period with no or little europium removal in the first illumination hours), the europium removal rate after the induction time, the overall removal time and the time needed to remove 50% of the initial europium content from the solution (t50%) is studied. It is observed that higher irradiances result in shorter induction times, faster europium removal rates, lower t50% and hence shorter overall illumination times. The threshold irradiance to obtain 50% europium removal in 36 hours was found to be 2.7 mW cm−2, with an induction time of 28 hours. The residual europium content in all samples was lower than 2.5%, resulting in removal efficiencies of over 97.5%. This residual europium content seems to be increasing when the relative irradiance related to the back-oxidation increases, although this correlation cannot be fully explained yet. This work gives new insights that can be used for the photochemical recycling of europium from end-of-life red phosphors in compact fluorescent lamps (CFLs).
Introduction
Photochemical separations of rare earths have been performed using different kinds of light sources such as excimer lasers, high-pressure mercury lamps and low-pressure mercury lamps.1–19 The high selectivity for reduction of europium(III) in aqueous solution has been demonstrated, due to the fact that europium has a relatively stable divalent oxidation state in water (E° = −0.34 V), while most other rare earths only exhibit a stable trivalent state.20,21 The only other exception is cerium, which can occur in the tetravalent state in aqueous media.22–25 Europium has been separated from aqueous mixtures of rare earths by photochemical reduction and subsequent precipitation as EuSO4, since EuSO4 is very sparingly soluble in water.26 Different parameters influencing this separation have been investigated, such as the initial europium concentration, sulfate-to-europium ratio, europium-to-total-rare-earth ratio, pH, type and concentration of scavenger and additives such as H2O2.8,13,17,27,28 These parameters have been studied as a function of the illumination time. For most of the chemical parameters, extensive data sets have been collected. However, the data obtained by use of different light sources are difficult to compare. Moreover, most papers only mention the type of light source and the electrical power of the lamps used, whereas details regarding the illumination area and the distance between the samples and the light source are omitted. These are crucial details needed for a full understanding of the reaction, since the amount of actual light (i.e. the irradiance, expressed in W m−2) is the real driving force of the reaction. The irradiance decreases rapidly with the distance, and more focused light sources such as lasers have a higher irradiance than mercury lamps since the light power is irradiated on a smaller surface. Hence, instead of characterizing a light source by its electrical power, it is more correct to describe the true amount of light that reaches a reactor vessel by determining the irradiance. In this work, the influence of the irradiance on the photochemical reduction of europium(III) to europium(II) is described.
Background
Photochemical redox reactions with europium occur when a solution containing europium(III) is illuminated by a UV source. Some wavelengths promote photochemical reduction (eqn (1)–(3)) due to a charge-transfer band, while others provoke oxidation via an f–d transfer (eqn (4)).17,29,30| |  | (1) |
| |  | (2) |
| |  | (4) |
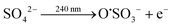
The sulfate ion in eqn (2) is added to precipitate the reduced Eu(II) species from the solution as EuSO4. The O˙SO3 radical formed in eqn (2) reacts further with water to yield a hydroxyl radical (eqn (5)), which are also created in eqn (1).
| | | O˙SO3− + H2O → HSO4− + ˙OH | (5) |
These radicals cause unwanted back-oxidation (eqn (6)) and should be destroyed by a scavenger, for instance isopropanol (eqn (7)).2,4,7,13,17,31 The resulting organic radical on its turn triggers an additional reduction of europium(III) (eqn (8)).5,32–36
| | | [(Eu2+)* − ˙OH] → Eu3+ + OH− | (6) |
| | | (CH3)2CHOH + ˙OH → H2O + (CH3)2C˙OH | (7) |
| | | (CH3)2C˙OH + Eu3+ → Eu2+ + (CH3)2CO + H+ | (8) |
Other back-reactions occur under the influence of protons, either a direct oxidation (eqn (9)) or a photochemical oxidation via an f–d transfer as explained earlier (eqn (4)).5,36,37
| | | (Eu2+)* + H3O+ → Eu3+ + H2O + H | (9) |
The influence of parameters such as pH, type and amount of scavenger, have been described in a previous paper.17 In this study, the light source parameters influencing the photochemical reduction of europium are investigated. The wavelengths for photochemical reduction correspond perfectly with the output of low pressure mercury lamps (LPMLs), hence this will be the type of light source used for the experiments. However, LPMLs also have some output around 366 nm, a wavelength associated with photochemical oxidation of europium(II) (eqn (4)). Although the intensity at this wavelength is quite low, the absorption coefficient for this f–d band is very high and therefore this will still cause photochemical oxidation.38,39
Experimental
Chemicals
Europium was added as its chloride hexahydrate salt (EuCl3·6H2O) and had a purity of 99.9% (Acros Organics). Ammonium sulfate (99.6%, Acros Organics) was added in its solid form. Isopropanol (99.5%, VWR) was used as a radical scavenger. A 1 M HCl stock solution (Fluka Chemicals) was used to obtain the desired pH by diluting it with ultrapure water (Milli-Q).
Light sources
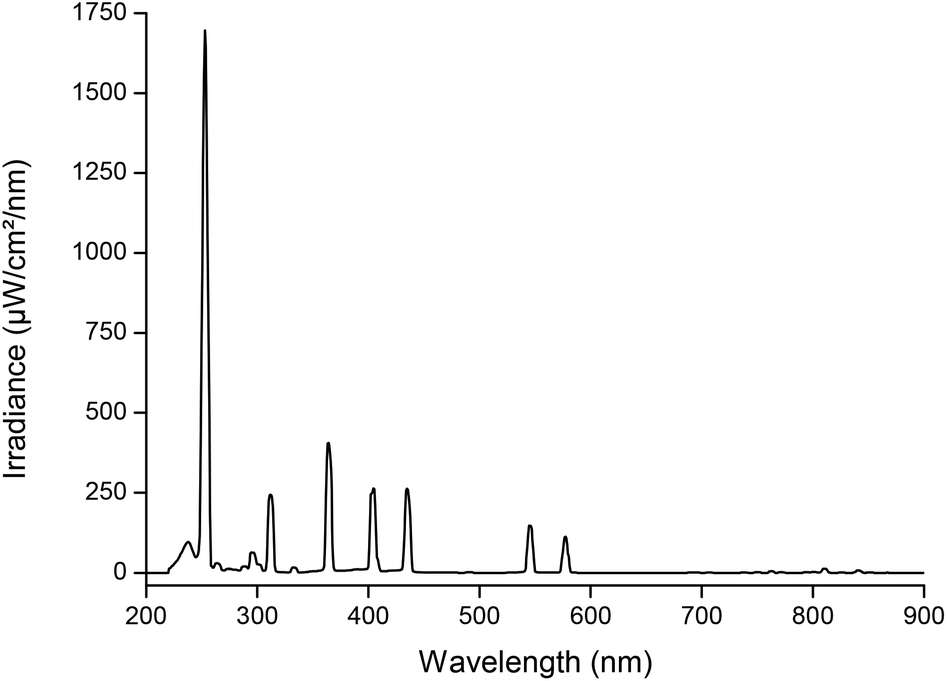
A 160 W U-shaped low-pressure mercury lamp (LPML) (UV Technik) with an arc length of 45 cm was used for the experiments, equipped with a DVG 200 electronic ballast (UV Technik). The irradiance profile of the lamp, measured at 25 mm, is shown in Fig. 1. The output below 200 nm (peak at 185 nm) is totally absorbed by the quartz glass of the lamp. The lamp irradiance is varied by placing the lamp further or closer to the reactors.
 |
| | Fig. 1 Irradiance profile of a 160 W low-pressure mercury lamp (LPML) measured at a distance of 25 mm from the light source. | |
The spectral output of the LPML was measured using a QE65 Pro Scientific Irradiance meter (Ocean Optics) at varying distances from the light source, according to the distance between the lamp and the sample solution surface. The irradiance meter was calibrated by a DH-2000 calibration light source (Ocean Optics) for a spectral region between 200 and 900 nm.
Set-up
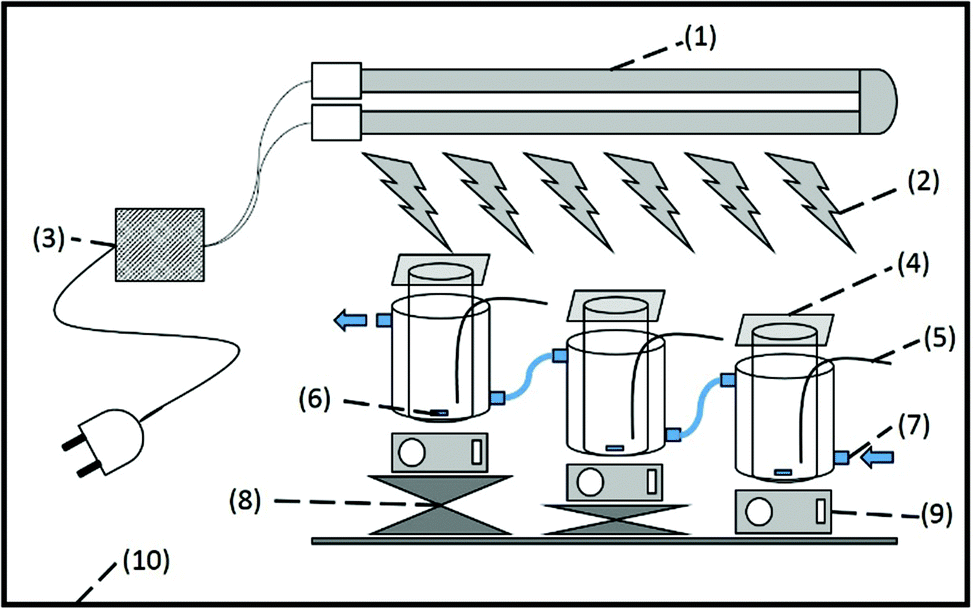
Mixtures of 10 mM EuCl3·6H2O and 50 mM (NH4)2SO4 were prepared by dissolving the appropriate amount in 80 mL of a HCl solution of pH 4. Immediately prior to illumination, 20 vol% (16 mL) isopropanol was added. The reaction mixture was poured into a reactor. Jacketed cylindrical reactor vessels (diameter = 4 cm) with a total volume of 100 mL were used to contain the sample solution. The reactors were covered with rectangular 5 × 5 cm2 quartz glasses which are transparent for wavelengths longer than 200 nm. A cooling bath (Julabo F12-ED) applied cooling to 20 °C. The solution was magnetically stirred during the reaction. The 160 W LPML was placed horizontally above the reactor vessels to provide illumination from the top. The distance between the solution surface and the arc of the lamp was varied for different experiments. The set-up is depicted in Fig. 2.
 |
| | Fig. 2 Experimental set-up. (1) 160 W U-shaped low-pressure mercury lamp, (2) UV irradiation, (3) electronic ballast, (4) quartz covering plate, (5) sampling tube, (6) magnetic stirring bar, (7) cooling jacket (arrows indicate water flow), (8) height adjuster to vary lamp-to-solution surface distance, (9) magnetic stirring plate, (10) protective dark box. | |
The whole set-up was constructed in a sealed dark box to protect the surroundings against the hazardous UV radiation. Special UV protective goggles (LOT-Oriel) were worn during the experiment.
Solutions were illuminated for several hours and samples were taken at various time intervals in order to determine the rare-earth concentration in solution at different illumination times. An aliquot of the sample solution (0.5 mL) was centrifuged at 4000 rpm for 10 min in an Eppendorf tube of 1.6 mL to separate any EuSO4 precipitation from the supernatant. An aliquot of the supernatant (100 μL) was taken for analysis of the metal content.
Analysis equipment
The metal concentration of the liquid phase was measured by total-reflection X-ray fluorescence (TXRF) spectrometry, using a Bruker S2 Picofox TXRF spectrometer. An aliquot of the sample (100 μL) was mixed with 100 μL of a 1000 mg per L gallium internal standard solution and diluted with 800 μL of ultrapure water (Milli-Q). A droplet of 7 μL was put on a quartz sample carrier, which was precoated with a silicone solution in isopropanol (SERVA) to make the carrier hydrophobic in order to avoid spreading of the sample droplet on the carrier. The quartz glasses were dried in an oven at 60 °C for 30 min and analyzed with the TXRF spectrometer.
Results and discussion
Irradiance is a quantity expressed in Watt per surface area, in this context as mW cm−2. The indication of power here is not the electrical power of the lamp but the actual radiant flux per unit of area. This quantity is sometimes confused with intensity. The value of the irradiance is a measure of the lamp power. The electrical power should not be taken as a parameter to characterize light sources, since lamps with lower electrical power can have higher irradiances at certain wavelength intervals. A the light of LPMLs is not collimated, the irradiance (I) decays with increasing distance (d) from the light source, according to the inverse square law (eqn (10)).40,41| |  | (10) |
Experiments are conducted at various distances between the solution surface and a 160 W LPML. The irradiance at the different distances is shown in Fig. 3, for wavelength intervals 200–280 nm (corresponding to the photochemical reduction by sulfate, eqn (2) and (3)), 350–380 nm (related to the photochemical re-oxidation of Eu(II), eqn (4)) and 200–900 nm (full spectrum). Ten different lamp- to solution-surface distances were used (25, 35, 45, 55, 65, 70, 75, 100, 125 and 145 mm).
 |
| | Fig. 3 Irradiance of 160 W LPML for three wavelength intervals (200–280 nm, 350–380 nm, 200–900 nm) at different distances corresponding to the lamp-to-solution surface distance during the experiments. | |
Fig. 4 shows the results of the removal of europium from the solution as a function of the illumination time for the different experiments. The graphs show three regimes, as indicated on Fig. 5: (1) an induction period with no or very little europium removal; (2) a linear decrease of the europium concentration and (3) a part where no further europium removal is observed and the concentration remains constant at a residual level.
 |
| | Fig. 4 Europium removal versus illumination time for eight different irradiances, expressed in mW cm−2. | |
 |
| | Fig. 5 Indication of the three regimes: (1) induction time, (2) linear-like removal, (3) residual europium content. | |
These three regimes are compared for the different irradiance experiments, as well as the overall removal time (= the sum of the induction time and the linear removal regime). All results are explained with respect to the irradiance in the wavelength interval of 200–280 nm, unless stated otherwise.
Induction time
An induction time is observed before the precipitation of EuSO4 starts. This has been reported earlier and is attributed to the formation of organic radicals (eqn (7)).5,7,17 In an early stage of the reaction, there is a low radical concentration. Once a sufficient radical concentration has built up, the reduction rate increases rapidly. Another reason for the sudden increase in removal of europium from the solution could be the nucleation-dependent formation of the precipitate. Once a few nuclei have been formed, they act as seeds and trigger more nucleation to grow additional crystals. Towards the end point, the removal rate slows down due to the lower availability of europium ions. A low europium concentration also decreases the nucleation rate.
This induction time is clearly shorter for higher irradiances and this trend is seen throughout all experiments, as seen in Fig. 6. For the experiments at a distance of 125 mm (2.2 mW cm−2) and 145 mm (1.9 mW cm−2), induction times of longer than 45 h were observed, after which europium removal eventually occurred. These values are omitted in Fig. 6 since the duration of the induction time was not recorded in detail. The concentrations measured during these two experiments are reported in Table 1, but not taken into consideration in the processing of the results due to the low amount of samples and hence the lack of reliable data.
 |
| | Fig. 6 Induction time for different irradiances. | |
Table 1 Europium concentration versus illumination time for the experiments at a distance of 125 mm (2.2 mW cm−2) and 145 mm (1.9 mW cm−2), expressed in % europium in solution
| Illumination time (h) |
2.2 mW cm−2 (125 mm) |
1.9 mW cm−2 (145 mm) |
| 0 |
100 |
100 |
| 28 |
100 |
100 |
| 37 |
100 |
100 |
| 45 |
100 |
100 |
| 57 |
26.9 |
60.1 |
| 60 |
8.9 |
44.9 |
Linear-like removal
Once the induction time has passed, a linear-like removal of europium is observed during several hours. This linear regime stops when a constant value is achieved, and from this point on no further europium removal takes place (see Fig. 5). The experiments show differences in removal rate, described by the slope of this linear regime. For higher irradiances, the removal rates are higher and therefore the duration of linear-like removal regime is shorter. The removal rates of europium are summarized in Table 2, expressed in both mM per hour and % per hour.
Table 2 Removal rates of europium for different distances during the linear-like removal regime, expressed in mM h−1 and % h−1
| Irradiance (mW cm−2) |
Removal rate (mM h−1) |
Removal rate (% h−1) |
|
Based on 2 data points at t = 57 h and t = 60 h (see Table 1).
|
| 11.6 |
1.11 |
11.9 |
| 8.0 |
0.82 |
8.9 |
| 5.2 |
0.75 |
8.2 |
| 4.5 |
0.74 |
8.1 |
| 4.0 |
0.64 |
7.1 |
| 3.5 |
0.63 |
7.0 |
| 3.4 |
0.60 |
6.4 |
| 2.7 |
0.54 |
6.1 |
| 2.2a |
0.53 |
6.0 |
| 1.9a |
0.45 |
5.1 |
Overall removal time
Since the induction time is shorter for higher irradiances, and the removal rate is higher in these experiments as well, a faster overall europium removal time is observed when higher irradiance is applied. For irradiances of 2.2 and 1.9 mW cm−2, no end of the linear regime was observed since the induction time was too long and the removal rate was too slow. Longer illumination times would eventually lead to total europium removal, but this long illumination times are not feasible.
50% removal time
To easily compare experiments, the parameter ‘50% removal time’ is introduced, a value for the illumination time at which 50% of the initial europium concentration is removed, indicated as t50%. The results are presented in Table 3. For the two lowest irradiances (at 2.2 mW cm−2 and 1.9 mW cm−2), no t50% is set, since not enough data points were available for a reliable extrapolation. The t50% gradually increases from 10.7 h for 11.6 mW cm−2 to 36.3 h for an irradiance of 2.7 mW cm−2.
Table 3 Irradiance versus time needed to obtain 50% europium removal (t50%)
| Irradiance (mW cm−2) |
t
50% (h) |
| 11.6 |
10.7 |
| 8.0 |
15.1 |
| 5.2 |
16.2 |
| 4.5 |
19.3 |
| 4.0 |
22.2 |
| 3.5 |
26.2 |
| 3.4 |
31.5 |
| 2.7 |
36.3 |
Residual europium content
The presence of light output at 366 nm combined with the low solubility of EuSO4 (Ksp = 1.5 × 10⁻⁹) accounts for a small residual europium content that cannot be removed.42 In all experiments, this residual europium amount is below 2.5%, resulting in a removal efficiency of higher than 97.5%. There is a trend, although not entirely clear: the ratio between the forward and backward reaction decreases for increasing distance, as reported in Table 4. The residual amount of europium is quite high for the shortest distance, this could be attributed to the high amount of back reaction. From then on, the residual europium concentration rises with increasing distance and hence with higher relative output for the back reaction. One exception is seen at 55 mm, where the residual amount europium is unexpectedly high. It should be noted that for all experiments the residual amount of europium only varied slightly, between 1.1 and 2.4%. Also, the irradiance ratio does not differ strongly, therefore no firm conclusions can be drawn regarding the residual europium content with respect to the irradiances at the different wavelength intervals.
Table 4 Irradiance data and irradiance ratios versus residual europium content
| Irradiance 200–280 nm (mW cm−2) |
Irradiance 350–380 nm (mW cm−2) |
Irradiance ratio 200–280/350–380 |
Residual europium content (%) |
| 11.6 |
2.4 |
4.9 |
1.7 |
| 8.0 |
1.7 |
4.7 |
1.1 |
| 5.2 |
1.3 |
3.8 |
1.3 |
| 4.5 |
1.2 |
3.7 |
2.2 |
| 4.0 |
1.2 |
3.5 |
1.5 |
| 3.5 |
1.0 |
3.4 |
2.0 |
| 3.4 |
1.0 |
3.4 |
2.4 |
| 2.7 |
0.8 |
3.4 |
2.4 |
Threshold irradiance
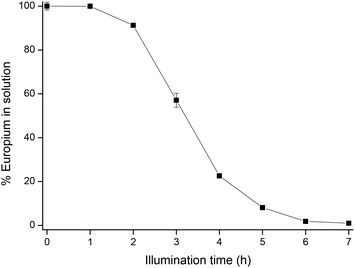
For 2.7 mW cm−2, an induction time of 28 h is observed prior to the europium removal. Subsequently, it takes 8 h to achieve 50% europium removal and another 8 h to reach the end point at a residual europium content of 2.4%. This time frame is considered the limit for a feasible process, resulting in an arbitrary threshold irradiance for europium removal from aqueous solutions at an irradiance of 2.7 mW cm−2. This value can be used to assess the suitability of a light source for photochemical europium reduction, by simply measuring the irradiance output. Lower irradiances will eventually lead to europium removal as well, but not within a reasonable time frame for both the induction time, the linear-like removal regime and the t50%.
Reactor configuration
According to Beer–Lambert's law (eqn (11)), light absorption is proportional to the path length, in this case the reactor depth:where A is the absorbance, ε the molar absorptivity, l the path length and c the concentration. Therefore, it is expected that for the same irradiance at the solution surface, the total illumination time would be shorter when using shallower reactors, as a result of a shorter induction time and higher removal rate. This hypothesis has been confirmed by an additional experiment, carried out with the same europium solution under identical circumstances in a reactor with a diameter of 5 cm and a depth of 4 cm. The irradiance at the solution surface was 11.6 mW cm−2. The results are shown in Fig. 7.
 |
| | Fig. 7 Removal of europium in a reactor with a depth of 4 cm, with an irradiance of 11.6 mW cm−2 at the solution surface. | |
The induction time decreased from 6 h to approximately 2 h, and the reaction rate reached 2.34 mM h−1 instead of 1.11 mM h−1. This shows that reducing the reactor depth results in a faster overall reaction. Therefore, shorter illumination times could be obtained when running the reaction in UV-transparent micro- or millichannels.43 The choice for millichannels would be more appropriate here, since the formation of solid EuSO4 crystals could readily clog narrow microchannels, hence blocking the flow through the channels. The use of a millireactor in a continuous-flow operation could signify an important breakthrough towards more efficient reactor design for future industrial implementation.
Conclusions
Irradiance rather than electrical power of a light source has a crucial impact on the photochemical reduction of europium in aqueous media. It was observed that higher irradiances cause faster reduction of europium(III) due to shorter induction times and faster removal rates. The same trend was seen for the time needed to reach the 50% europium removal mark (t50%). The residual europium content in all samples was lower than 2.5%, resulting in removal efficiencies of over 97.5%. The residual europium content seems to be increasing when the relative irradiance related to the back oxidation increases, although this correlation was not entirely clear. The irradiance value of 2.7 mW cm−2 is arbitrarily set as the threshold irradiance for photochemical removal of europium from aqueous solutions, with an induction time of 28 h, a linear removal regime of 16 h and a t50% which is reached after 36 h. Any longer time needed to reduce Eu(III) to Eu(II) and subsequently precipitate it, is regarded to be infeasible. Illumination below this irradiance does not significantly induce europium reduction and subsequent removal from the solution. The europium recovery at this threshold irradiance is 97.6%. This threshold irradiance can be used to assess whether a light source is suited for photochemical reduction of europium from aqueous solutions.
This work provides important new insights in the role of irradiance for photochemical removal of europium, which could prove very useful for europium recovery from end-of-life red phosphors in compact fluorescent lamps (CFLs).44,45 Since the solvent, i.e. water, and all other ions in solution are UV-transparent and not photochemically active in this wavelength region, they will not be affected by the illumination with UV radiation, and therefore high-purity europium is produced in a single step.
Acknowledgements
This project has been supported by KU Leuven (projects GOA/13/008 and IOF-KP RARE3) and the IWT (PhD fellowship to Bart Van den Bogaert).
Notes and references
-
T. Donohue, US Patent, 4172775, 1979 Search PubMed.
- T. Donohue, J. Chem. Phys., 1977, 67, 5402–5404 CrossRef CAS.
- T. Donohue, Opt. Eng., 1979, 18, 181–186 CrossRef CAS.
- Y. Haas, G. Stein and R. Tenne, Isr. J. Chem., 1972, 10, 529–536 CrossRef CAS.
- Y. Haas, G. Stein and M. Tomkiewicz, J. Phys. Chem., 1970, 74, 2558–2562 CrossRef CAS.
- T. Hirai and I. Komasawa, Ind. Eng. Chem. Res., 1995, 34, 237–243 CrossRef CAS.
- T. Hirai, N. Onoe and I. Komasawa, J. Chem. Eng. Jpn., 1993, 26, 64–67 CrossRef CAS.
- E. Kim, S. Kwon, E. Lee and J. Yoo, Korean J. Chem. Eng., 2002, 19, 305–308 CrossRef CAS.
- H. Kunkely and A. Vogler, Inorg. Chem. Commun., 2005, 8, 117–118 CrossRef CAS.
- M. Kusaba, N. Nakashima, Y. Izawa, C. Yamanaka and W. Kawamura, Chem. Phys. Lett., 1994, 221, 407–411 CrossRef CAS.
- M. Kusaba, N. Nakashima, W. Kawamura, Y. Izawa and C. Yamanaka, J. Alloys Compd., 1993, 192, 284–286 CrossRef CAS.
- M. Kusaba, N. Nakashima, W. Kawamura, Y. Izawa and C. Yamanaka, Chem. Phys. Lett., 1992, 197, 136–140 CrossRef CAS.
- C. A. Morais and V. S. T. Ciminelli, Sep. Sci. Technol., 2002, 37, 3305–3321 CrossRef.
- H. L. Pinch, J. Am. Chem. Soc., 1964, 86, 3167–3168 CrossRef CAS.
- L.-F. Qiu, X.-H. Kang and T.-S. Wang, Sep. Sci. Technol., 1991, 26, 199–221 CrossRef CAS.
- S. Tsushima, S. Nagasaki and A. Suzuki, J. Photochem. Photobiol., A, 1997, 106, 57–60 CrossRef CAS.
- B. Van den Bogaert, D. Havaux, K. Binnemans and T. Van Gerven, Green Chem., 2015, 17, 2180–2187 RSC.
- Y. Yamada and S.-I. Ohno, Bull. Chem. Soc. Jpn., 1991, 64, 926–930 CrossRef CAS.
- Y. Yamada and S. Ohno, Chem. Lett., 1991, 20, 465–468 CrossRef.
-
S. Cotton, Lanthanide and Actinide Chemistry, Wiley, West Sussex, 2005 Search PubMed.
- C. A. Morais and V. S. T. Ciminelli, Hydrometallurgy, 2001, 60, 247–253 CrossRef CAS.
- A. A. Nemodruk, E. V. Bezrogova and B. F. Myasoedov, J. Anal. Chem. – USSR, 1973, 28, 1728–1737 Search PubMed.
- T. Donohue, Chem. Phys. Lett., 1979, 61, 601–604 CrossRef CAS.
- M. Das, A. H. Heyn, M. Z. Hoffman and R. P. Agarwal, Talanta, 1970, 17, 925–935 CrossRef CAS PubMed.
- A. B. Yusov and V. P. Shilov, Russ. Chem. Bull., 2000, 49, 1925–1953 CrossRef CAS.
-
W. Haynes, Handbook of Chemistry and Physics, CRC Press, London, 92nd edn, 2011 Search PubMed.
- G. D. Klungness and R. H. Byrne, Polyhedron, 2000, 19, 99–107 CrossRef CAS.
- H. T. S. Britton, J. Chem. Soc. Trans., 1925, 127, 2142 RSC.
- J. C. Barnes and P. Day, J. Chem. Soc., 1964, 3886–3892 RSC.
- T. Donohue, Chem. Phys. Lett., 1977, 48, 119–121 CrossRef CAS.
- T. Hirai and I. Komasawa, J. Chem. Eng. Jpn., 1992, 25, 644–648 CrossRef CAS.
- A. Bakac, J. H. Espenson, J. Lovric and M. Orhanovic, Inorg. Chem., 1987, 26, 4096–4099 CrossRef CAS.
- A. Bakac, V. Butkovic, J. H. Espenson, J. Lovric and M. Orhanovic, Inorg. Chem., 1989, 28, 4323–4326 CrossRef CAS.
- M. Shimura and J. Espenson, Inorg. Chem., 1983, 22, 334–337 CrossRef CAS.
- S. Muralidharan and J. H. Espenson, Inorg. Chem., 1984, 23, 636–639 CrossRef CAS.
- D. D. Davis, K. L. Stevenson and G. K. King, Inorg. Chem., 1977, 16, 670–673 CrossRef CAS.
- A. Matsumoto and N. Azuma, J. Phys. Chem., 1988, 92, 1830–1835 CrossRef CAS.
- J. Jiang, N. Higashiyama, K. Machida and G. Adachi, Coord. Chem. Rev., 1998, 170, 1–29 CrossRef CAS.
-
V. Sastri, J. Perumareddi, V. Ramachandra, G. Rayudu and G. Bunzli, Modern Aspects of Rare Earths and their Complexes, Elsevier, Amsterdam, 2003 Search PubMed.
- R. S. Beolchi, C. Moura-Netto, R. M. Palo, C. R. G. Torres and B. Pelissier, Braz. Oral Res., 2015, 29, 1–7 CrossRef PubMed.
- J. Tavares, A. Dias, L. P. Sosman, R. J. M. da Fonseca, L. A. C. R. da Mota and M. Muramatsu, AIP Conf. Proc., 2008, 992, 193–198 CrossRef.
-
H. Hein, H. Hinz, I. Merlet, P. Vetter and U. Bergmann, Handbuch der Anorganischen Chemie, Springer Verlag, Berlin, 8th edn, 1981 Search PubMed.
- D. Cambié, C. Bottecchia, N. J. W. Straathof, V. Hessel and T. Noël, Chem. Rev., 2016 DOI:10.1021/acs.chemrev.5b00707.
- K. Binnemans, P. T. Jones, B. Blanpain, T. Van Gerven, Y. Yang, A. Walton and M. Buchert, J. Cleaner Prod., 2013, 51, 1–22 CrossRef CAS.
- K. Binnemans and P. T. Jones, J. Rare Earths, 2014, 32, 195–200 CrossRef CAS.
|
| This journal is © The Royal Society of Chemistry 2016 |
Click here to see how this site uses Cookies. View our privacy policy here. 
 Open Access Article
 This Open Access Article is licensed under a Creative Commons Attribution-Non Commercial 3.0 Unported Licence