
 Open Access Article
 This Open Access Article is licensed under a Creative Commons Attribution-Non Commercial 3.0 Unported Licence
Adsorption of sucrose on zeolites†
Iris
Fornefett‡
,
Davud
Rabet
,
Christoph
Buttersack§
* and
Klaus
Buchholz¶
Institute of Carbohydrate Technology at the Technical University of Braunschweig, Germany. E-mail: buttersack@inc.uni-leipzig.de
First published on 26th January 2016
Abstract
The adsorption of sucrose on FAU type zeolites was measured depending on the ratio of Si/Al and the solvent composition (ethanol–water). The maximal loading was found to be 1 sucrose molecule per α-cage. The adsorption can proceed from water on strong dealuminated zeolites and from an ethanol water mixture on aluminum rich zeolites. To recover sucrose the zeolite can be treated with ethanol–water. Alternatively the liquid is first mixed with an alcohol, sucrose is adsorbed on a hydrophilic zeolite and desorbed by the addition of water. An application is reported for the desugarization of sugar-beet molasses and process liquids of a beet sugar factory. The adsorption obeys the Langmuir isotherm and is selective compared with other saccharides. The effective diffusion coefficient of sucrose inside the zeolite pores was measured.
1. Introduction
Due to the importance of carbohydrates as a renewable source of chemical and biotechnological transformations to valuable products, the use of zeolites has gained increasing interest. Currently the isomerization of glucose to fructose on a hydrophobic Sn-doped beta zeolite as a chemical alternative to the enzyme-catalyzed process is of special interest.1 Also in the separation technology zeolites were regarded as potential materials which can replace ion-exchange resins in the glucose–fructose separation. Between 1980 and 1990 the Ca-exchanged sulfonic acid resins in some process chromatographic units were replaced by Ca-exchanged zeolites.2 However, zeolites were shown to have a shorter life-time in water compared to the resins and that trial was shown to be unsuccessful. Nevertheless, the stability of zeolites in water may be improved in the future. Therefore, the application of zeolites in an aqueous environment is principally of ongoing interest. The use of zeolites in the chromatographic separation of carbohydrates was investigated with respect to mass transfer in detail, especially for the glucose–fructose separation,3–6 but also examples dealing with the separation of glucose–sucrose–sorbitol7 and fructose oligosaccharides have been reported.8 In these cases the zeolite was exchanged with alkali and alkaline-earth metal ions, and the specific interactions with different sugars were small but depending on the nature of the counter-ion.9,10The following presentation deals with the real adsorption of carbohydrates from the liquid phase which means that the saccharide molecules are enriched in the pores of the zeolite. High specific adsorption of carbohydrates on hydrophobic Y-zeolites with only negligible fraction of ionic sites has already been reported,11 and also beta zeolites were shown to have similar effects.12,13
Although carbohydrate molecules are commonly regarded as hydrophilic, they have hydrophobic CH2-moieties. Therefore, carbohydrates can be enriched within the micropores of activated carbon.14,15 In the case of hydrophobic zeolites an additional effect is superimposed by the geometrically defined rigid microenvironment of the pores. As shown by molecular simulation, the geometric restriction results in a change of the hydration sphere16 which again influences the specific nature of the hydrophobic interaction.
The following contribution is devoted to the adsorption of sucrose. Up to now solely the enrichment of sucrose on a strongly hydrophobic Y-zeolite (Si/Al = 130) has been reported11 while zeolite beta with only somewhat smaller pore geometry excludes the sucrose molecule.12 This contribution has firstly focused on the broad spectrum of Y-zeolites ranging from the Si/Al ratios of 2.8 to 130, secondly the influence of ethanol admixed with the aqueous liquid phase is investigated.
2. Experimental
FAU-type zeolites with different degrees of aluminum content were provided by the former Degussa AG (now Evonik Industries AG). Zeolite DAY 130 powder and extrudates of that material (F20, 2 mm diameter) were commercial products; the others were laboratory prototypes in the powdered form. A usual Y-zeolite with an Si/Al ratio of 2.8 was industrially synthesized, all others were obtained by post-synthetic dealumination with SiCl4 in the gas phase.17 The zeolites were partly in the protonated form which caused some acid catalyzed hydrolysis to glucose and fructose. Therefore, they had to be transferred into the Na+-form. 100 g zeolite powder was suspended in 1 L solution of 0.2 M NaCl and the solution was brought to pH = 7. Subsequently the solution was boiled for 1 h. During that treatment the pH lowers to values of about 5. The zeolite was centrifuged, 3 times washed with distilled water, dried for 4 h at 110 °C, calcined for 4 h at 400 °C, and finally stored over P2O5.The original DAY zeolite was characterized by bulk analysis after dissolution in HCl and HF by ICP-OES with respect to the content of Al by an external laboratory (Eurofins Analytik, Hamburg, Germany). For other samples values were taken from the producer.
After evacuation at 400 °C the zeolites were characterized by obtaining the N2-adsorption–desorption isotherms at 77 K at the Institute of Non-classical Chemistry, Leipzig, Germany with Belsorp max (Bel Japan Inc.). The microporous volume and the external surface were obtained by nonlinear regression with SigmaPlot software according to the method of Remy and Poncelet,18 the C-value of the BET-term being fixed to 3.6. The calculation of mesopores based on the data from the adsorption branch was done according to the BJH method using the software of Autosorb software version 1.54 (2007) (Quantachrome Instruments) for p/po > 0.35.
Particle size analysis was performed by Laser diffraction spectrometry after ultrasonic treatment (Sympatec Helos, System-Partikel-Technik, Clausthal-Zellerfeld, Germany).
The water content of the dried zeolite samples was measured by direct Karl-Fischer titration. About 2 g of the zeolite were transferred to the titration vessel containing methanol and Hydranal® solvent (Sigma Aldrich) and automatically titrated with Hydranal® titrant by measuring the conductance using the dead-stop technique (Automat 633 and Dosimat 655, Metrohm, Switzerland).
The determination of the adsorption isotherms was performed by shaking 1 g zeolite in 5 mL solution of sucrose for 15 h. In the case of higher temperature some hydrolysis to fructose and glucose occurs, the mass balance being corrected by that amount. The exclusion of melezitose was measured by adding zeolite to a 10 g L−1 solution of melezitose. The ratio of zeolite to solution was 1.5, 2, 3, 4, 5, and 7. The carbohydrate concentrations before and after adsorption were measured by HPLC (250 × 4 cm, Aminex 87C Ca2+-ion-exchange resin from Biorad, flow: 0.3 mL min−1, RI detector ERC 7512 (Erma Inc.)) after centrifugation and membrane filtration (0.2 μm). The adsorption kinetics was measured by suspending 4 g DAY zeolite in 20 mL magnetically stirred sucrose solution (10 g L−1). Samples were immediately rapidly pressed through a 0.2 μm membrane.
Concerning the desugarization of molasses 1 g powdered zeolite as delivered without pretreatment was shaken in 10 mL solutions of 10 to 80 g L−1 freeze-dried molasses (sucrose content 48.8%) for 15 h. The concentration of glucose and sucrose was measured by using an amperometric substrate specific biosensor19 (YSI 2700 Biochemistry Analyzer, Xylem Inc.). For desorption the centrifuged zeolite was brought in contact with 5 mL ethanol–water (33![[thin space (1/6-em)]](https://www.rsc.org/images/entities/char_2009.gif) :67 v/v) for 15 h and the concentration of sucrose was measured by HPLC.
:67 v/v) for 15 h and the concentration of sucrose was measured by HPLC.
The filtered raw juice and thin juice were obtained as fresh samples from a running beet sugar factory. The juices were diluted up to a factor of 10 and then brought in contact with the zeolite as described above. Sugar was measured by polarimetry and by using the YSI analyzer. Glutamine and betaine were measured after the removal of colloids according to the established sugar beet analysis by HPLC. The purity of the liquids was defined by the quotient of refractometrically and polarimetrically determined sugar content.
For comparison the adsorption of sucrose on the original zeolite was measured from aqueous solution containing 0.2 M sodium phosphate buffer (pH 7.0).
Molecular modeling of sucrose was done with Hyperchem Professional Release 5. Five local minimum energy conformers in vacuo (S1–S5) were transferred from Tran and Brady20,21 as starting molecules for the optimization in a box of water by MM3 molecular mechanics. Hydration spheres were generated by a defined distance from the molecular surface.
3. Theory
In the liquid phase adsorption commonly the excess adsorption is used. It is defined by the change of concentration differences. With cio being the initial concentration of the substance i in the liquid state and ci the concentration in equilibrium with the zeolite with the mass mz in the added total liquid volume vLo, the concentration difference cio − ci is proportional to the excess adsorption: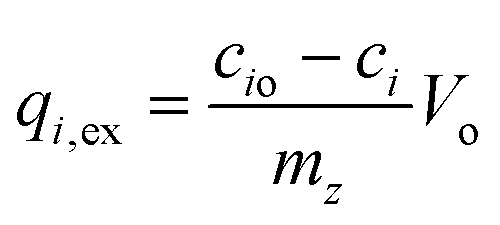 | (1) |
The value of qi,ex is positive in the case of an enrichment in the pores and negative when the substance i is excluded from the pore volume. The disadvantage of excess isotherms is that it yields no thermodynamic measures.
However, with respect to the defined pore volumes of zeolites, it is possible to obtain the true isotherm which is defined by the mass balance:
 | (2) |
| Vo = V + Vp | (3) |
| Vp = ωVomz/mo | (4) |
Besides the water, the adsorbed substance i is also present in the pore. Inside the pore both the components contribute to the filling of the pore.
| ω + qi = ωo. | (5) |
The combination of the eqn (2)–(5) yields the equation for the absolute isotherm:
 | (6) |
4. Results and discussion
4.1. Characterization of the zeolites
As shown in Table 1, all zeolites used here had microporous volumes around 0.32 cm3 g−1 and due to the gentle industrial dealumination with SiCl4 compared with acid dealumination the external surfaces and the mesopore volumes were low. Only those experiments, where the sugar solution also contained Na+ and K+ (section 4.8), were performed with the zeolites as delivered. Their aluminum sites contained both Na+ and H+ ions. All other experiments presented hereafter were performed with zeolites previously transferred into the complete Na+ form.| Si/Al | V micro/cm3 g−1 | V meso/cm3 g−1 | S ext/m2 g−1 | ω o/g g−1 | |
|---|---|---|---|---|---|
| Y 2.8 | 2.8 | 0.349 | 0.053 | 6.8 | 0.258 |
| DAY 7.6 | 7.6 | 0.318 | 0.047 | 19.1 | 0.240 |
| DAY 12.5 | 12.5 | 0.317 | 0.060 | 23.0 | 0.225 |
| DAY 28 | 28 | 0.315 | 0.047 | 18.6 | 0.238 |
| DAY 55 | 55 | 0.316 | 0.069 | 20.1 | 0.228 |
| DAY 130 | 128 | 0.319 | 0.109 | 16.1 | 0.255 |
It has to be mentioned that the used method was proven to be correct for usual and low dealuminated zeolites, but highly dealuminated zeolites were shown to be affected when the pH in the presence of Na+ and heat is near pH 7.22 Unfortunately that was found out only when all experiments of this study have been finished. However, some later controlling measurements with Na+ exchanged zeolite showed that the degradation of the micropore volume was not as great as feared. Due to this later characterization by N2-adsorption the saturation capacities of the adsorption of sucrose on DAY 130 and DAY 55 are expected up to 10% too low.
4.2. Rate of adsorption
Fig. 1 shows the rate of sucrose adsorption at DAY 130. A low temperature was chosen to record the up-take curve. The non-linear regression with the Fourier series23 terminated at the 10th term follows the blue line in Fig. 1 and yields an effective diffusion coefficient of 6.7 × 10⁻¹⁶ m2 s−1. According to the data of the laser diffraction the particle diameter used was 6 μm. Ruthven investigated the diffusion of glucose and fructose in a hydrophilic KX-zeolite and found much higher values, namely 1 × 10⁻¹³ m2 s−1 for each monosaccharide at 5 °C.24 Also amino acids such as glycine, alanine, and lysine diffuse much more rapidly (1.1, 5.0, and 1.5 × 10⁻¹³ m2 s−1 at 5 °C).25 Obviously sucrose is extremely slow because of its greater molecular dimension. While Ruthven used large 50 μm single crystals, the particles in this study are consisting of some hundred nm large nano-crystals which are intergrown, and perhaps some nano-crystals are only physically attached. The size measurement by laser diffraction was performed in aqueous suspension after an ultrasonic treatment, but the time and intensity, which should have an influence,13 and the pH, which again determines the ζ-potential,26 were not checked. | ||
| Fig. 1 Rate of sucrose adsorption from aqueous solution at DAY 130 zeolite at 5 °C. Regression line according to the Fourier series.23 | ||
Thus, the real intra-crystalline diffusion coefficient may be even smaller than 6.7 × 10⁻¹⁶ m2 s−1. The self-diffusion coefficient of sucrose in aqueous bulk water is 2.7 × 10⁻¹⁰ for a 10% solution and 0.23 × 10⁻¹⁰ m2 s−1 for a concentration of 50% w/w.27 The confinement effect of the micropores is obvious.
4.3. Adsorption isotherm
Fig. 2 shows the adsorption isotherm for sucrose at room temperature from pure water solution. The isotherm obeys the Langmuir law. For comparison, Fig. 2 also shows the adsorption of sucrose on activated carbon as reported in the literature.14 In contrast to the defined geometry of the zeolite pores, the carbon indeed contains micropores but the geometry is completely disordered.28,29 Therefore, the carbon adsorbs due to the Freundlich isotherm which means that at low sucrose concentrations the affinity is high but it decreases with increasing sucrose concentration. The Langmuir type adsorption by the zeolite is not only a hint on the equalized energetic adsorption sites, but also sorbate–sorbate interactions such as dimerization inside the pores are excluded. | ||
| Fig. 2 Excess and absolute adsorption isotherm of sucrose in water on zeolite DAY 130 (Langmuir) in comparison with the excess adsorption on activated carbon (Freundlich) at 20 °C (data taken from ref. 14). | ||
4.4. Adsorption of water
Fig. 2 shows an excess isotherm which can be transformed into the absolute isotherm by the parameter ωo according to eqn (7). This characteristic measure represents the maximal amount of water adsorbed per mass of zeolite. Under real conditions that value can be determined by bringing the dried zeolite in contact with an aqueous solution of a substance which cannot penetrate the zeolite micropores. For the excluded substance (ci = ce) the adsorbed amount is zero (qi = 0). Eqn (6) thus reduces to| ce,o/ce = (1 − ωomz/mo) ce | (7) |
 | ||
| Fig. 3 Distribution coefficient of melezitose between aqueous phase and zeolite DAY 130 at 20 °C according to eqn (7). | ||
A prerequisite of this method is the knowledge of the amount of residual water existing in the dried zeolite used. The most selective method of determining the water content is based on the use of the Karl-Fischer reagent. It has been shown that all water in NaY can be titrated by this method using methanol as the solvent.31,32 A test revealed water contents of 1.5% in zeolite DAY 12 and 0.5% in the more hydrophobic DAY 130.
The values of ωo should be compared with the micropore volumes as determined by the adsorption of liquid nitrogen at 77 K. In principle the micropore volume is located in two compartments. One is the α cage (super cage) with a free aperture of 0.74 nm accessible for the sucrose molecule. The other is located inside the β-cage (sodalite cage) with a free aperture of 0.22 nm which is accessible for water. But nitrogen with a kinetic diameter of 0.36 nm is not able to enter that space. The adsorption of nitrogen therefore describes the environment of the adsorbed sucrose molecule. Instead of nitrogen, adsorption using argon at 87 K is also possible. The obtained micropore volumes may be somewhat lower33 or higher34 but are close together for Y-zeolites.35
Hydrophilic zeolites are fully hydrated under atmospheric conditions. A natural Na+ containing faujasite (Si/Al = 1.5) has a water loading of 0.36 g g−1,36 and the water adsorption on a 13X zeolite (Si/Al = 1.3) has an extrapolated maximal loading of 0.341 g g−1,37 a value which can be compared with the micropore volume of the same zeolite from N2 adsorption at 77 K which is 0.318 cm3 g−1 according to our measurements. The calculated density of 1.07 g cm−3 can be explained by the high concentration of Na+ ions. Another example is given by the water loading of a Li+ exchanged LSX-zeolite (Si/Al = 1) which is 0.40 g g−1.38 Compared with the micropore volume of 0.350 cm3 g−1 given in the literature,39,40 the density is 1.14 g cm−3. Of interest here is only the water inside the α-cage. In the case of the lastly mentioned example only 1% of all water is outside the α-cage because that place is preferentially occupied by the Li+-ions.38 With the increasing Si/Al ratio indeed the part of water outside the α-cages is enhanced. At Si/Al = 3 the fraction is 10%.41 Further increase of the Si/Al ratio results in more space but also in more hydrophobicity so that water from the gas phase is present in an all-silica Y only at very high pressure.42 The adsorption of water on Y-zeolites with Si/Al = 40 from the gas phase was very much lower than that of benzene,43 and compared to activated carbon the adsorption of water on the DAY zeolite used here was only somewhat greater.44 In liquid water attractive forces between the condensed water molecules may change the interaction with the pore walls and thus enhance the penetration of the pores. But the extent of pore filling is unknown. The heat of immersion was found to decrease strongly with the ratio of Si/Al.45 An interesting experiment was reported by Thompson et al. They measured the adsorption of small concentrations of trichloroethylene in water by bringing in contact with a hydrophobic adsorbent (a) and by positioning it in the vapor phase above that solution (b). In the case of silicalite zeolite the isotherms were nearly equal, in the case of activated carbon the liquid adsorption was lower and in the case of the dealuminated Y-zeolite (Si/Al = 40) the liquid adsorption was extremely low. Most probably the strong hydrophobic and small pores of silicalite are free of water, while the pores of the dealuminated Y-zeolite contain water which slows down the migration of the hydrophobic molecules.46
According to Einicke et al.47,48 zeolites containing hydrophobic regions can be inaccessible to water and filled with dissolved air. This observation simply explains an earlier statement that the thermodynamic character of the adsorbed phase is radically different from the bulk phase.49 Air can be replaced by adsorption of organic substances dissolved in water and may appear in the form of gas bubbles when operating in a column. During elution of the column with water, gas is adsorbed from the liquid again.
Regarding our experiments dealing with the exclusion of melezitose one has to consider that indeed water is released from the pores but a part is filled with air. Only when the hydrophilic sucrose molecule enters the pores the void volume should be filled-up. Indeed, this could be measured by repeating the exclusion of melezitose in the presence of sucrose but instead it is simply presumed that the micropores as measured by N2 adsorption are completely filled with sucrose and water with an overall density of 1 g cm−3.
In order to calculate the absolute adsorption isotherm, the values of ωo are therefore taken from the micropore volume and not from the lower values measured by the exclusion of melezitose. For all dealuminated zeolites (DAY) the same value ωo = 0.32 and for the parent zeolite Y2.8 ωo = 0.35 were used. Fig. 2 shows that the isotherm can be fitted according to Langmuir:
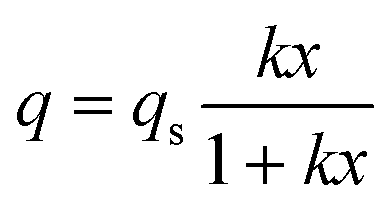 | (8) |
| K = qsk | (9) |
The state of sucrose within the zeolite pores can be described as follows. According to molecular modeling50 and in accordance with physicochemical methods51–54 the molecular volume is 0.341–0.344 nm3 depending on the conformation. A sphere of that volume would have a diameter of 0.87 nm and is regarded to be too big to enter the free aperture of the α-cage of 0.74 nm. Investigations using molecular simulation indeed have shown that zeolite frameworks display a geometric property termed a flexibility window.55 Experimentally it was shown that a bulky molecule such as 1,3,5-tri-t-butylbenzene with a minimum diameter of 0.90 nm can enter the pores of a NaX zeolite, although that size significantly exceeds 0.74 nm. However, to achieve that result, the temperature has to be elevated to 180 °C. The molecule is then irreversibly included in the pores. Also further treatment of the zeolite at 180 °C in vacuo results in the removal of only negligible quantities of the bulky molecule.56 However, the entry of sucrose into the α-cage proceeds at a temperature of only 5 °C (Fig. 1). The solution to that problem must be the flexibility of the glycosidic bond connecting the glucose and fructose moiety. Five energetically favored conformers (S1–S5) have been identified by molecular mechanics in vacuo.20,21 Only for understanding we present here our studies with the molecular modeling program of Hyperchem®. Starting from each optimal conformation the conformation was further optimized by putting it into a box of H2O. The most stretched conformer is S4. In a third step the central sucrose conformer together with a hydration shell of 0.4 nm was isolated and further optimized. The result is shown in Fig. 4. The hydrated sucrose is still too large to enter the pore, not only with respect to its size but also to its hydrophilic surface. When the hydration sphere is further diminished to 0.25 nm only 3 hydrating water molecules remain, and the surface character of the sucrose is now a mixture of hydrophilic and hydrophobic areas. Only in this state the sucrose docking at the pore openings at the surface of the zeolite crystals is possible. Perhaps all water has to be stripped-off as a prerequisite for entering the α-cage. Afterwards water molecules can diffuse into the adsorbed sucrose and fill-up the remaining volume with water but hydrophobic interactions of local CH2-regions with the siloxane surface of the pore must remain. The simulation of the whole process consisting of the little flexible zeolite framework and very flexible sucrose with water is expected to be an encouraging future work.
 | ||
| Fig. 4 Understanding of the interaction of sucrose at the interface of the aqueous solution and the hydrophobic Y-zeolite via the conformer S4 as modeled by MM3. | ||
The physical state of sugar and water confined in the pores approximately may be regarded as a liquid. The micropore volume detected by N2 adsorption (0.320 cm3 g−1) only includes the α-cage and the space inside the aperture of 0.74 nm. This volume is calculated by referring it to the mass of the unit cell (u.c.) which is given by Si192O384 for an ideal all silica Y-zeolite and yields 0.956 nm3 (u.c.)−1. This is the volume available for housing the sucrose molecule with a molecular volume of 0.3425 nm3 which is equivalent to 0.603 cm3 g−1. If we intuitively reckon that a maximum of one sucrose molecule is located in one α-cage, the intracrystalline sugar concentration would be 35.8% v/v. As the molecular sucrose volume (0.345 nm3) is equivalent to 0.603 cm3 g−1 with 1.0 cm3 g−1 for water, the solution inside the pores is calculated to have a formal concentration of 594 g L−1 and a density of 1.245 g cm−3. In a bulk solution such a concentrated liquid would have a real less differing density of 1.286 g cm−3.54 Starting with the intracrystalline sugar concentration of 35.8% v/v, together with the sucrose volume of 0.603 cm3 g−1 and the pore volume of 0.32 cm3 g−1 the saturation capacity qs is calculated to be 0.189 g g−1. That is very near to the experimental value of qs = 0.180 g g−1.
4.5. Influence of the Si/Al ratio
Due to the hydrophobic nature of the sucrose interaction with the zeolite the content of negatively charged aluminum sites must have an influence on the adsorption. Fig. 5 shows that adsorption obeys the Langmuir law where the Henry constant K increases with the increasing content of silicium. The function describing that dependence must obey the boundary conditions of an asymptotic approximation to a maximum value when the silicium content goes to infinity. One may assume that K is proportional to the fraction Si/(Si + Al), but the experimental data shows that the influence of Al is much stronger and may be proportional to Si/(Si + aAl) or given by:| K = Kop/(p + a) | (10) |
| p = Si/(Si + Al) | (11) |
 | ||
| Fig. 5 Langmuir isotherms for sucrose from water on Y-zeolites with different Si/Al at 20 °C. | ||
The respective function is shown in Fig. 6 and yields Ko = 26.9 ± 3.6 and a = 34 ± 11. Thus, Na+ ions inside the zeolite reduce the affinity while Na+ as a component of an added salt in the solution phase enhances the hydrophobic interaction.11
 | ||
| Fig. 6 Dependence of K and qs for the adsorption from water on the ratio of Si/Al at 20 °C. Modeling of K according to eqn (10) and (11). | ||
One may assume an analogous dependence of the saturation value qs. But as shown later in this article, the accessibility of the α-cage is not blocked by Na+ located at the surface of the cage, and due to the experiment only a weak linear decline with increasing Na+ has to be taken into account.
4.6. Dependence on temperature
The isotherms were measured at different temperatures between 5 and 60 °C. They are shown in the appendix (ESI, Fig. A1 and A2†). Fig. 7 shows the van't Hoff plots of the adsorption constants K for DAY 130. The calculated isosteric heat of adsorption is only −4.6 ± 0.6 kJ mol−1 and is similar to a value found for the interaction between maltose disaccharide and water in a C18-functionalized silica column (−4.4 kJ mol−1).57 However, the value found for the sucrose interaction at activated carbon was reported to be much higher (about −30 kJ mol−1).15 The low value in this study indicates that the adsorption is mainly governed by a change of entropy thus supporting the considerations concerning quite another state of the adsorbed sucrose compared to the bulk phase (Fig. 4). | ||
| Fig. 7 Dependence of the Henry constant K and the saturation adsorption qs on the temperature for the adsorption from water on DAY 130. | ||
Beside the Henry constant the extrapolated saturation value qs is also shown as a function of the temperature in Fig. 7. Theoretically, in the view of thermodynamics, that value is expected to be constant.58 As the molecular volume of sucrose inside the α-cage is expected to increase by about 2% by a shift from 5 to 60 °C (ref. 54) one would expect a slight decrease of qs with increasing the temperature, and the adsorption of other carbohydrates on apolar zeolites yielded a corresponding behaviour.59 However, in the case of sucrose the experimental data surprisingly show the opposite effect.
| qs = (308 ± 64) − (35 ± 19)(1000/T) |
One may consider perhaps an experimental failure. In the case of the measurement at 60 °C some glucose and fructose were found after equilibration for 15 h which is due to some catalysis by traces of protons remaining in the zeolite.60 As glucose and fructose are not adsorbed on the zeolite11 the concentration of the monosaccharides (less than 1.5%) was simply subtracted from the initial concentration of sucrose. We think that the impact on the accuracy of the mass balance can be neglected. After all we have no clear explanation for the unusual temperature dependence of qs.
The temperature dependence was also measured for the less hydrophobic DAY 55. Here the isosteric heat of adsorption was somewhat greater, and the analysis of qs shows a significant enhancement of that value with increasing temperature. Again some hydrolysis of sucrose lower than 13% has to be included into the mass balance. Further experiments are necessary to confirm the unusual effect (Fig. 8).
 | ||
| Fig. 8 Dependence of the Henry constant K und the saturation adsorption qs on the temperature for the adsorption from water on DAY 55. | ||
4.7. Adsorption from water–ethanol mixtures
It is of fundamental interest if the sucrose is principally able to enter also the hydrophilic Y-zeolite. As is found that the sucrose is not adsorbed by the usual Y-zeolite from water, one should try the adsorption from alcohol–water mixtures. Similar experiments were reported by van Bekkum with monosaccharides.61 The weak interaction of fructose and glucose with X-zeolites was shown to be significantly enhanced when the carbohydrates were dissolved in mixtures of 3 parts of methanol with 1 part of water. When dissolving sucrose in water–ethanol solutions one has to consider the low solubility which is only 14 g L−1 in ethanol containing 10% v/v water.62 It is expected that the hydrophilic zeolite upon contact with the aqueous ethanol will preferentially adsorb water, and the concentration of a solute which is sterically hindered to enter the pores should have an increased concentration. So far all considerations in this article concerning the absolute isotherm have also been valid for ethanol–water mixtures. As shown in Fig. 9, sucrose is strongly adsorbed by the hydrophilic zeolite if 9 parts of volume ethanol is added to 1 part of the aqueous solution. Despite the fact that the solution is diluted with ethanol by a factor of 10, the adsorption is much stronger than pure water on the hydrophobic zeolite which is also shown for comparison in Fig. 9. As the micropore volume of the hydrophilic zeolite is greater than that of the dealuminated ones (0.35 instead of 0.32 cm3 g−1) the expected loading for one sucrose molecule per α-cage is now 207 g kg−1. That value is only slightly greater than the experimental one. The isotherm obeys the Langmuir type, and the extrapolated maximal loading is qs = (199 ± 3) g kg−1. | ||
| Fig. 9 Langmuir isotherms for sucrose adsorption from 90% v/v ethanol on a hydrophilic zeolite (Y2.8) and from water on a hydrophobic zeolite (DAY 130) at 20 °C. | ||
Fig. 10 shows the Henry constants for the adsorption on both the hydrophilic and the hydrophobic zeolite depending on the solvent composition. The experimental data can be modeled by an additive composition of hydrophobic and hydrophilic interactions due to:
| K = a1exp(b1φ) + a2exp(b2(1 − φ)) | (12) |
| K = a1exp(b1(1 − φ)) + a2exp(b2(1 − φ)) | (13) |
 | ||
| Fig. 10 Influence of ethanol on the adsorption of sucrose on hydrophobic and hydrophilic Y-zeolites at 20 °C. Modeling according to eqn (12) and (13). | ||
With respect to these results it is obvious that the sucrose in the dealuminated zeolite can be desorbed by treatment with an ethanol–water mixture, while sucrose on the hydrophilic zeolite can be released simply by addition of water. It has to be emphasized here that the adsorption is selective for sucrose, monosaccharides and most other disaccharides have a much lower affinity for the hydrophobic zeolite,11 and we expect that this should also be the case for the adsorption from alcohol–water on a hydrophilic zeolite.
4.8. Adsorption from liquids of the beet-sugar manufacturing process
It is clear that selective adsorption from sucrose can be of industrial interest for manifold applications ranging from the sugar technology to fermentation processes. We report here the desugarization of sugar-beet molasses. Molasses is a final product of the industrial sugar processing occurring after the crystallization and mostly used for cattle feed and fermentation processes,63 sometimes sugar and betaine are separated by industrial chromatography on K+ loaded ion-exchange resins.64,65Main constituents of the molasses (on dry substance) are sucrose (55.5%), chloride (5.2%), pyrrolidone carbonic acid (4.9%), betaine (4.6%), K+ (4.5%), lactic acid (1.3%), and Na+ (0.8%).66Fig. 11 shows the Langmuir adsorption isotherm which is in accordance with the adsorption from a buffered aqueous solution. The sucrose inside the zeolite was desorbed by bringing the centrifuged zeolite in contact with an aqueous solution of 33% ethanol. The concentration of sucrose in that solution is by a factor of 2.8 greater than that in the molasses. After distilling-off the ethanol, the sugar is enriched by a factor of 8.4 and the solution was shown to have a purity (quotient of sugar to dry matter) of more than 95%. Provided that the impurity is mainly given by the content of charged compounds,66 which should be excluded from the hydrophobic micropores, that result can be easily explained. Therefore the remaining impurity should be mainly influenced by the amount of adhering liquid inside the centrifuged zeolite. It is important to note here that the composition of the ethanol–water mixture is not yet optimized. As shown in Fig. 10, the use of water containing only 15–20% ethanol instead of 33% may be sufficient for the desorption process. A process optimization should also include the investigation of other co-solvents for desorption especially with respect to their recycling by re-distillation. The industrial application requires zeolite pellets instead of powder. Due to the greater size the kinetics is admittedly slower but the separation easier. Preliminary results concerning the kinetics and the isotherm are reported here. Because of the hierarchical pore structure of the pellet its effective diffusion coefficient for sucrose is significantly greater than that of the powder (1.8 × 10⁻¹¹ m2 s−1) but still lower than in concentrated bulk solution.66 Respective figures are shown in the appendix (ESI, Fig. A3 and A4†).
 | ||
| Fig. 11 Langmuir isotherms of sucrose adsorption from molasses on a hydrophobic zeolite (DAY 130) and its desorption with ethanol–water at 20 °C. | ||
Regarding the re-use of the zeolite after desorption, it is of interest if the desorption of sucrose is only a consequence of a changed polarity of the solvent or if ethanol must penetrate the micropores and replace the adsorbed sucrose. Indeed, ethanol is adsorbed from pure aqueous media on hydrophobic Y zeolites.67 Experiments concerning the composition of the micropore liquid after an optimized desorption are missing.
Beside the desugarization of molasses one can also consider an alternative route for sugar processing. Raw juice (90% sucrose per dry matter) is directly obtained after the aqueous extraction of the sugar beet and contains inter alia organic acids (25 mmol per 100 g sucrose), amino acids (11 mmol per 100 g sucrose), and betaine (9 mmol per 100 g sucrose).68 Subsequently colloidal particles are removed by juice purification (addition of lime and filtration); and the intermediate product called thin juice (92% sucrose per dry matter) is then evaporated to thick juice which is then crystallized.69 The crystallization of raw juice has been attempted but it seems to have no significant advantage compared to the traditional process.70 Also the selective separation of sucrose from raw juice by process chromatography has been proposed.71,72
Therefore, we present here preliminary results of the separation of sugar from raw juice and thin juice on hydrophobic Y-zeolites. Fig. 12 shows the adsorption of sucrose from raw juice, thin juice and molasses. In the case of raw juice also the adsorption of betaine and glutamine as important components beside sucrose is shown. Sucrose has a greater affinity.
 | ||
| Fig. 12 Langmuir isotherms of the adsorption of sucrose, betaine, and glutamine from different beet-sugar processing solutions on DAY 130 at 20 °C. | ||
5. Conclusion
Despite its molecular size being idealized as a sphere of 0.87 nm diameter, sucrose can enter the pores of Y-zeolites with an aperture of only 0.74 nm. At a temperature of only 5 °C the adsorption has reached the equilibrium with the zeolite crystals in about 5 min. Nevertheless, the diffusion is restricted by the confinement of the pores. The adsorption not only proceeds from water into a hydrophobic zeolite11 but, as shown for the first time, also from aqueous ethanol into a hydrophilic zeolite. Future work is necessary for understanding the pore entry by molecular simulation of water and sucrose inside the pores.The implementation of selective sucrose adsorption in sugar processing units in industrial sugar production or as an essential part of downstream processing in biotechnological transformations of sucrose requires further research.
References
- J. Dikmans, M. Dusselier, D. Gabriels, K. Houthoofd, P. C. M. M. Magusin, S. Huang, Y. Pontiks, M. Trekels, A. Vantomme, L. Giebeler, S. Oswald and B. F. Sels, ACS Catal., 2015, 5, 928–940 CrossRef.
- J. D. Sherman and C. Cao, Stud. Surf. Sci. Catal., 1986, 28, 1025–1032 CrossRef CAS.
- C. B. Ching, C. Ho, K. Hidajat and D. M. Ruthven, Chem. Eng. Sci., 1987, 42, 2547–2555 CrossRef CAS.
- C. Ho, C. B. Ching and D. M. Ruthven, Ind. Eng. Chem., 1987, 26, 1407–1412 CrossRef CAS.
- C. B. Ching and D. M. Ruthven, Zeolites, 1988, 8, 68–73 CrossRef CAS.
- Y. L. Cheng and T. Y. Lee, Biotechnol. Bioeng., 1992, 40, 498–504 CrossRef CAS PubMed.
- P. K. Muralidharan and C. B. Ching, Ind. Eng. Chem. Res., 1997, 36, 407–413 CrossRef CAS.
- R. C. Kuhn and F. M. Filho, J. Chromatogr., B, 2010, 878, 2023–2028 CrossRef CAS PubMed.
- R. Schöllner, W. D. Einicke and B. Gläser, J. Chem. Soc., Faraday Trans., 1993, 89, 1871–1879 RSC.
- M. Heper, L. Türker and N. S. Kincal, J. Colloid Interface Sci., 2007, 306, 11–25 CrossRef CAS PubMed.
- C. Buttersack, W. Wach and K. Buchholz, J. Phys. Chem., 1993, 97, 1181–11864 CrossRef.
- C. Buttersack, I. Fornefett, J. Mahrholz and K. Buchholz, Stud. Surf. Sci. Catal., 1997, 105, 1723–1730 CrossRef.
- S. Berensmeier and K. Buchholz, Sep. Purif. Technol., 2004, 38, 129–138 CrossRef CAS.
- I. Abe, K. Hayashi and M. Kitagawa, Carbon, 1983, 21, 189–191 CrossRef CAS.
- D. Chinn and C. J. King, Ind. Eng. Chem. Res., 1999, 38, 3738–3745 CrossRef CAS.
- P. Bai, J. I. Siepmann and M. Deen, AIChE J., 2013, 59, 3523–3529 CrossRef CAS.
- H. Beyer, Dealumination Techniques for zeolites, in Molecular Sieves, ed. H. G. Karge and J. Weitkamp, 2002, vol. 3, pp. 203–255 Search PubMed.
- M. J. Remy and G. Poncelet, J. Phys. Chem., 1995, 99, 773–779 CrossRef CAS.
- L. A. Terry, S. F. White and L. J. Tigwell, Agric. Food Chem., 2005, 53, 1309–1316 CrossRef CAS PubMed.
- V. H. Tran and J. W. Brady, Biopolymers, 1990, 29, 961–976 CrossRef CAS PubMed.
- V. H. Tran and J. W. Brady, Biopolymers, 1990, 29, 977–997 CrossRef CAS PubMed.
- C. Buttersack, J. Hofmann and R. Gläser, unpublished results.
- J. Kärger and D. M. Ruthven, Diffusion in zeolites, John Wiley & Sons, 1992, p. 234 Search PubMed.
- C. B. Ching and D. M. Ruthven, Zeolites, 1988, 8, 68–73 CrossRef CAS.
- C. B. Ching and D. M. Ruthven, Chem. Eng. J., 1989, 40, B1–B5 CrossRef CAS.
- T. Mäurer and B. Kraushaar-Czarnetzki, Helv. Chim. Acta, 2001, 84, 2550–2556 CrossRef.
- D. Girlich, H. D. Lüdemann, C. Buttersack and K. Buchholz, Z. Naturforsch., C: Biosci., 1994, 49, 258–264 CAS.
- B. McEnaney, Carbon, 1988, 26, 267–274 CrossRef CAS.
- J. C. Palmer and K. E. Gubbins, Microporous Mesoporous Mater., 2012, 154, 24–37 CrossRef CAS.
- C. Buttersack, H. Rudolph, J. Mahrholz and K. Buchholz, Langmuir, 1996, 12, 3101–3106 CrossRef CAS.
- L. Moscou and M. Lakeman, J. Catal., 1970, 16, 173–180 CrossRef CAS.
- F. B. Sherman, V. A. Klimova, Y. S. Khodakov, V. S. Nakhshunov, I. P. Yakovlev and K. M. Minachev, Bull. Acad. Sci. USSR Div. Chem. Sci., 1972, 21, 725–730 CrossRef.
- O. Solcova, L. Matejova, P. Topka, Z. Musilova and P. Schneider, J. Porous Mater., 2011, 18, 557–565 CrossRef CAS.
- M. Thommes, R. Köhn and M. Fröba, J. Phys. Chem. B, 2000, 104, 7932–7943 CrossRef CAS.
- E. Maglara, A. Pullen, D. Sullivan and W. C. Conner, Langmuir, 1994, 10, 4167–4173 CrossRef CAS.
- Handbook of Mineralogy, Mineral. Soc. Amer., Chapter: Faujasite, ed. J. W. Anthony, R. A. Bideaux, K. W. Bladh and M. C. Nichols, 2015, http://www.handbookofmineralogy.org/ Search PubMed.
- B. Mette, H. Kerskes, H. Drück and H. Müller-Steinhagen, Int. J. Heat Mass Transfer, 2014, 71, 553–561 CrossRef.
- A. Wozniak, B. Marler, K. Angermund and H. Gies, Chem. Mater., 2008, 20, 5968–5976 CrossRef CAS.
- I. A. Beta, H. Böhlig and B. Hunger, Phys. Chem. Chem. Phys., 2004, 6, 1974–1981 RSC.
- J. Plevert, F. di Renzo, F. Fajula and G. Chiari, J. Phys. Chem. B, 1997, 101, 10340–10346 CrossRef CAS.
- A. di Lella, N. Desbiens, A. Boutin, I. Demachy, P. Ungerer, J. P. Bellat and A. H. Fuchs, Phys. Chem. Chem. Phys., 2006, 8, 5396–5406 RSC.
- M. Fleys and R. W. Thompson, J. Chem. Theory Comput., 2005, 1, 453–458 CrossRef CAS PubMed.
- reference 20, p. 230.
- M. B. Kim, Y. K. Riu and C. H. Lee, J. Chem. Eng. Data, 2005, 50, 951–955 CrossRef CAS.
- T. Kawai and K. Tsutsumi, Colloid Polym Sci., 1992, 270, 711–716 CAS.
- A. Giaya, R. W. Thompson and R. Denkewicz, Microporous Mesoporous Mater., 2000, 40, 205–218 CrossRef CAS.
- B. Gläser, W. D. Einicke and R. Schöllner, Chem. Technol., 1995, 47, 143–148 Search PubMed.
- W.-D. Einicke, B. Glaeser and R. Lippert, J. Chem. Soc., Faraday Trans., 1995, 91, 971–974 RSC.
- F. A. Farhadpour and A. Bono, J. Colloid Interface Sci., 1988, 124, 209–227 CrossRef CAS.
- S. Immel and F. W. Lichtenthaler, Liebigs Ann., 1995, 1925–1937 CrossRef CAS.
- P. J. Bernal and W. A. van Hook, J. Chem. Thermodyn., 1986, 18, 955–968 CrossRef CAS.
- M. V. Kaulgud and S. S. Dhondge, Indian J. Chem., 1988, 27A, 6–11 CAS.
- K. Kiyosawa, Bull. Chem. Soc. Jpn., 1988, 61, 633–642 CrossRef CAS.
- M. Eszterle, Zuckerind, 1993, 118, 459–464 CAS.
- S. A. Wells, K. M. Ling, P. P. Edwards and A. Sartbaeva, Dalton Trans., 2015, 44, 5978–5984 RSC.
- E. N. Coker, D. P. Roelofsen, R. M. Barrer, J. C. Jansen and H. van Bekkum, Microporous Mesoporous Mater., 1998, 22, 261–268 CrossRef CAS.
- P. Vratny, J. Coupek, S. Vozka and Z. Hostomska, J. Chromatogr., 1983, 254, 143–155 CrossRef CAS.
- D. D. Do, Adsorption Analysis: Equilibria and kinetics, Imperial College Press, London, 1998, p. 18 Search PubMed.
- I. Fornefett, C. Buttersack and K. Buchholz, unpublished results.
- C. Buttersack and D. Laketic, J. Mol. Catal., 1994, 94, L283–L290 CrossRef.
- T. M. Wortel and H. van Bekkum, Recl. Trav. Chim. Pays-Bas, 1978, 97, 156–158 CrossRef CAS.
- A. M. Peres and E. A. Macedo, Carbohydr. Res., 1997, 303, 135–151 CrossRef CAS.
- J. Higginbotham and J. McCarty, Quality and storage of molasses, in Sugar Technology, ed. P. W. van der Poel, H. Schiweck and T. Schwartz, Bartens, Berlin, 1998, p. 973 Search PubMed.
- B. Ehrenhube, Zuckerind, 2005, 130, 463–469 Search PubMed.
- D. E. Rearick, C. McKay and A. Bagramyan, Zuckerind, 2011, 136, 660–662 Search PubMed.
- M. Rampp, C. Buttersack and H. D. Lüdemann, Ind. Eng. Chem. Res., 2000, 39, 4400–4407 CrossRef CAS.
- I. M. Dahl, E. Myhrvold, Å. Slagtern and M. Stöcker, Adsorpt. Sci. Technol., 1997, 15, 289–300 CAS.
- Sugar Technology, ed. P. W. van der Poel, H. Schiweck and T. Schwartz, Bartens, Berlin, 1998, p. 130 (Table 2/7), p 143 (Table 2/14), p. 147 Search PubMed.
- H. Schiweck, M. Clarke and G. Pollach, Sugar, in Ullmann's Encyc. Ind. Chem, VCH, 2007 Search PubMed.
- G. Vaccari, G. Sgualdino, E. Tamburini, G. Pezzi, P. Citterio and P. Verado, Zuckerind, 2003, 128, 821–828 CAS.
- P. Bussmann, R. Vroon, J. Timmer, F. Boon and J. M. de Bruijn, Zuckerind, 2007, 132, 634–637 CAS.
- M. Kearney and D. E. Rearick, Int. Sugar J., 1996, 98, 144–148 Search PubMed.
Footnotes |
| † Electronic supplementary information (ESI) available. See DOI: 10.1039/c5gc02832a |
| ‡ Present address: Continental AG, 3000 Hannover, Germany, E-mail: iris.fornefett@conti.de. |
| § Present address: Institute for Non-classical Chemistry at the University of Leipzig, Permoser Str. 15, 04318 Leipzig, Germany, E-mail: buttersack@inc.uni-leipzig.de. |
| ¶ Present address: Institute for Technical Chemistry of the Technical University of Braunschweig, Hans-Sommer-Str. 10, 38106 Braunschweig, Germany, E-mail: k.buchholz@tu-bs.de. |
| This journal is © The Royal Society of Chemistry 2016 |