
 Open Access Article
 This Open Access Article is licensed under a Creative Commons Attribution-Non Commercial 3.0 Unported Licence
Meso- and microporous soft templated hydrothermal carbons for dye removal from water†
Sara-Maaria
Alatalo
*a,
Ermei
Mäkilä
b,
Eveliina
Repo
a,
Markku
Heinonen
c,
Jarno
Salonen
b,
Edwin
Kukk
c,
Mika
Sillanpää
a and
Maria-Magdalena
Titirici
*d
aLaboratory of Green Chemistry, School of Engineering Science, Lappeenranta University of Technology, Sammonkatu 12, FI-50130 Mikkeli, Finland. E-mail: sara-maaria.alatalo@lut.fi
bLaboratory of Industrial Physics, Department of Physics and Astronomy, University of Turku, FI-20014 Turku, Finland
cMaterials Research Laboratory, Department of Physics and Astronomy, University of Turku, FI-20014 Turku, Finland
dSchool of Materials Science and Engineering, Queen Mary University of London, Mile End Road, E1 4NS, London, UK. E-mail: m.m.titirici@qmul.ac.uk
First published on 5th October 2015
Abstract
The hydrothermal carbonization (HTC) technique has shown a great ability in the synthesis of carbon materials with special properties for a wide range of different applications. Here, a hypersaline salt mixture (LiCl–ZnCl2) combined with hydrothermal carbonization was applied in order to obtain sulfur containing micro- and mesoporous (0.3–40 nm) monolithic carbons with high surface areas (400–550 m2 g−1) and well developed porosity (0.4–1.2 cm3 g−1). Fructose was used as a carbon source and sulfur was introduced in an aromatic configuration as 2-thiophenecarboxaldehyde. The resulting carbon materials showed a promising removal capacity (qe = 0.3 mmol g−1) towards methylene blue and the adsorption followed the Sips isotherm independent of the pH. Intraparticle diffusion appeared to control the adsorption kinetics. Carbon materials could be easily regenerated with simple ethanol washing. The dye pollutant could be completely desorbed from the adsorbent's surface, while the adsorbent still maintained removal efficiency of above 90% during three cycles.
1. Introduction
Porous carbon materials are still among the best material choices compared to other classes of porous materials such as zeolites, porous silica, and MOFs. This is due to their diverse properties, extraordinary chemical, mechanical and thermal stability, and the tunable electrical properties for a wide range of applications: catalysis, adsorption, batteries, supercapacitors, and fuel cells.1–3 In recent years, hydrothermal carbonization (HTC) has confirmed its place, as a gentle alternative technique, among the other more classical carbonization techniques. In brief, HTC takes place at low temperatures under autogeneous pressures in aqueous media.4–6 The reaction mechanism includes several simultaneous and consecutive reactions resulting in an amorphous polyfuranic carbon network.7 Hydrothermal carbons tend to possess a limited porosity, which however, can be improved via various methodologies, such as soft-8 and hard9 templating techniques. These techniques include some drawbacks i.e. introduction of hazardous chemicals for the removal of hard templates, restriction to low temperature treatment or requirement for an additional post-activation step.1 In the context of sustainability, green chemistry and industrial scale-up utilization of low-cost, benign and recyclable templates in the production of porous monolithic materials with polar surface functionalities would be beneficial.10ZnCl2 based salt mixtures (e.g. NaCl, KCl and LiCl) have been found to regulate the formation of pore diameters and stabilize the surface of the forming primary particles and at the same time prevent Ostwald ripering.11,12 Additionally, the salt mixture acts as a molecular template, either forming ion pairs or little salt clusters.13,14 These type of binary salt systems are known as low melting eutectics.15,16 The introduction of these very hydrophilic ions in to the reaction media lowers the partial pressure of water and changes its structure so that reactions can be performed under hypersaline but otherwise less extreme conditions.17,18 Due to the environmentally friendly and green sustainable approach, salt mixture could be removed from the carbon matrix simply by washing with water whereas carbon matrix would not be affected, opposite to other techniques.19 Further on salt mixture could be removed from the water and reused. Additionally, the resulting carbon materials can be dried via ordinary drying techniques without the danger of collapsing the porous network due to capillary forces.
With the growth of standard of living, environmental pollution has increased significantly. Heavy metals and organic dyes are complicated pollutants in waste waters due to their non-biodegradability and toxicity to plants, animals and humans.20 The greatest environmental concern with dyes is their absorption and reflection of sunlight entering the water, which interferes with the growth of bacteria, limiting it to levels insufficient to biologically degrade impurities in the water. Dyes in waste water can cause acute and/or chronic effects on exposed organisms depending on the exposure time and dye concentration. Additionally, dyes are visible already at very low concentrations (∼0.005 ppm).21,22 Many dyes are also toxic having carcinogenic and mutagenic effects on humans. Various techniques are available for dye containing wastewater treatment, but conventionally no single process is capable of sufficient treatment and most likely a combination of different techniques is required.23 The removal of dyestuff requires a combination of biological and physical processes and often this is not enough to remove dyes completely. In this context, adsorption would be a potential alternative.24 Adsorption mechanism of organic compounds such as methylene blue are considered to happen mainly via electrostatic interactions and π–π dispersion interaction.20,25–27 Various organic and inorganic adsorbents including modified graphite powder and the emerging carbon graphitic nanostructures have been tested for the removal of organic dyes from waste waters. Some of them have indicated a rather good dye removal efficiency, however low-cost, easily obtainable and regenerable adsorbents are still rare especially for field applications.28–31
Herein we have synthesized meso-/microporous carbon materials via hydrothermal carbonization and exploiting salt templating technique. Two different classes of materials have been produced. One from pure fructose containing polar oxygenated functionalities on the surface and another from fructose and 2-thiophenecarboxyaldehyde (TCA) resulting thiophenic sulfur doped within the final carbon network. The development of porosity and the formation of the carbon network was controlled by the presence of LiCl–ZnCl2 salt-mixture. The as synthesized carbon monoliths, with abundant and versatile surface functionality together with well-developed porosity were tested for the removal of methylene blue from aqueous media.
2. Results and discussion
2.1. Synthesis and characterization
The monosaccharide fructose was used as a carbon source for the production of carbon materials in the presence of a LiCl–ZnCl2 salt mixture via HTC at 180 °C in a closed batch reactor, resulting in a monolithic carbon structure shown in Fig. 1. The carbon monoliths were dark brown in color and structurally rigid. Scanning electron (SEM) (Fig. 1b and S1a†) and transmission electron microscopy studies (TEM) (Fig. 1c, d and S1b†) showed spherically shaped carbon aggregates in which the diameters of individual particles were determined about ∼20 nm attached together forming a continuous amorphous carbon network.4 N2 sorption data was in good agreement with SEM and TEM image analysis, indicating high surface area and pore volume for the produced carbon materials (Table 1, Fig. 2 and S2†). FruLi and FruLi + TCA carbons indicated type IV/H2 and IV/H3 N2 adsorption isotherms with hysteresis loops indicative to mesoporous structure respectively, which is in a good agreement with the SEM images formed by agglomerated carbon nanoparticles of various sizes.32 The presence of mesopores is further supported by the pore size distribution obtained from N2 adsorption experiments (Fig. S2a and c†). Pore size distributions (PSD) were plotted using the non-local density functional theory (NLDFT) and assuming slit-shaped pores. The PSD appeared to concentrate on the lower mesoporous range in which pore sizes of FruLi were mainly less than 10 nm whereas FruLi + TCA indicated broader PSD ranging from 1–40 nm. The steep curve at the beginning of the N2 adsorption isotherm (P/P0 0.002–0.3) indicated the presence of microporosity in the network structure, which was confirmed with CO2 sorption analysis at 0 °C (Table 1, Fig. 2b, d and S2b, d†). Micropores at widths of 0.3–0.8 nm were found in both types of carbon materials with similar Vtotal values. This is in good agreement with the TEM micrographs. Well pronounced microporosity is unusual to hydrothermal carbons, which clearly indicates the imprinting of ZnCl2–LiCl salt mixture in the particles via an activation effect, similar to chemical activation.11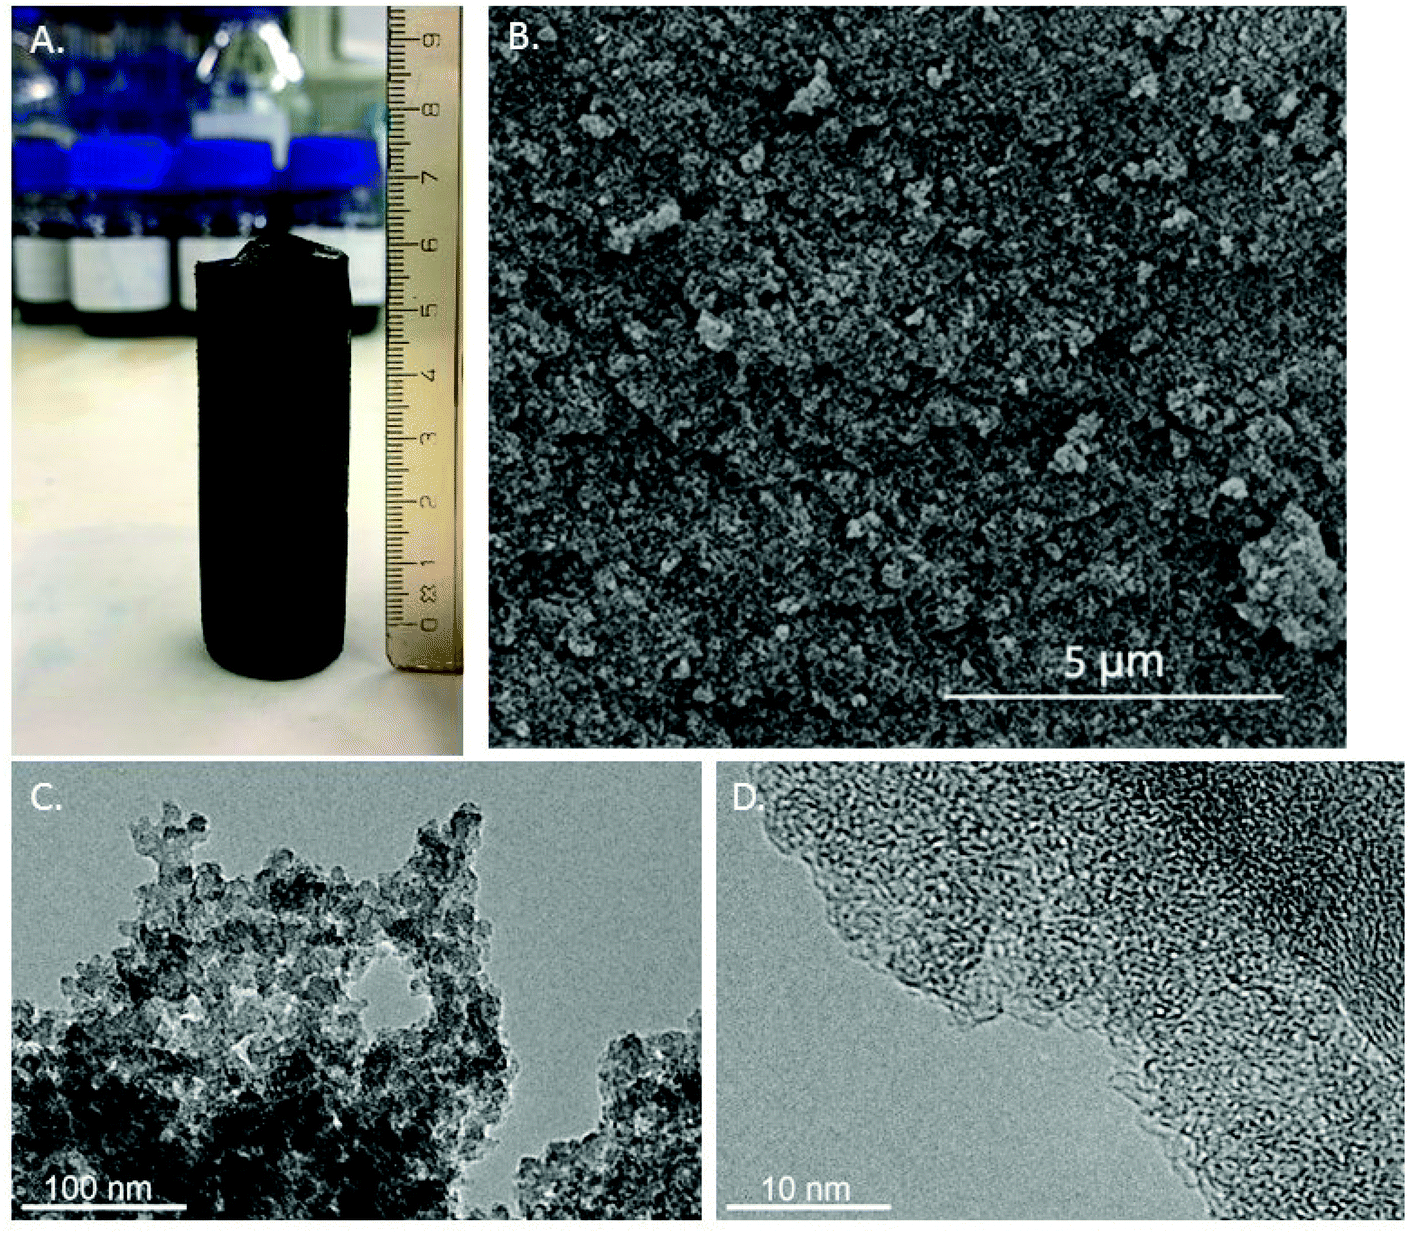 | ||
| Fig. 1 A. Monolithic carbon structure (fructose based, FruLi) after synthesis, B. SEM image 20k magnification, C. and D. TEM images with 60k and 600k magnifications respectively. | ||
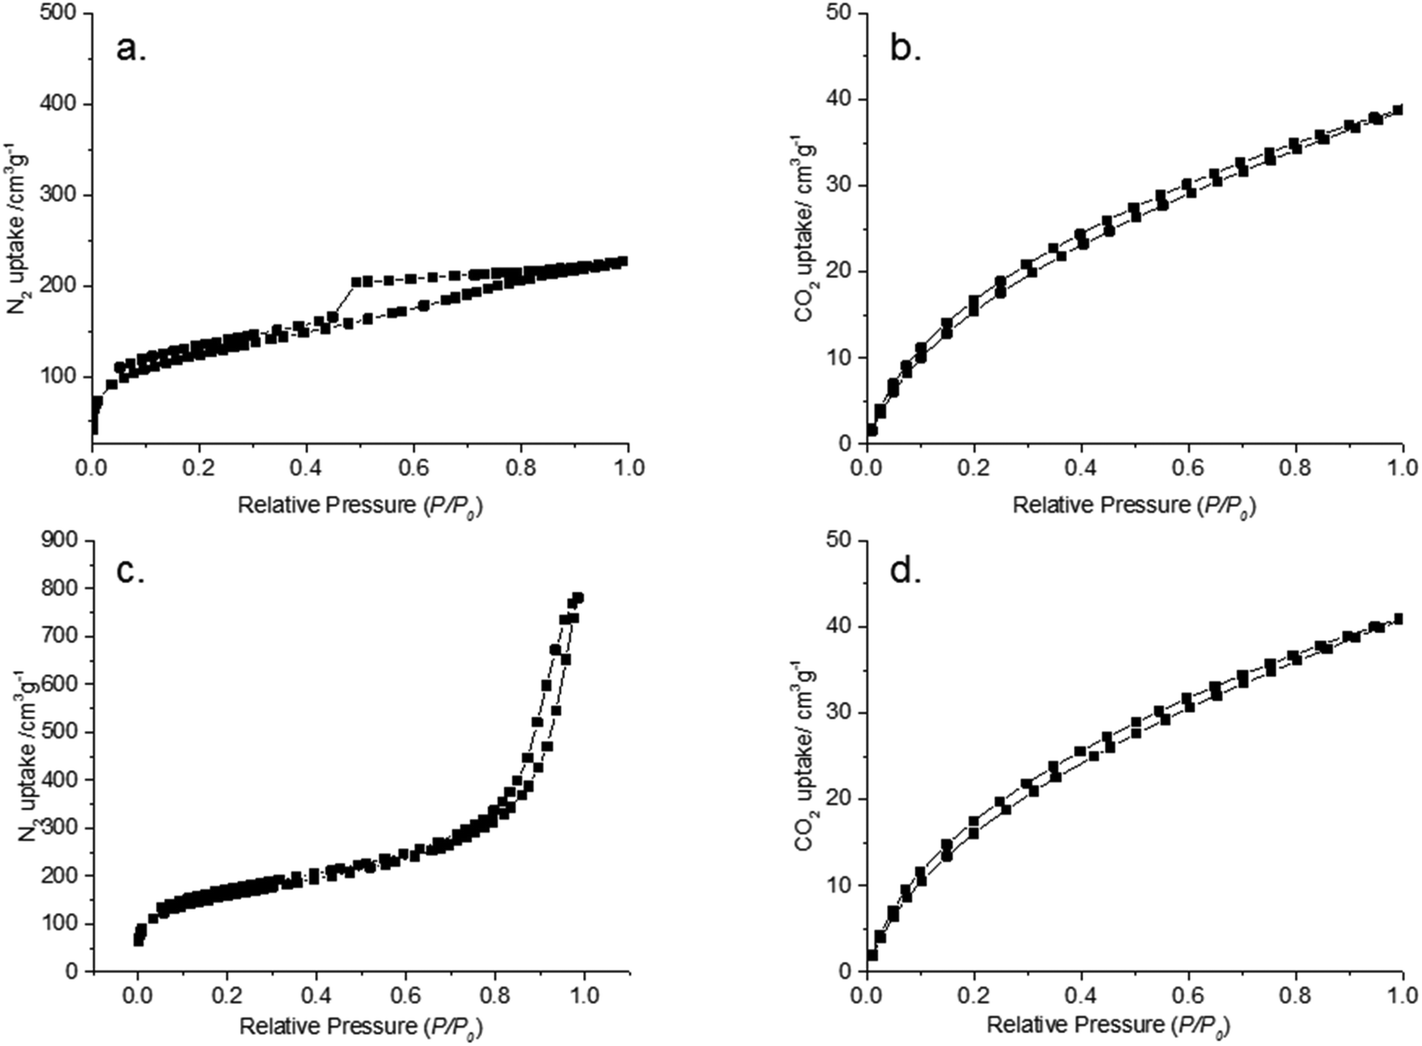 | ||
| Fig. 2 Fruli A. N2 adsorption–desorption isotherm, B. CO2 adsorption–desorption isotherm analyzed at 0 °C. Fruli + TCA C. N2 adsorption–desorption isotherm and D. CO2 sorption isotherm analyzed at 0 °C. | ||
| Material | Ha [%] | Ca [%] | Sa [%] | Oa [%] |
S
N2![[thin space (1/6-em)]](https://www.rsc.org/images/entities/char_2009.gif) b (m2 g−1) b (m2 g−1) |
V
N2c (cm3 g−1) |
S
CO2d (m2 g−1) |
V
CO2d (cm3 g−1) |
Total acidity (mmol g−1) |
|---|---|---|---|---|---|---|---|---|---|
| a Weight percent. b Surface area calculated by BET. c Total pore volume at P/P0 = 0.97. d Surface area and pore volume calculated by NLDFT from CO2 adsorption data at 0 °C. | |||||||||
| Fruli | 4.7 | 70.2 | 25.1 | 431 | 0.4 | 415 | 0.14 | 0.87 | |
| Fruli + TCA | 4.3 | 66.6 | 7.2 | 21.9 | 554 | 1.2 | 441 | 0.15 | 0.77 |
The introduction of heteroatoms has been shown to improve the performance of carbon materials in many applications. Sulfur doped carbons have received an increased attention due to their potential in the field of adsorption for e.g. metal removal and desulfurylation of crude oil. Elemental compositions of carbon materials are summarized in Table 1. S-doping resulted in 7.2 wt% of total sulphur content. FTIR, XPS and NMR analysis demonstrate the structural composition of produced carbon monoliths. FTIR analysis of FruLi and FruLi + TCA (Fig. 3) presented typical structural properties for hydrothermal carbons such as the vibration bands related to aromatic features at wavenumbers of 1615–1450 cm−1 and carbonyl/carboxylic (C![[double bond, length as m-dash]](https://www.rsc.org/images/entities/char_e001.gif) O) functionalities at 1850–1650 cm−1. The band at wavenumber ∼1396 cm−1 relate to carboxylate groups in the materials (C–O). The bands at 3000–2800 cm−1 can be assigned to aliphatic carbon (C–H) stretching vibrations.5 Similar structural features compared to FruLi were also observed in FruLi + TCA. However, the weak band found at ∼696 cm−1 indicates C–S stretching of thiophene ring.33,34 Observed structural features of FruLi and Fruli + TCA are align with FTIR studies of hydrochars.4 Further investigation of atomic binding states was conducted by XPS (Fig. 4). High resolution C(1s) analysis indicated four chemical states for FruLi at 285 eV (CC/C–C/C–H 81.2% area), 286.4 eV (C–O; 11.4% area), 288.1 eV (CO; 5.6% area) and 289.9 eV (O–CO; 1.8% area). The C(1s) spectra of Fruli + TCA resulted in four distinct binding energies 285 eV (CC/C–C/C–H, 80.9% area), 286.4 eV (C–O/C–S; 11.3% area), 288.1 eV (CO; 3.7% area) and 289.9 eV (O–CO; 2.2% area) indicating similar structural features as FruLi.35,36 Due to the close binding energies between different bonding types (e.g. C–S and C–O) presence of thiophene type of sulphur in the carbon network was confirmed by S(2p) spectra of the Fruli + TCA.37 The doublet peak at ∼163.9–165 eV corresponds to neutral, thiophene type sulfur, while no oxidized sulfur was detected (165.3–168.6 eV).34
O) functionalities at 1850–1650 cm−1. The band at wavenumber ∼1396 cm−1 relate to carboxylate groups in the materials (C–O). The bands at 3000–2800 cm−1 can be assigned to aliphatic carbon (C–H) stretching vibrations.5 Similar structural features compared to FruLi were also observed in FruLi + TCA. However, the weak band found at ∼696 cm−1 indicates C–S stretching of thiophene ring.33,34 Observed structural features of FruLi and Fruli + TCA are align with FTIR studies of hydrochars.4 Further investigation of atomic binding states was conducted by XPS (Fig. 4). High resolution C(1s) analysis indicated four chemical states for FruLi at 285 eV (CC/C–C/C–H 81.2% area), 286.4 eV (C–O; 11.4% area), 288.1 eV (CO; 5.6% area) and 289.9 eV (O–CO; 1.8% area). The C(1s) spectra of Fruli + TCA resulted in four distinct binding energies 285 eV (CC/C–C/C–H, 80.9% area), 286.4 eV (C–O/C–S; 11.3% area), 288.1 eV (CO; 3.7% area) and 289.9 eV (O–CO; 2.2% area) indicating similar structural features as FruLi.35,36 Due to the close binding energies between different bonding types (e.g. C–S and C–O) presence of thiophene type of sulphur in the carbon network was confirmed by S(2p) spectra of the Fruli + TCA.37 The doublet peak at ∼163.9–165 eV corresponds to neutral, thiophene type sulfur, while no oxidized sulfur was detected (165.3–168.6 eV).34
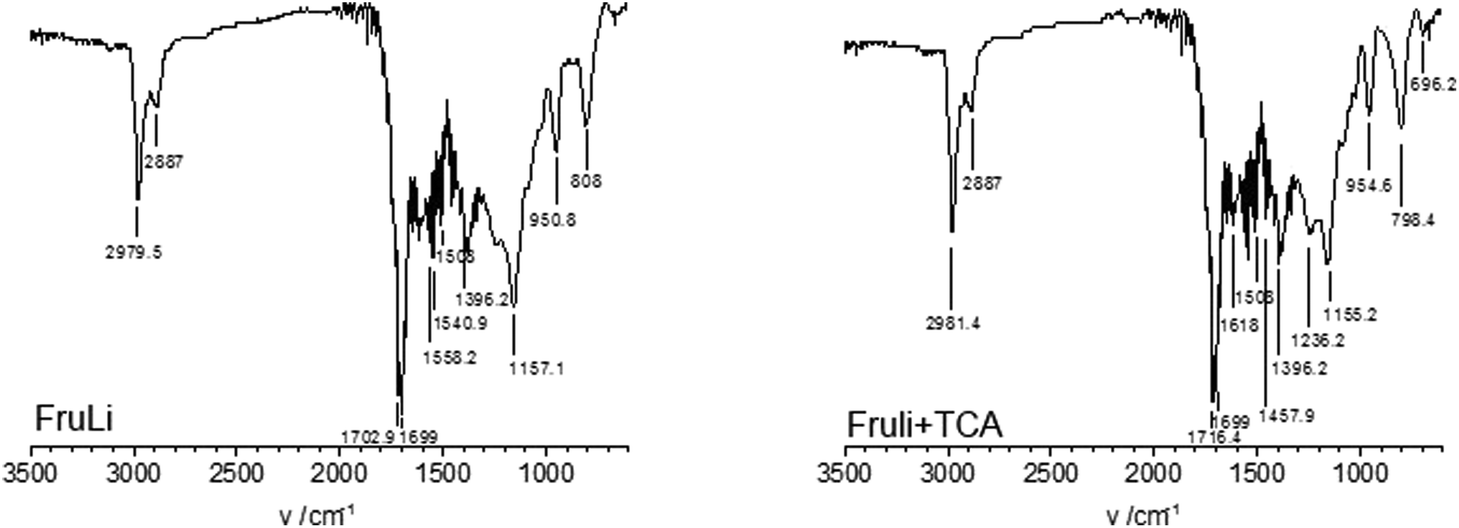 | ||
| Fig. 3 FTIR spectras of FruLi and Fruli + TCA. | ||
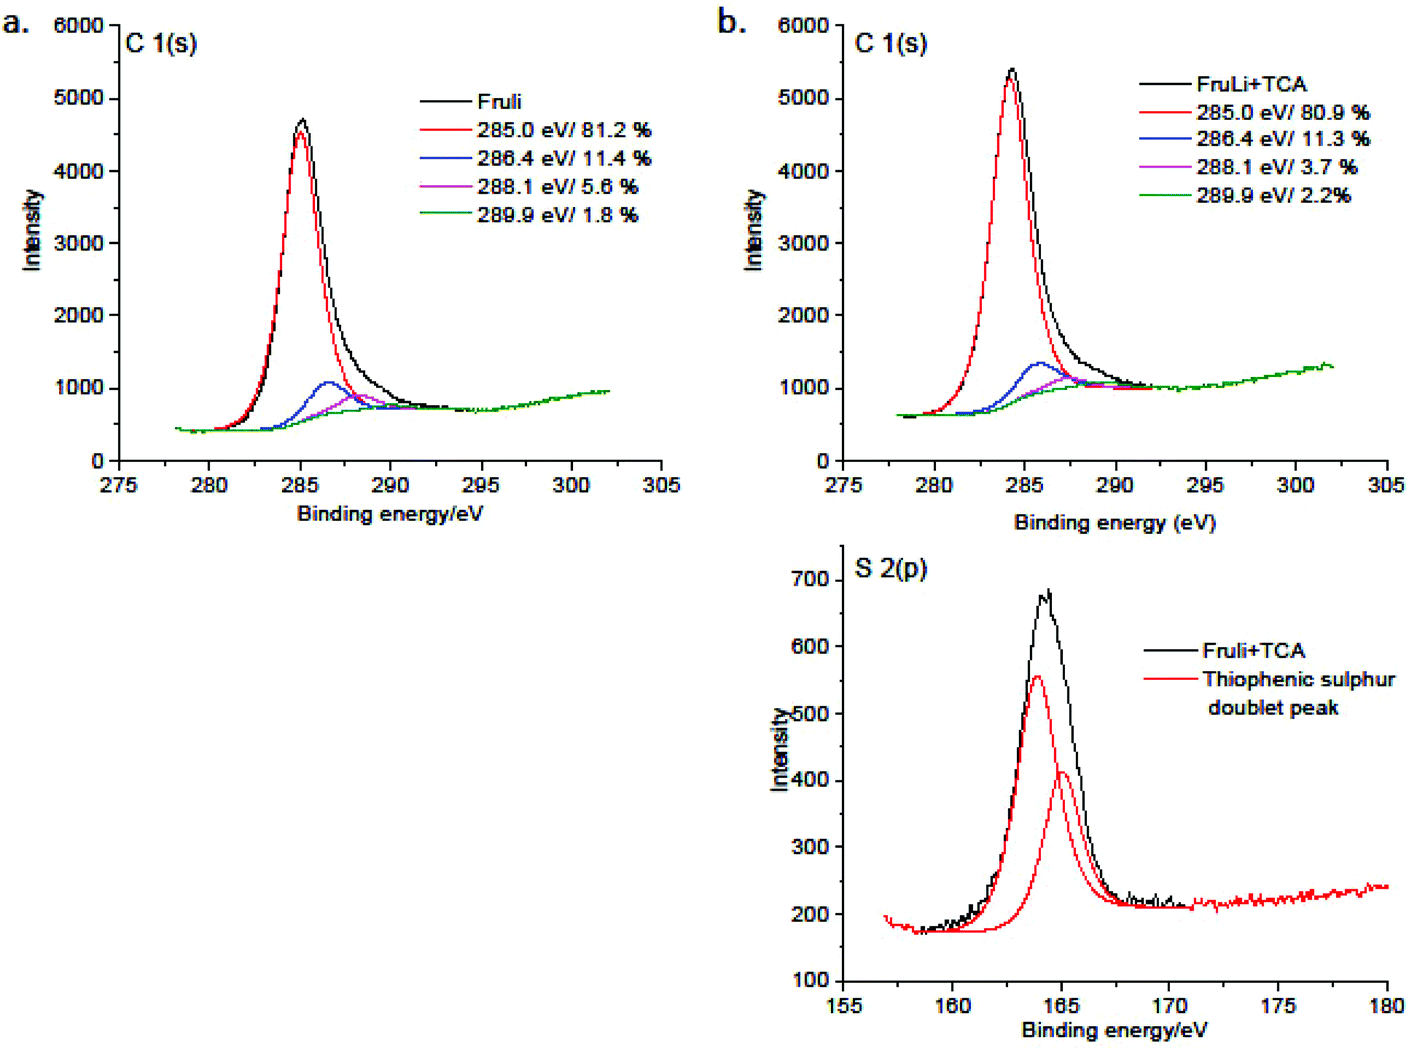 | ||
| Fig. 4 XPS C 1(s) deconvolution spectra of A. FruLi and B. Fruli + TCA C 1(s) and S 2(p) deconvolution spectras. | ||
For deeper understanding of the chemical environment, solid-state 13C CP NMR was conducted (Fig. 5). The ss-NMR spectrum indicates resonances in the δ = 0–70 ppm region representative for aliphatic sp3 hybridized carbon, whilst resonances at δ = 90–160 ppm are characteristic to sp2 carbon structures. FruLi showed three distinct peaks in this area where δ = 110.7 ppm and δ = 149.5 ppm refer to furan type structures and the peak at δ = 125.2 ppm is characteristic to sp2 aromatic bound carbon.38 Further on, the bands at δ = 172.6 ppm and 204.2 ppm refer to carboxylate groups and ketone/aldehyde functionalities, respectively. FruLi + TCA showed similar structural properties to FruLi. However, a slight variation in the relative peak intensities between different structural groups was observed. The intensity of the peak related to sp3 carbons was found weaker, whilst the peak related to the aromatic structure at δ = 124.8 ppm proved more intense in FruLi + TCA compared to FruLi. Additionally, the peak at 207.5 ppm referring to ketone/aldehyde functionalities was weaker than in FruLi. The contribution of thiophene ring in sulfur doped carbon structure (Fruli + TCA) can be seen as a weak shoulder at ∼154.7 ppm.39
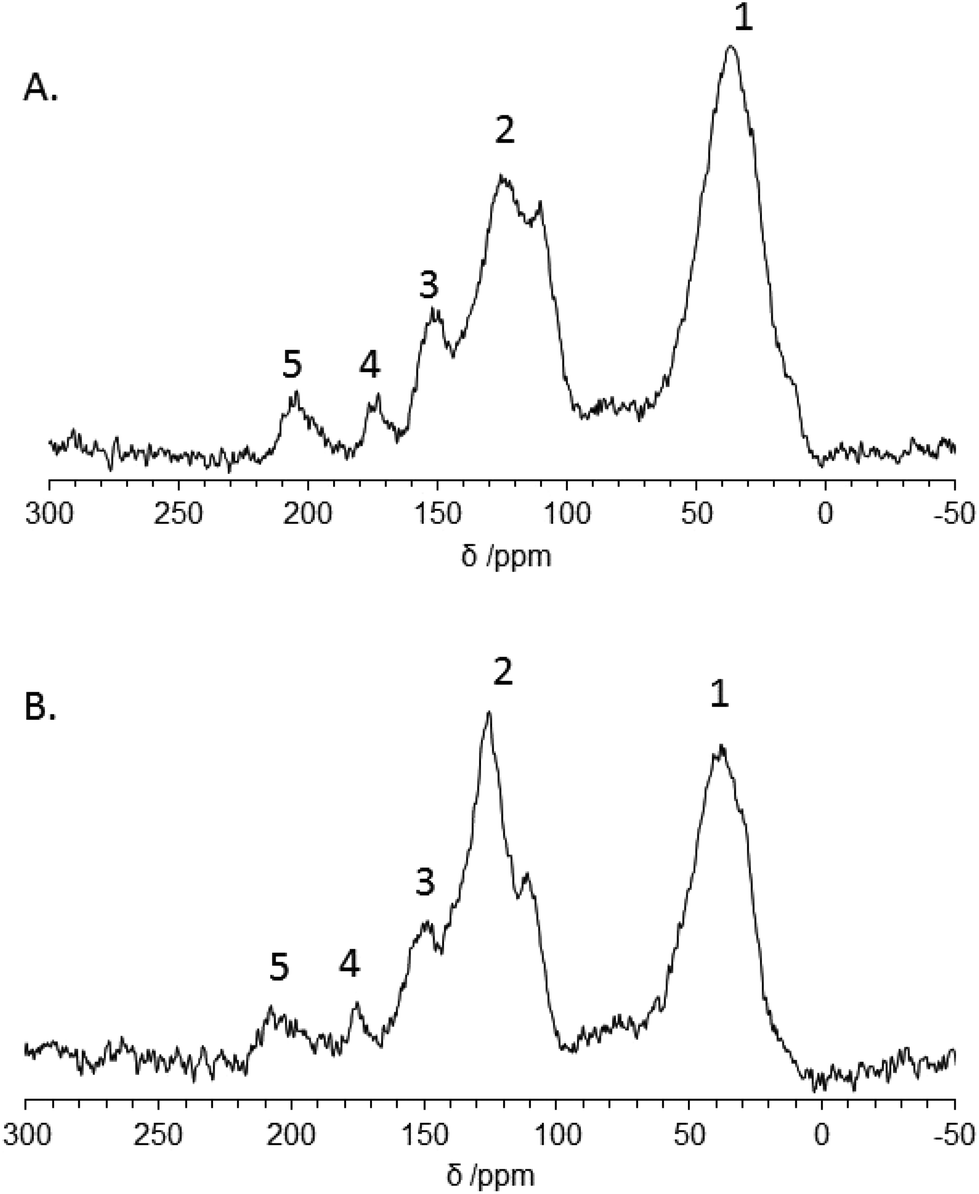 | ||
| Fig. 5 13C CP MAS NMR spectras of A. FruLi and B. Fruli + TCA in which 1. Aliphatic sp3 carbon, 2. sp2 carbon related structures, 3. Furan type structure, 4. Carboxylate and 5. Ketone/aldehyde. | ||
The change in the surface charge of the carbon materials was studied by determining the pHIEP. The experiments were conducted as a function of pH, determining the changes in zeta potential (Fig. 6). The fructose based carbon materials were found to have negative surface zeta potentials over the studied pH range (1–8). The presence of thiophenic sulfur did not have a clear effect on the zeta potential of the carbon material, which may be related to electronegativity of sulfur (2.58 Pauling scale) being very close to electronegativity of carbon (2.55 Pauling scale).40 The amount of acidic surface functional groups caused by the oxygen functional groups were determined with a simple back titration method. The results are shown in Table 1. Both carbon materials indicated a strong acidity. However, the sulfur doped carbon material (FruLi + TCA) indicated a slightly lower total acidity (mmol g−1) value compared to FruLi. This is in a good agreement with XPS studies suggesting a lower abundance of the oxidized surface functional groups.
 | ||
| Fig. 6 Development of the surface charge of Fruli and Fruli + TCA as a function of pH. | ||
2.2. Adsorption
In adsorption applications related to water purification, activated carbon is traditionally used for the removal of pollutants from aqueous media. Its advantages are well developed textural properties (high internal surface area and porosity as well as surface chemical properties).41 However, the production of activated carbon includes rather harsh and multistep preparation procedures and low yields. Additionally it has very high initial and regeneration costs. In this study, carbon materials with well-developed surface area, pore volume, and abundant surface functionality produced via one-pot hydrothermal carbonization technique were tested for the removal of methylene blue. Methylene blue is a basic polyaromatic dye with positively charged nitrogen and sulfur atom in its structure. Positive charge is delocalized through chromophoric system.42 Structure of the methylene blue and molecule dimensions has been presented in the Table 2.43| Methylene Blue/Basic Blue 9 | ||||
|---|---|---|---|---|
| Synthetic sewage | C [mg l−1] | M w [g mol−1] | pKa | Dimensions [nm] |
| Peptone | 160 | 373.9 | 0.61 | 1.43 × 0.61 × 0.4 |
| Meat extract | 110 |
|
||
| Urea | 30 | |||
| K2HPO4 | 28 | |||
| MgSO4·2H2O | 2 | |||
| CaCl2·2H2O | 4 | |||
| Nacl | 7 | |||
| TOC | 111 | |||
| COD | 312 | |||
| pH | 7.3 | |||
Typically, the role of pH is considered crucial in the adsorption process. Carbon materials have an amphoteric character and therefore the charge on the surface may change depending on the solution pH. This has a considerable effect on the pollutant removal efficiency of the adsorbent in general.44 This is crucial when electrostatic interactions are main attractive forces between the adsorbent and the adsorbate.23 The initial solution pH was observed to have a minor effect on the adsorption efficiency of Methylene blue for both carbon materials FruLi and Fruli + TCA (S3†) over the tested pH range (3–8). Adsorption irrespective of solution pH refers to dispersive interactions between delocalized π electrons in the carbon materials and free electrons in dye molecules responsible for the adsorption mechanism.44 Similar observations have been reported for charcoal and mesoporous silica templated sucrose adsorbents for example.41,45
The experiments related to the effect of temperature on Methylene blue adsorption were conducted at 20, 40 and 60 °C degrees (S4†). The adsorption efficiency increased slightly when temperature increased from 20 to 40 °C. However, the change in the adsorption efficiency of the studied carbon materials was insignificant. Presumably, increased adsorption efficiency at higher temperatures may be due to decreased solution viscosity leading to an enhanced diffusion rate of adsorptive molecules across the external boundary layer and in the internal pores.46 From an environmental and practical point of view, adsorption at ambient temperature and near neutral pH are highly beneficial in the field of water purification.
The experimental adsorption equilibrium tests were conducted at pH 6 at 20 °C with 24 h contact time. Experimentally determined maximum adsorption capacity of Methylene blue qe,exp was determined 0.3 mmol g−1 for Fruli and 0.2 mmol g−1 for Fruli + TCA (Table 3, Fig. 7a and S5a†). A successful representation of the dynamic adsorptive separation of solute from a solution onto an adsorbent is dependent upon a good description of the equilibrium separation between two phases. An equilibrium state is reached when the amount of adsorbate being adsorbed onto the adsorbent is equal to amount being desorbed. Sips adsorption isotherm is applicable for heterogeneous surfaces, and therefore applied in this study. Sips is a combination of Langmuir and Freundlich adsorption isotherms. At high concentrations, the Sips isotherm approaches a constant value, and, at low concentrations a Freundlich type equation.47 The experimental adsorption maximum capacities qe,exp, (obtained for both adsorbent types) fit well with the theoretically predicted qe values which can be seen as a rather good correlation coefficients and standard deviations in the case of both carbon materials (e.g. Fruli r2 = 0.962 and STDEV = 0.11) as well. The heterogeneous factors (nS) differed from unity, as an indication of heterogeneous adsorption. The adsorption behavior of carbon materials in the pH studied, indicated that the adsorption takes place via dispersive interaction, as discussed earlier. However, the contribution of oxygen-containing functional groups cannot be excluded.23 Besides oxygen functionalities, FruLi + TCA contains sulfur and as a large size atom (70 ppm) it disrupts connection pattern in the carbon network causing charge localization.36 Sulfur was not found to alter surface acidity as pHIEP remained similar to sulfur-free FruLi. However, the total acidity of Fruli + TCA was slightly lower, indicating a lower amount of oxygen functionalities, as also supported by XPS. A lower amount of oxygen functionalities as well as introduction of sulfur may have indeed an inhibiting effect on the adsorption performance of Fruli + TCA.
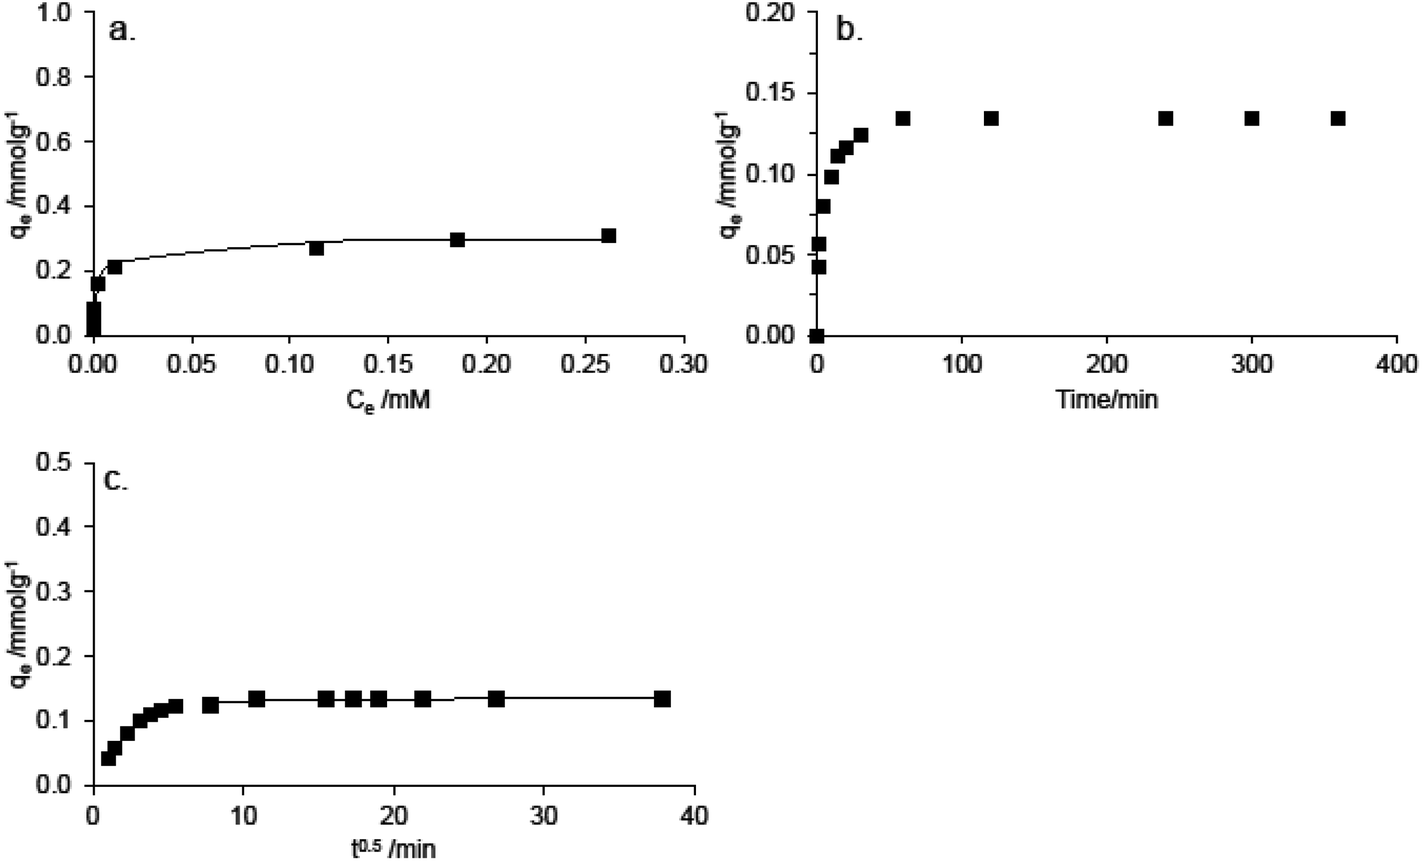 | ||
| Fig. 7 A. Experimental adsorption equilibrium Fruli Methylene Blue (■) results and Sips adsorption isotherm (—) B. Experimental kinetic data and C. Intraparticle diffusion modeling. | ||
| Material | Sips | n S | r 2 | STDEV | Intraparticle diffusion | ||||
|---|---|---|---|---|---|---|---|---|---|
| q e,exp (mmol g−1) | q e (mmol g−1) | K S (l mmol−1) | k dif1 (mmol(g min1/2)−1) | k dif2 (mmol(g min1/2)−1) | k dif3 (mmol(g min1/2)−1) | ||||
| FruLi | 0.3 | 0.30 | 327.4 | 0.8 | 0.962 | 0.11 | 0.03 | 0.01 | 0.0002 |
| Fruli + TCA | 0.2 | 0.24 | 552.8 | 0.7 | 0.970 | 0.09 | 0.03 | 0.006 | 0.0001 |
Besides the typical single solution experiments performed above, the adsorption capacity of the studied carbon materials towards methylene blue was also tested with synthetic sewage, prepared by following the standard procedure of Organization for Economic Cooperation and Development (OECD) guidelines for chemical testing. The composition of this synthetic sewage is presented in Table 2. Interestingly, the Methylene blue adsorption was found to increase with more than 30% from the one-component solution test, for both carbon materials. A maximum adsorption capacity for the removal of methylene blue from the synthetic sewage was determined 0.3 mmol g−1 and 0.42 mmol g−1 for Fruli + TCA and FruLi respectively. Increase in the adsorption capacities are probably related to the fact that the combination of salts in the synthetic sewage is changing the strength of the repulsion between the adjacently adsorbed dye molecules. Therefore, a greater packing density of the adsorbed organic ions on the carbon surface can be achieved.48
The effect of contact time on the adsorption of methylene blue are presented in the Fig. 7b and S5b.† The experimental kinetic data, indicated that over 90% removal rate of methylene blue was reached during the first 30 min. This is due to a fast external diffusion. At the equilibrium state, 99.9% of the maximum removal of methylene blue was reached. The role of diffusion in the speed of the adsorption can be further examined using the so called intraparticle diffusion model, in order to separate different diffusion stages during the adsorption. From the plots of qtversus t0.5 of methylene blue, a multilinearity was observed, indicating a three step adsorption process (Fig. 7c, Table 3 and S5c†). The first, sharp step is attributed to the diffusion of the dye through the solution to the external surface of the adsorbent, or the boundary layer diffusion of solute molecules. The second step relates to a gradual adsorption stage, where the intraparticle diffusion was rate limiting. The third step is the final equilibrium step where intraparticle diffusion has started to decrease due to a low dye concentration left in the solution.49 If the intraparticle diffusion was the only rate controlling step, the plot should pass through the origin, which is not the case in here. Presumably, film diffusion or chemical reaction controls the adsorption rate.50
The regeneration of adsorbent would extend the lifetime of the adsorbent and make it ecologically and economically feasible. The desorption technique, i.e. physical- or chemical (e.g. gas phase, extraction and pH shift desorption) depends on the type of adsorbent, the nature of wastewater and also on further treatments. Chemical extraction using solvents can be applied (KOH,46 acetonitrile,46 HNO3, methanol/acetic acid (10:1)26 and ethanol51 in different H2O/ethanol ratios) if the affinity of the adsorbate towards H2O is low. Here, ethanol was chosen for the removal of Methylene blue, allowing an easy evaporation at room temperatures. However, it is applicable only if further reactivation of adsorbent is unnecessary. This is not the case for activated carbons, which often require an additional reactivation step at higher temperatures, after regeneration. This has been found to cause a decrease in the adsorption capacity.52 Ethanol was found efficient in desorption of methylene blue from our carbon adsorbents (FruLi and FruLi + TCA). FruLi was found to maintain its adsorption capacity well over 99% through all three adsorption cycles, whereas the adsorption efficiency of FruLi + TCA decreased after regeneration and was found to be 90% after the third cycle (S6†).
In the Table 4 are presented activated carbons,53,54 carbon composites55 and other carbonaceous materials56 with different production conditions, textural and surface properties. Carbon materials presented in this study have indicated benefits in both sides production and application. The clear advantage in production of carbon materials for adsorption application is the utilization of hydrothermal carbonization which is straightforward synthesis with reduced synthesis steps and still get materials with good textural and surface properties. From the sustainability and circular economy point of view it would be advantageous if process can be kept circular as indicated in the reuse of reaction components (salt mixture) as well as high complete removal percentages and regeneration ability of the carbon materials itself.
| Adsorbent | Synthesis | S BET (mg g−1) | V p (cm3 g−1) | Acidity (mmol g−1) | pHoptimal | q e (mg g−1) | Ref. |
|---|---|---|---|---|---|---|---|
| a High temperature. | |||||||
| Alginic acid derived Starbon (A300) | Retrogradion 5 °C, HTa-treatment 300 °C | 280 | 1.41 | n.a | n.a | 186 | 56 |
| Norit (commercial) | n.a | 798 | 0.57 | n.a | n.a | 42 | |
| Clay@Carbon composite | Pyrolysis in the presence of H2SO4 500 °C | 1290 | 1.5 | n.a | n.a | 260 | 55 |
| Activated carbon (Coconut) | Dried 110 °C, HT-treatment 500 °C, dried 130 °C and HT treatment 700 °C | 2825 | 1.5 | 1.8 | n.a | 900 | 53 |
| Activated carbon (Hazelnut shell) | Dried 110 °C, dehydration 103 °C and ZnCl2 activated 850 °C | 793 | n.a | 0 | n.a | 8.8 | 54 |
| Fruli | HTC 180 °C in the presence eutectic salt mixture | 431 | 0.4 | 0.87 | 6 | 83 | This study |
3. Experimental section
3.1. Synthesis of carbon materials
The carbon materials were synthesized from D-Fructose (Alfa Aesar) via hydrothermal carbonization. 2-Thiophenecarboxyaldehyde (TCA) (Sigma-Aldrich) was added as a sulfur source. LiCl–ZnCl2 eutectic salt mixture was used as soft template in which eutectic salt ratio was 23 mol% of lithium chloride. In a typical synthesis, the saccharide (Fructose, 6 g) was mixed with water (3 g), TCA (1 g) and LiCl–ZnCl2 salt mixture (9 g). The reaction mixture was placed in glass inlet, sealed in a Teflon lined autoclave and placed in an oven, which was preheated to 180 °C. The autoclave was kept in the oven for 16 h. The obtained carbon material was removed from the glass inlet, placed in water (1 l) and stirred overnight in order to remove the salt from the carbon material. Finally, the carbon material was vacuum filtrated, washed extensively with water and dried in the oven under vacuum at 80 °C overnight. Complete salt removal was confirmed by thermogravimetric (TG) analysis under air (S7†).3.2. Characterization
Nitrogen adsorption isotherms at −196 °C were determined with TriStar 3000 (Micromeritics Inc.). The specific surface area was calculated from the adsorption branch of the isotherm using Brunauer–Emmett–Teller theory (BET) and pore size distribution (PSD) was determined with non-local density functional theory (NLDFT) assuming slit shaped pores. CO2 sorption isotherms were performed at 0 °C with Quantachrome autosorb-iQ C automated gas sorption analyzer. The surface area of the carbon materials were calculated by applying the BET model. Pore size distribution and pore volume were determined using NLDFT, similar to N2 sorption studies. Before sorption the samples were degasses under vacuum at 150 °C for 20 h. Thermogravimetric analysis was performed with TA instruments Q500 under air up to 1000 °C. Fourier transform infrared spectroscopy (FTIR) was done with Bruker Tensor 27 equipped with an attenuated total reflectance unit for the analysis of the surface functionalities. Samples were dried under vacuum at 80 °C before analysis. The surface morphology was surveyed with FEI Quanta 3D environmental scanning electron microscope (ESEM) and JEOL JEM-2010 transmission electron microscope (TEM) operating at 200 kV. Elemental amounts of C, H, N and S present in the carbon materials composition were determined with Vario EL elemental analyzer. X-ray photoelectron spectroscopy (XPS) analysis was performed with PHI 5400 ESCA spectrometer (PerkinElmer Co.,) using a Mg Kα X-ray source (hv = 1253.6 eV). The background pressure during the measurements was <10−8 mbar. The peak fitting process was done with Casa XPS (Casa Software Ltd). Shirley-type background was subtracted from the spectra and the binding energy values were referenced to the hydrocarbon C(1s) peak at 285 eV. 13C solid-state magic angle spinning (MAS) nuclear magnetic resonance studies (NMR) were acquired on Bruker Advance 300 MHz (7 T) spectrometer using 4 mm zirconia rotors sipping at a MAS frequency of vMAS = 14 kHz. Chemical shifts were referenced relative to tetramethylsilane (TMS; δ = 0 ppm). Zeta potential was determined by pH titration utilizing Zetasizer Nano ZS (Malvern Instruments Ltd) in which measurement was repeated three times and average of them presented in the plot. The total acidity of the carbon materials was estimated by mixing 50 mg of each carbon material with 30 ml of 0.1 M NaOH. The suspension was mixed for one hour at ambient temperature and separated using a 0.45 μm polypropylene syringe filter. The supernatant was titrated with 0.1 M HCl solution. The solution was sparged with N2 for 10 min before titration and continued throughout titration in order to prevent interfering effect of dissolved CO2.23,57 The equivalent point was observed by color change using phenolphthalein indicator.3.3. Adsorption
Dye removal efficiency of carbon materials was tested with basic blue 9 (methylene blue) (Sigma-Aldrich). The concentrations in the aqueous solution were determined spectrophotometrically in the visible range of the spectrum. Maximum wavelength (λmax) was 664 nm for methylene blue. Methylene blue solutions for adsorption studies were diluted from 1 mM stock solution.In the study of the pH effect (tested pH range 3–8), the amount of adsorbent was 20.0 mg and the volume of dye solution 10 ml. These amounts were used throughout all the adsorption experiments. Dye concentration was 0.4 mM, reaction temperature 20 °C, and stirring speed 200 rpm. The suspensions were agitated with a rotary shaker (Ika KS 4000i). The solution pH was adjusted with 0.1 M NaOH or 0.1 M HNO3. The effect of the reaction temperature was carried out at temperatures of 20, 40 and 60 °C. The dye concentration and speed were the same as in the study of pH effect. The adsorption equilibrium studies were conducted at 20 °C, pH 6, and 24 h with 200 rpm stirring speed. The dye concentrations varied between 0.05–0.8 mM. The kinetic studies were conducted at ambient temperature and pH 6 under a constant stirring using a 0.2 mM Methylene Blue solution in which the “slurry batch reactor” method was applied as an experimental setup.58
The amount of Methylene Blue adsorbed per unit mass of adsorbent was calculated as follows:
| qe = (Ci − Ce)V/m | (1) |
Sips adsorption isotherm was used to model the experimental data obtained in one-component systems. Equation for Sips isotherm is presented as follows:
| qe = qm[(KSCe)nS/(1 + (KSCe)nS] | (2) |
In which KS (L mmol−1) is the affinity constant, Ce (mmol l−1) is the dye concentration at the equilibrium state and nS describes the surface heterogeneity.
Pore diffusion as a controlling step in the adsorption was considered by intraparticle diffusion model as follows:
| qe = kdift1/2 + (C) | (3) |
Synthetic sewage was prepared according OECD guideline for the testing of chemicals.45 The solution was prepared in tap water containing peptone 160 mg, meat extract 110 mg, urea 30 mg, anhydrous K2HPO4 28 mg, NaCl 7 mg CaCl2·2H2O 4 mg and Mg2SO4·7H2O 2 mg. Synthetic sewage was used as solvent when preparing methylene blue solutions in varying concentrations (0.05 mM–0.9 mM). The Methylene blue addition did not change the solution pH significantly. The solution was prepared prior use and stored in the fridge for no more than one week.
In the regeneration studies, 0.4 mM Methylene blue solution was in contact with adsorbent under reaction conditions similar to the adsorption equilibrium studies. The desorption was performed with excess amount of Ethanol (denaturated). The dye containing EtOH adsorbent mixture was centrifuged at 10000 rpm for 10 min (Centrifuge 5810R, Eppendorf) and the supernatant was carefully removed. The carbon materials were dried in the oven at 80 °C.
4. Conclusion
Porous carbonaceous materials were successfully synthesized from fructose in the presence of an eutectic salt mixture (LiCl–ZnCl2) via hydrothermal carbonization technique (HTC) at low temperatures. Sulfur was successfully doped in the carbon network via 2-thiophenecarboxaldehyde. Among the several potential applications, the applicability of the produced carbon materials in water treatment for dye removal was tested. The carbon materials showed a great ability for the removal of methylene blue. Interestingly, the adsorption capacity improved significantly when synthetic sewage was used. The adsorption process was found to be fast and controlled by intraparticle diffusion. Furthermore, the carbon materials were successfully regenerated by liquid extraction using EtOH.Acknowledgements
Finnish Funding Agency for Technology and Innovation (TEKES), Tekniikan edistämissäätiö (TES) and Maa-ja Vesitekniikan tuki (MVTT) are thanked for the financial support. Sakari Modig and Anna Timofeeva are thanked for their valuable contribution to the adsorption experiments, Dr Bingjun Zhu for the CO2 sorption analysis and Dr Zhang is thanked for the scientifical discussions. Furthermore, Dr Niki Baccile and Guillaume Laurent from the Chimie de la Matière Condensée de Paris are thanked for their contribution with the NMR analysis.References
- N. Fechler, T.-P. Fellinger and M. Antonietti, Adv. Mater., 2013, 25, 75–79 CrossRef CAS PubMed.
- D.-W. Wang, Q. Zeng, G. Zhou, L. Yin, F. Li, H.-M. Cheng, I. R. Gentle and G. Q. M. Lu, J. Mater. Chem. A, 2013, 1, 9382–9394 CAS.
- J. Chen, X. Wang, X. Cui, G. Yang and W. Zheng, Chem. Commun., 2014, 50, 557–559 RSC.
- L. Yu, C. Falco, J. Weber, R. J. White, J. Y. Howe and M.-M. Titirici, Langmuir, 2012, 28, 12373–12383 CrossRef CAS PubMed.
- A. C. Lua and T. Yang, J. Colloid Interface Sci., 2004, 274, 594–601 CrossRef CAS PubMed.
- M. M. Titirici, A. Thomas and M. Antonietti, Adv. Funct. Mater., 2007, 17, 1010–1018 CrossRef CAS.
- M. M. Titirici, M. Antonietti and N. Baccile, Green Chem., 2008, 10, 1204–1212 RSC.
- R. J. White, K. Tauer, M. Antonietti and M.-M. Titirici, J. Am. Chem. Soc., 2010, 132, 17360–17363 CrossRef CAS PubMed.
- N. Brun, K. Sakaushi, L. Yu, L. Giebeler, J. Eckert and M. M. Titirici, Phys. Chem. Chem. Phys., 2013, 15, 6080–6087 RSC.
- R. J. White, Porous Carbon Materials from Sustainable Precursors, Royal Society of Chemistry, 2015 Search PubMed.
- N. Fechler, S.-A. Wohlgemuth, P. Jaker and M. Antonietti, J. Mater. Chem. A, 2013, 1, 9418–9421 CAS.
- W. L. Queen, S.-J. Hwu and S. Reighard, Inorg. Chem., 2010, 49, 1316–1318 CrossRef CAS PubMed.
- N. Fechler, T. P. Fellinger and M. Antonietti, Adv. Mater., 2013, 25, 75–79 CrossRef CAS PubMed.
- C. J. Liao, C. F. Chen, J. H. Chen, S. F. Chiang, Y. J. Lin and K. Y. Chang, J. Biomed. Mater. Res., 2002, 59, 676–681 CrossRef CAS PubMed.
- G. Imperato, S. Hoger, D. Lenoir and B. Konig, Green Chem., 2006, 8, 1051–1055 RSC.
- G. Janz, Thermodynamic and Transport Properties for Molten Salts: Correlation Equations for Critically Evaluated Density, Surface Tension, Electrical Conductance and Viscosity Data, American Chemical Society, 1988 Search PubMed.
- N. F. S.-A. W. P. J. a. M. Antonietti, J. Mater. Chem. A, 2013, 9418–9421 Search PubMed.
- X. Liu, N. Fechler and M. Antonietti, Chem. Soc. Rev., 2013, 42, 8237–8265 RSC.
- N. F. T.-M. F. M. Antonietti, Mater. Views, 2012, 25, 75–79 Search PubMed.
- Y. Yang, Y. Xie, L. Pang, M. Li, X. Song, J. Wen and H. Zhao, Langmuir, 2013, 29, 10727–10736 CrossRef CAS PubMed.
- S. J. A. G. M. J. F. Porter, J. Colloid Interface Sci., 2004, 322–333 Search PubMed.
- S. J. Allen, G. McKay and J. F. Porter, J. Colloid Interface Sci., 2004, 280, 322–333 CrossRef CAS PubMed.
- P. C. C. Faria, J. J. M. Órfão and M. F. R. Pereira, Water Res., 2004, 38, 2043–2052 CrossRef CAS PubMed.
- J. L. Figueiredo, J. P. S. Sousa, C. A. Orge, M. F. R. Pereira and J. J. M. Órfão, Adsorption, 2011, 17, 431–441 CrossRef CAS.
- Y. Yan, M. Zhang, K. Gong, L. Su, Z. Guo and L. Mao, Chem. Mater., 2005, 17, 3457–3463 CrossRef CAS.
- Z. Wu, H. Zhong, X. Yuan, H. Wang, L. Wang, X. Chen, G. Zeng and Y. Wu, Water Res., 2014, 67, 330–344 CrossRef CAS PubMed.
- M. F. R. Pereira, S. F. Soares, J. J. M. Órfão and J. L. Figueiredo, Carbon, 2003, 41, 811–821 CrossRef CAS.
- D. Liu, W. Yuan, P. Yuan, W. Yu, D. Tan, H. Liu and H. He, Appl. Surf. Sci., 2013, 282, 838–843 CrossRef CAS.
- L. Fan, C. Luo, X. Li, F. Lu, H. Qiu and M. Sun, J. Hazard. Mater., 2012, 215–216, 272–279 CrossRef CAS PubMed.
- L. Fan, Y. Zhang, C. Luo, F. Lu, H. Qiu and M. Sun, Int. J. Biol. Macromol., 2012, 50, 444–450 CrossRef CAS PubMed.
- K. A. G. Gusmão, L. V. A. Gurgel, T. M. S. Melo and L. F. Gil, J. Environ. Manage., 2013, 118, 135–143 CrossRef PubMed.
- K. S. W. Sing, Pure Appl. Chem., 1982, 54, 2201–2218 CrossRef.
- J. Coates, in Encyclopedia of Analytical Chemistry, John Wiley & Sons, Ltd, 2006 Search PubMed.
- H. Seema, K. C. Kemp, N. H. Le, S.-W. Park, V. Chandra, J. W. Lee and K. S. Kim, Carbon, 2014, 66, 320–326 CrossRef CAS.
- Z. Liu, H. Nie, Z. Yang, J. Zhang, Z. Jin, Y. Lu, Z. Xiao and S. Huang, Nanoscale, 2013, 5, 3283–3288 RSC.
- S.-A. Wohlgemuth, R. J. White, M.-G. Willinger, M.-M. Titirici and M. Antonietti, Green Chem., 2012, 14, 1515–1523 RSC.
- M. Sevilla and A. B. Fuertes, Microporous Mesoporous Mater., 2012, 158, 318–323 CrossRef CAS.
- S.-A. Wohlgemuth, F. Vilela, M.-M. Titirici and M. Antonietti, Green Chem., 2012, 14, 741–749 RSC.
- T. Narasimhaswamy, N. Somanathan, D. K. Lee and A. Ramamoorthy, Chem. Mater., 2005, 17, 2013–2018 CrossRef CAS.
- J. M. D. Tascon, Novel carbon adsorbents, 2012 Search PubMed.
- J. Galán, A. Rodríguez, J. M. Gómez, S. J. Allen and G. M. Walker, Chem. Eng. J., 2013, 219, 62–68 CrossRef.
- E. N. El Qada, S. J. Allen and G. M. Walker, Chem. Eng. J., 2006, 124, 103–110 CrossRef CAS.
- S. Lei, J.-i. Miyamoto, H. Kanoh, Y. Nakahigashi and K. Kaneko, Carbon, 2006, 44, 1884–1890 CrossRef CAS.
- J. J. M. Órfão, A. I. M. Silva, J. C. V. Pereira, S. A. Barata, I. M. Fonseca, P. C. C. Faria and M. F. R. Pereira, J. Colloid Interface Sci., 2006, 296, 480–489 CrossRef PubMed.
- M. J. Iqbal and M. N. Ashiq, J. Hazard. Mater., 2007, 139, 57–66 CrossRef CAS PubMed.
- X. He, K. B. Male, P. N. Nesterenko, D. Brabazon, B. Paull and J. H. T. Luong, ACS Appl. Mater. Interfaces, 2013, 5, 8796–8804 CAS.
- K. Foo and B. Hameed, Chem. Eng. J., 2010, 156, 2–10 CrossRef CAS.
- D. O. Cooney, Adsorption design for wastewater treatment, Lewis Publishers, 1999 Search PubMed.
- W. H. Cheung, Y. S. Szeto and G. McKay, Bioresour. Technol., 2007, 98, 2897–2904 CrossRef CAS PubMed.
- Z. Tian, B. Yang, G. Cui, L. Zhang, Y. Guo and S. Yan, RSC Adv., 2015, 5, 2266–2275 RSC.
- J.-M. Chern and C.-Y. Wu, Water Res., 2001, 35, 4159–4165 CrossRef CAS PubMed.
- R. Berenguer, J. P. Marco-Lozar, C. Quijada, D. Cazorla-Amorós and E. Morallón, Energy Fuels, 2010, 24, 3366–3372 CrossRef CAS.
- A. L. Cazetta, A. M. Vargas, E. M. Nogami, M. H. Kunita, M. R. Guilherme, A. C. Martins, T. L. Silva, J. C. Moraes and V. C. Almeida, Chem. Eng. J., 2011, 174, 117–125 CrossRef CAS.
- A. Aygün, S. Yenisoy-Karakaş and I. Duman, Microporous Mesoporous Mater., 2003, 66, 189–195 CrossRef.
- A. Bakandritsos, E. Kouvelos, T. Steriotis and D. Petridis, Langmuir, 2005, 21, 2349–2355 CrossRef CAS PubMed.
- H. L. Parker, A. J. Hunt, V. L. Budarin, P. S. Shuttleworth, K. L. Miller and J. H. Clark, RSC Adv., 2012, 2, 8992–8997 RSC.
- C. Moreno-Castilla, F. Carrasco-Marin, E. Utrera-Hidalgo and J. Rivera-Utrilla, Langmuir, 1993, 9, 1378–1383 CrossRef CAS.
- E. Worch, Adsorption technology in water treatment: fundamentals, processes, and modeling, Walter de Gruyter, 2012 Search PubMed.
Footnote |
| † Electronic supplementary information (ESI) available. See DOI: 10.1039/c5gc01796c |
| This journal is © The Royal Society of Chemistry 2016 |