
 Open Access Article
 This Open Access Article is licensed under a
 Creative Commons Attribution 3.0 Unported Licence
Oral administration of green algae, Euglena gracilis, inhibits hyperglycemia in OLETF rats, a model of spontaneous type 2 diabetes
Ryoko
Shimada
*ab,
Miho
Fujita
a,
Masahiro
Yuasa
ac,
Hiromi
Sawamura
d,
Toshiaki
Watanabe
ab,
Ayaka
Nakashima
e and
Kengo
Suzuki
e
aDepartment of Dietary Environment Analysis, School of Human Science and Environment, University of Hyogo, 1-1-12 Sinzaike Honcho, Himeji 670-0092, Japan. E-mail: r-shimada@osaka-aoyama.ac.jp
bDepartment of Health and Nutrition, Faculty of Health Science, Osaka Aoyama University, 2-11-1 Niina, Minoh, Osaka 562-8580, Japan
cDepartment of Nutrition Science, Faculty of Nursing and Nutrition, University of Nagasaki, 1-1-1 Manabino, Nagayo-cho, Nishi-Sonogi-gun, Nagasaki 851-2195, Japan
dDepartment of Molecular Nutrition, School of Human Science and Environment, University of Hyogo, 1-1-12 Sinzaike Honcho, Himeji 670-0092, Japan
eEuglena Co., Ltd., 5-33-1 Shiba, Minato-ku, Tokyo 108-0014, Japan
First published on 24th October 2016
Abstract
In the present study, the effects of Euglena and paramylon on hyperglycemia were examined in Otsuka Long–Evans Tokushima fatty (OLETF; type 2 diabetes mellitus model) rats. OLETF rats were fed an AIN-93 M diet containing cellulose, Euglena, or paramylon for 10 weeks. Long–Evans Tokushima Otsuka (LETO) rats were used as nondiabetic controls. An oral glucose-tolerance test (OGTT) was performed at 0 and 10 weeks. OLETF control rats were obese because of bulimia and showed abdominal fat accumulation and hyperglycemia. Euglena supplementation improved hyperglycemia and decreased food intake, body weight gain, and abdominal fat. However, there were no changes in the paramylon-supplemented group compared to the OLETF control group. Triglyceride concentrations in the serum and liver were lower in Euglena-supplemented rats than in OLETF control rats. There was a correlation between hepatic triglyceride concentration and the area under the curve (AUC) of OGTT at 10 weeks. This suggests that the improvement in glycemic control in the Euglena-supplemented group may depend on substances other than paramylon present in Euglena.
Introduction
Euglena gracilis Z, which is a unicellular photosynthesizing green algae, stores various nutrients such as vitamins and minerals. It is easy to digest and absorb these micronutrients, because unlike plants, Euglena has no cell wall. The polysaccharide paramylon is a flattened disk and is one of Euglena's characteristic components. Paramylon consists of only glucose (average of 700 glucose molecules). Methylation analysis and infrared absorption spectra analysis showed that paramylon consists of only β-1,3 glycosidic bonds. Moreover, X-ray analysis indicated that paramylon is formed from the triple helix of glucan strands.1 Although paramylon degrades in solvents such as DMSO and NaOH, it is essentially insoluble in water. Thus, it has been predicted that paramylon cannot be digested in the human body. Paramylon is an insoluble dietary fiber, but shows water and oil-retention properties because of its porousness.2,3 Numerous studies have evaluated the association between the intake of Euglena or paramylon and health. For instance, in rats, Euglena intake was reported to decrease the gastrointestinal transit time and impair cholesterol absorption. The beneficial action of Euglena's anti-allergic properties,4 enhanced immunological functions,5 and preventive effects against colon cancer6 have been reported in the in vivo studies of paramylon.The prevalence of type 2 diabetes mellitus (T2DM) is rapidly increasing and is a major public health problem. T2DM is induced by an increase in insulin resistance, which is caused by abdominal fat accumulation resulting from genetic predisposition, hyperphagia, obesity, and lack of exercise. Numerous studies have evaluated the association between the onset risk of DM and intake of dietary fiber.7 Insulin resistance is enhanced by increase of plasma adiponectin and accumulation of liver lipids and cholesterol. Choi et al.8 reported that the consumption of β-glucan from barley can decrease the postprandial glucose curve, weight gain, and hepatic lipid accumulation, as well as improve insulin sensitivity in mice fed a high-fat diet. Glucose control was improved in T2DM model rat fed diets containing 6% β-glucan in the form of barley flour for 6 weeks.9
Otsuka Long–Evans Tokushima Fatty (OLETF) rats are widely used as an animal model of T2DM in studies on diabetes. These rats show disordered dietary behavior such as hyperphagia because they lack receptors for cholecystokinin. They develop obesity and hyperlipidemia, leading to insulin resistance.10–13 Substances that lower the triglyceride levels, such as β-glucan, are effective against diabetes, and it was suggested that the intake of Euglena could decrease the serum triglyceride content in humans. In the present study, we examined whether Euglena and paramylon could improve hyperglycemia in OLETF rats.
Material and methods
Experimental animals and diets
In this study, 15 male OLETF and 5 male Long–Evans Tokushima Otsuka (LETO) rats were used. LETO rats were bred from the same colony as the OLETF rats by selective mating, and hence, they did not suffer from DM. These rats were purchased from Japan SLC, Inc. (Hamamatsu, Japan) at the age of 6 weeks. Rats were acclimated with a standard diet for rodents (CE-2; CLEA, Tokyo, Japan) for 1 week in the animal room, which was maintained at a constant temperature (23–25 °C) and relative humidity (50–60%) under a 12 h light/dark cycle (light on 0900–2100 h). Rats were given free access to food and distilled water.Diabetic group OLETF rats were randomly assigned into 3 dietary groups. They were administered a semi-purified control diet (AIN-93 M) or a test diet containing 2% powdered test substances (Euglena or paramylon) at a specific concentration, with cellulose being the control diet (Table 1). Nondiabetic LETO rats were fed the same control diet. Body weight was measured each week, and dietary intake was measured every day.
| Control diet | Test diet | |
|---|---|---|
| g kg−1 | ||
| a Euglena or paramylon. | ||
| Casein | 140.0 | 140.0 |
| α-Corn starch | 155.0 | 155.0 |
| β-Corn starch | 465.7 | 465.7 |
| Sucrose | 100.0 | 100.0 |
| Soybean oil | 40.0 | 40.0 |
| AIN-93 mineral mixture | 35.0 | 35.0 |
| AIN-93 vitamin mixture | 10.0 | 10.0 |
| L-Cystine | 1.8 | 1.8 |
| Choline bitartrate | 2.5 | 2.5 |
| Cellulose | 50.0 | 30.0 |
| Test substancesa | 20.0 | |
Euglena is composed of 29.4% carbohydrates, 42.3% protein, 19.0% fat, 6.1% ash, and 3.2% water. Approximately 70–80% of carbohydrates included in Euglena were assumed to be paramylon. Euglena and paramylon were provided in the powdered form by euglena Co., Ltd (Tokyo, Japan). Euglena cultivation is strictly controlled under low pH conditions by the euglena Company. The culture liquid of Euglena cells was concentrated using ultrafiltration and centrifugation. The obtained Euglena suspension was dried using a spray dryer. Finally, the dried powder was mixed into the feed. Paramylon isolation was conducted using a standard method.6
After breeding of rats for 10 weeks, rat feces were collected after 24 h fasting using a metabolic cage for animals (CLEA). Rats were sacrificed after whole blood was collected from the descending aorta, and the serum was obtained by centrifugation at 1500g for 15 min. Hepatic and abdominal fat (epididymal, retroperitoneal, and mesenteric) were sampled and weighed. These samples were stored at −30 °C before use.
All animal experiments were approved by the Institutional Animal Care and Use Committee of the School of Human Science and Environment, the University of Hyogo (No. 037; 2011), and were performed in accordance with the standards dictated by the Guidelines for the Care and Management of Experimental Animals outlined by the Japanese Prime Minister's Office (No. 6; 1980).
OGTT
The oral glucose tolerance test (OGTT) was conducted immediately after breeding (0 week) and after 10 weeks. The OGTT assay was conducted as described by Nakaya et al.14 Rats were administered a glucose solution orally via a gastric tube (2 g per kg body weight) after fasting for 18 h. Blood was collected from the tail vein, and glucose concentration was measured with a Glucose Pilot (Aventir Biotech, Carlsbad, CA, USA). The area under the curve (AUC) was calculated at 0, 30, 60, and 120 min after gavage administration.Triglyceride and cholesterol measurements
Triglyceride and total cholesterol concentrations in the serum were measured using a FUJI DRI-CHEM 3000 (Fujifilm Co., Ltd, Tokyo, Japan). Hepatic and fecal samples were used to determine lipid levels, which were extracted using a modified Folch extraction procedure.15 Hepatic triglyceride concentration was assayed with L Type Wako TG-H (Wako Pure Chemical Industries, Ltd, Osaka, Japan), and triglycerides in the feces were determined using the acetylacetone method.16 Hepatic and fecal total cholesterol were measured using the Zak–Henly method.17Statistical analysis
All data are presented as the mean ± SEM. Statistical analyses were performed using Excel 2007 software (Microsoft, Seattle, WA, USA) and Statcel 2 (OMS Publishing, Tokorozawa, Japan). Data were analyzed by one-way ANOVA, and significant differences among means were determined by the Tukey–Kramer test. Differences were considered significant at P < 0.05. The coefficient of correlation was used as the Pearson correlation coefficient.Results
Body weight, food intake, and organ weight
The initial body weight was greater in OLETF rats than in nondiabetic rats (Table 2). However, the final body weight and food intake were lower in OLETF Euglena group than in the OLETF control group and OLETF paramylon group. Blood glucose level and AUC were no change in LETO and OLETF rats at 0 week (Fig. 1(A), (B)). At 10 weeks, blood glucose concentrations before glucose challenge were significantly higher in OLETF rats than in nondiabetic rats (Fig. 1C). Nondiabetic rats showed lower glucose levels at 0, 60, and 120 min, and Euglena supplementation decreased the glucose level at 120 min compared to that in OLETF control rats. The AUC was lower in the nondiabetic and Euglena-supplemented rats than in OLETF control rats (Fig. 1D). Paramylon supplementation did not change the glucose level and AUC compared to that in OLETF control rats. | ||
| Fig. 1 Effects of Euglena and paramylon on oral glucose tolerance test (OGTT) and oral glucose tolerance area under the curve (AUC) in rats. OGTT for Otsuka Long–Evans Tokushima Fatty (OLETF) rats [Euglena (▲), paramylon (◆) supplemented and control (■)] and nondiabetic control (□) rats. Glucose level was measured at 0, 30, 60, and 120 min after administering 2 g per kg body weight of glucose orally at 0 week (A) and 10 weeks after consumption of test diets (C). AUC of Otsuka Long–Evans Tokushima Fatty (OLETF) rats [Euglena- and paramylon-supplemented and control] and nondiabetic control rats were calculated at 0 weeks (B) and 10 weeks after consumption of test diets (D). Date represent the mean ± SEM (n = 5 per group). Significance was determined using Tukey–Kramer's test (significant P < 0.05) difference in unlike superscript letters. | ||
| LETO, nondiabetic rats | OLETF, diabetic rats | ||||
|---|---|---|---|---|---|
| Control | Euglena | Paramylon | |||
| Date represent the mean ± SEM (n = 5 per group). P < 0.05, significant difference in unlike superscript letters by Tukey–Kramer's test. | |||||
| Initial body weight | g | 193 ± 4a | 223 ± 4b | 222 ± 3b | 222 ± 3b |
| Final body weight | g | 473 ± 17a | 508 ± 7b | 469 ± 17a | 543 ± 9bc |
| Body weight gain | g | 279 ± 14ab | 285 ± 4ab | 247 ± 16a | 321 ± 10b |
| Food intake | g per day | 21.0 ± 0.3a | 25.0 ± 0.4b | 21.3 ± 0.6a | 23.4 ± 0.4b |
| Abdominal fat | g | 26.7 ± 3.5a | 46.9 ± 2.3b | 33.0 ± 4.3ab | 44.6 ± 4.4b |
| Liver | g | 2.73 ± 0.15 | 2.84 ± 0.17 | 2.99 ± 0.18 | 2.61 ± 0.17 |
Changes in lipid metabolism
Triglyceride concentration in the serum was significantly higher in OLETF control and paramylon-supplemented rats than in nondiabetic rats, and was not increased in Euglena-supplemented rats (Table 3). However, triglyceride concentration in the liver was only increased in OLETF controls. There was a correlation between hepatic triglyceride concentration and AUC at 10 weeks (Fig. 2; r = 0.547, P = 0.009). In the feces, triglyceride concentration did not change in Euglena- and paramylon-supplemented rats. Additionally, serum, hepatic, and feces total cholesterol concentrations were not changed in OLETF rats compared to those in nondiabetic rats.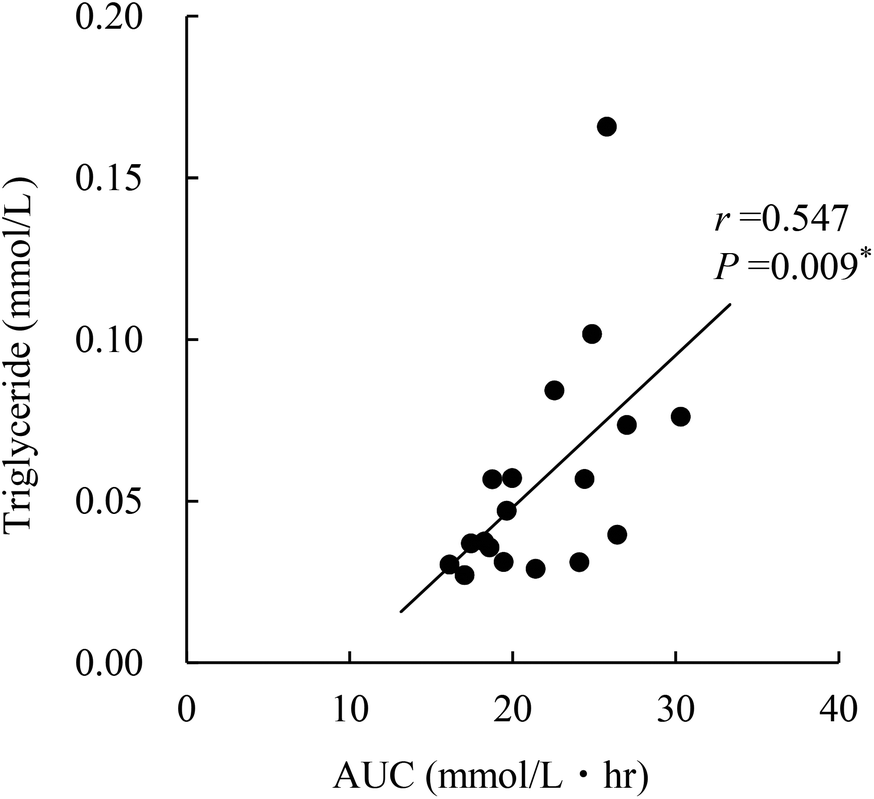 | ||
| Fig. 2 Correlation of triglycerides in the liver and oral glucose tolerance area under the curve (AUC) at 10 weeks after administering test diets. *Significance was determined using Pearson's correlation coefficient. | ||
| LETO, nondiabetic rats | OLETF, diabetic rats | ||||
|---|---|---|---|---|---|
| Control | Euglena | Paramylon | |||
| Date represent the mean ± SEM (n = 5 per group). P < 0.05, significant difference in unlike superscript letters by Tukey–Kramer's test. | |||||
| Serum | |||||
| Triglycerides | mmol L−1 | 0.69 ± 0.04a | 2.03 ± 0.21b | 1.47 ± 0.25ab | 2.12 ± 0.39b |
| Total cholesterol | mmol L−1 | 1.95 ± 0.12 | 1.95 ± 0.12 | 2.34 ± 0.11 | 2.68 ± 0.33 |
| Liver | |||||
| Triglycerides | mmol per liver | 0.040 ± 0.006a | 0.095 ± 0.019b | 0.040 ± 0.005a | 0.045 ± 0.013ab |
| Total cholesterol | mmol per liver | 0.27 ± 0.002 | 0.028 ± 0.004 | 0.021 ± 0.001 | 0.023 ± 0.002 |
| Feces | |||||
| Wet weight | g per day | 2.02 ± 0.27ab | 1.28 ± 0.12a | 1.62 ± 0.37ab | 2.45 ± 0.26b |
| Triglycerides | mmol per day | 0.17 ± 0.02 | 0.13 ± 0.01 | 0.18 ± 0.05 | 0.22 ± 0.02 |
| Total cholesterol | mmol per day | 0.19 ± 0.04 | 0.13 ± 0.01 | 0.16 ± 0.03 | 0.16 ± 0.02 |
Discussion
In the present study, we investigated whether intake of Euglena or paramylon improved hyperglycemia, and found that food intake and the body weight of Euglena-fed rats significantly decreased. Moreover, the energy intake by this group also decreased (68 kcal per day: LETO group, 81 kcal: OLETF control group, 70 kcal: OLETF Euglena group, 76 kcal: OLETF paramylon group), suggesting that bulimia was suppressed by Euglena. It has been shown that Euglena only minimally affects food intake in normal animals.4–6 Therefore, suppression of bulimia by Euglena may be specific for OLETF rats, although the mechanism remains unclear.OLETF rats lacking receptors for cholecystokinin10–13 became obese because of bulimia and showed abdominal fat accumulation and hyperglycemia. In this study, abdominal fat and hepatic triglycerides increased with increasing food intake (abdominal fat: r = 0.730, P = 0.0006, hepatic triglycerides: r = 0.620, P = 0.006).
Euglena supplementation improved hyperglycemia, as evidenced by lower food intake, abdominal fat, and hepatic triglyceride concentrations in the Euglena-supplemented group compared to those in the control group. It is suggested that the body weight of the Euglena group decreased more than the paramylon-fed group due to the lower food intake (i.e. suppression of bulimia).
The intake of Euglena by humans for two months resulted in improved lipid metabolism, and possibly decreased the fat mass and weight (unpublished). Rats fed Euglena over long term showed suppression of body weight and abdominal fat weight increases, and improved lipid metabolism (Table 2). The intake of Euglena is thought to improve blood glucose control by decreasing liver triglyceride levels in OLETF rats. However, paramylon supplementation did not change these parameters such as the triglycerides of hepatic and AUC of OGTT compared with the control group. Therefore, the improved glycemic control in the Euglena-supplemented group may depend on substances other than paramylon present in Euglena. Male OLETF rats are a genetic model for the spontaneous development of T2DM, showing obesity, hyperphagia, hyperglycemia, and insulin resistance at 16 weeks of age.10 Diabetes onset is known to be related to hypertriglyceridemia, resulting in significant triglyceride stores in the liver and subsequently inhibiting glucose-induced insulin secretion in OLETF rats.18,19 In the present study, we detected a correlation between the triglyceride levels in the liver and AUC at 10 weeks, and Euglena supplementation decreased the hepatic triglyceride concentrations. The reason underlying decreasing hepatic triglyceride concentrations may be correlated to decreased food intake. Paramylon supplementation also reduced hepatic triglyceride concentration, with no decrease in food intake. The mechanism for this is not clear.
In this study, Euglena and paramylon intake decreased the triglyceride levels in the liver. It has been suggested that paramylon reduces the incorporation of triglycerides by stimulating fecal excretion. However, β-1,3-glucan has been shown to prevent insulin resistance.8,9,20,21 It was reported that β-glucan supplementation decreased hepatic lipids and improved glucose tolerance.9,21 Lipogenesis of liver and insulin sensitivity are related to short-chain fatty acids (SCFAs).22 SCFAs are produced by anaerobic bacterial fermentation of soluble dietary fibers such as β-glucan of barley, oats23,24 or salecan.21 SCFAs may play an important role in reducing insulin resistance.22,25,26 Although the dynamics of paramylon in the gut remain unclear, it is possible that paramylon was not sufficiently fermented,6 which may have no effect on insulin resistance. Because various molecules such as proteins, lipids, vitamins, and minerals are present in Euglena in addition to paramylon, glucose metabolism improvement may require supplementation with whole Euglena as well as paramylon. In conclusion, the intake of Euglena improved hyperglycemia by decreasing food intake and abdominal and liver fat accumulation. However, this was not observed for paramylon intake. These results suggest that the improvement in glycemic control by Euglena supplementation depends on substances other than paramylon present in Euglena.
Abbreviations
| T2DM | Type 2 diabetes mellitus |
| DM | Diabetes mellitus |
| OLETF | Otsuka Long–Evans Tokushima Fatty |
| LETO | Long–Evans Tokushima Otsuka |
| AUC | Area under the curve |
| SCFAs | Short-chain fatty acids |
Acknowledgements
The authors thank Aiko Shojyo for her tremendous support.References
- K. Miyatake, S. Takenaka, R. Yamaji and Y. Nakano, J. Soc. Powder Technol., 1995, 32, 566–572 CrossRef CAS.
- R. H. Marchessault and Y. Deslamdes, Carbohydr. Res., 1979, 75, 231–242 CrossRef CAS.
- Y. Kawano, Y. Nakano, S. Kitaoka, K. Katou, S. Shigeoka and T. Ohnishi, J. Jpn. Soc. Nutr. Food Sci., 1987, 40, 193–198 CrossRef.
- A. Sugiyama, S. Hata, K. Suzuki, E. Yoshida, R. Nakano, S. Mitra, R. Arashida, Y. Asayama, Y. Yabuta and T. Takeuchi, J. Vet. Med. Sci., 2010, 72, 755–763 CrossRef CAS PubMed.
- Y. Kondo, A. Kato, H. Hojo, S. Nozoe, M. Takeuchi and K. Ochi, J. Pharmacobiodyn., 1992, 15, 617–621 CrossRef CAS PubMed.
- T. Watanabe, R. Shimada, A. Matsuyama, M. Yuasa, H. Sawamura, E. Yoshida and K. Suzuki, Food Funct., 2013, 4, 1685–1690 CAS.
- M. Galisteo, J. Duarte and A. Zarzuelo, J. Nutr. Biochem., 2008, 19, 71–84 CrossRef CAS PubMed.
- J. S. Choi, H. Kim, M. H. Jung, S. Hong and J. Song, Mol. Nutr. Food Res., 2010, 54, 1004–1013 CAS.
- D. A. Brockman, X. Chen and D. D. Gallaher, Eur. J. Nutr., 2013, 52, 1743–1753 CrossRef CAS PubMed.
- K. Kawano, T. Hirashima, S. Mori, Y. Saito, M. Kurosumi and T. Natori, Diabetes, 1992, 41, 1422–1428 CrossRef CAS PubMed.
- S. M. Rahman, Y. M. Wang, H. Yotsumoto, J. Y. Cha, S. Y. Han, S. Inoue and T. Yanagita, Nutrition, 2001, 17, 385–390 CrossRef CAS PubMed.
- S. Takiguchi, Y. Takata, A. Funakoshi, K. Miyasaka, K. Kataoka, Y. Fujimura, T. Goto and A. Kono, Gene, 1997, 197, 169–175 CrossRef CAS PubMed.
- T. H. Moran, L. F. Katz, C. R. Plata-Salaman and G. J. Schwartz, Am. J. Physiol., 1998, 274, 618–625 Search PubMed.
- Y. Nakaya, A. Minami, N. Harada, S. Sakamoto, Y. Niwa and M. Ohnaka, Am. J. Clin. Nutr., 2000, 71, 54–58 CAS.
- J. Folch, M. Lees and G. H. Sloane-Stanley, J. Biol. Chem., 1957, 226, 497–509 CAS.
- M. J. Fletcher, Clin. Chim. Acta, 1987, 22, 393–397 CrossRef.
- M. Kitamura, Clin. Biochem. Anal., 1968, 3, 72–78 Search PubMed.
- Z. W. Man, M. Zhu, Y. Noma, K. Toide, T. Sato, Y. Asahi, T. Hirashima, S. Mori, K. Kawano, A. Mizuno, T. Sano and K. Shima, Diabetes, 1997, 46, 1718–1724 CrossRef CAS PubMed.
- E. Chang, L. Kim, S. E. Park, E. J. Rhee, W. Y. Lee, K. W. Oh, S. W. Park and C. Y. Park, World J. Gastroenterol., 2015, 21, 7754–7763 CrossRef CAS PubMed.
- D. El Khoury, C. Cuda, B. L. Luhovyy and G. H. Anderson, J. Nutr. Metab., 2012, 851362 CAS.
- Y. Zhang, L. Xia, W. Pang, T. Wang, P. Chen, B. Zhu and J. Zhang, Br. J. Nutr., 2013, 28, 254–262 CrossRef PubMed.
- S. D. Udayappan, A. V. Hartstra, G. M. Dallinga-Thie and M. Nieuwdorp, Clin. Exp. Immunol., 2014, 177, 24–29 CrossRef CAS PubMed.
- R. L. Shen, X. Y. Dang, J. L. Dong and X. Z. Hu, J. Agric. Food Chem., 2012, 14, 11301–11308 CrossRef PubMed.
- Y. Wang, N. P. Ames, H. M. Tun, S. M. Tosh, P. J. Jones and E. Khafipour, Front. Microbiol., 20167129 Search PubMed.
- Y. J. Song, M. Sawamura, K. Ikeda, S. Igawa and Y. Yamori, Clin. Exp. Pharmacol. Physiol., 2000, 27, 41–45 CrossRef CAS PubMed.
- K. S. Park, T. P. Ciaraldi, K. Lindgren, L. Abrams-Carter, S. Mudaliar, S. E. Nikoulina, S. R. Tufuri, J. H. Veerkamp, A. Vidal-Puid and R. R. Henrt, J. Clin. Endocrinol. Metab., 1998, 83, 2830–2835 CAS.
| This journal is © The Royal Society of Chemistry 2016 |