 Open Access Article
Bioavailability, rheology and sensory evaluation of fat-free yogurt enriched with VD3 encapsulated in re-assembled casein micelles
Yonatan
Levinson
a,
Sophia
Ish-Shalom
bc,
Elena
Segal
b and
Yoav D.
Livney
 *a
*a
aBiotechnology and Food Engineering Department, The Technion, Israel Institute of Technology, Haifa, 3200000, Israel. E-mail: livney@technion.ac.il; Fax: +972-4-8293399; Tel: +972-4-8294225
bBone & Mineral Metabolism Unit, Rambam Health Campus, Haifa, 3525408, Israel
cFaculty of Medicine, The Technion, Israel Institute of Technology, Haifa, 3525406, Israel
First published on 1st February 2016
Abstract
Vitamin D3 (VD3) deficiency is a global problem. Better ways are needed to enrich foods with this important nutraceutical. VD3 is fat-soluble, hence requiring a suitable vehicle for enriching nonfat foods. Our objectives were to assess the bioavailability of VD3, from fat-free yogurt, in re-assembled casein micelles (rCMs) compared to that in polysorbate-80 (PS80/Tween-80) a commonly used synthetic emulsifier, and to assess and compare their rheology and palatability. We enriched fat-free yogurt with VD3 loaded into either rCM (VD3-rCMs) or PS80 (VD3-PS80). In vivo VD3 bioavailability was evaluated by a large randomized, double blind, placebo-controlled clinical trial, measuring serum 25(OH)D increase in subjects who consumed fat-free yogurt with 50![[thin space (1/6-em)]](https://www.rsc.org/images/entities/char_2009.gif) 000 IU of either VD3-rCM, VD3-PS80, or VD3-free placebo yogurt. Both VD3-rCM and VD3-PS80 increased the serum 25(OH)D levels by ∼8 ng ml−1 and no significant differences in mean 25(OH)D levels were observed, evidencing the fact that VD3 bioavailability in rCM was as high as that in the synthetic emulsifier. VD3-rCM yogurt had a higher viscosity than VD3-PS80 yogurt. In sensory evaluations, panelists were able to discern between VD3-rCM and VD3-PS80 yogurt, and showed a dislike for PS80 yogurt, compared to rCM or the unenriched control. These results complement our past results showing higher protection against thermal treatment, UV irradiation, and deterioration during shelf life, conferred to hydrophobic nutraceuticals by rCM compared to that by the synthetic surfactant or to the unprotected bioactive, in showing the advantageous use of rCM over the synthetic emulsifier as a delivery system for the enrichment of food with VD3 and other hydrophobic nutraceuticals.
000 IU of either VD3-rCM, VD3-PS80, or VD3-free placebo yogurt. Both VD3-rCM and VD3-PS80 increased the serum 25(OH)D levels by ∼8 ng ml−1 and no significant differences in mean 25(OH)D levels were observed, evidencing the fact that VD3 bioavailability in rCM was as high as that in the synthetic emulsifier. VD3-rCM yogurt had a higher viscosity than VD3-PS80 yogurt. In sensory evaluations, panelists were able to discern between VD3-rCM and VD3-PS80 yogurt, and showed a dislike for PS80 yogurt, compared to rCM or the unenriched control. These results complement our past results showing higher protection against thermal treatment, UV irradiation, and deterioration during shelf life, conferred to hydrophobic nutraceuticals by rCM compared to that by the synthetic surfactant or to the unprotected bioactive, in showing the advantageous use of rCM over the synthetic emulsifier as a delivery system for the enrichment of food with VD3 and other hydrophobic nutraceuticals.
Introduction
There are about one billion people worldwide who are either deficient in (serum 25(OH)D concentrations below 20 ng ml−1) or have insufficient (20–30 ng ml−1) vitamin D (VD) status,1 a problem which can be addressed by fortifying foods with VD. After consumption, the liver converts VD3 to 25(OH)D, or calcidiol, the inactive, but main circulating form of VD. Calcidiol is converted to the active calcitriol [1,25(OH)2D] in the kidneys, from which point it regulates the body's calcium levels.2,3 Having sufficient VD has been associated with a lower risk of other diseases, such as cancer,4,5 type 1 diabetes6 and cardiovascular disease.7 However, fortifying foods with VD3 can be difficult due to its high hydrophobicity,8 and susceptibility to degradation by low pH,9 UV10 and oxidation.11 Previous studies by our group have shown that in aqueous foods and beverages, unprotected VD3 undergoes thermal degradation,12 particularly at low pH.13 Re-assembled casein micelles (rCMs) can solubilize VD3 in a fat-free food system and protect it from degradation throughout production, shelf life and digestion (VD is very sensitive to stomach acidity).14 Casein micelles have evolved to form a gel in the stomach, and then be slowly digested. Consequently they would protect and slowly release the encapsulated VD3 for intestinal absorption.RCMs closely resemble the structure and function of natural casein micelles:10,12 clusters of casein proteins self-assembled by hydrophobic interactions and bridged together by calcium phosphate nanoclusters. Hydrophobic nutraceutical (HN)-loaded rCMs are formed by adding an ethanolic solution of the HN into the caseinate solution while stirring, thereby inducing the co-assembly of the casein with the vitamin, followed by adding phosphate, citrate, and calcium salts, resulting in bridging and aggregation of the primary micellar assemblies into VD3-loaded rCM with an average size of ∼150 nm.10,12 Because casein molecules are amphiphilic, the rCM has hydrophobic sites in its core, and can be used as a delivery vehicle for HNs such as fat soluble vitamins, fatty acids, and carotenoids. Specifically, we have previously loaded rCMs with vitamin D2,15 VD312 and docosahexaenoic acid (DHA),16 nutrients whose addition to food products is highly desirable, but may ordinarily be complicated because of their hydrophobicity and susceptibility to environmental stresses. In the rCMs, however, we have found that encapsulated HNs are significantly protected from UV light,15 thermal treatment12 and from oxidative damage during shelf life.12,16 rCMs have also been loaded with curcumin,17,18 a natural compound whose efficacy against leukemia cells was reportedly increased when delivered via rCM.18 In other studies casein micelles were loaded with EGCG.19,20 All of these studies substantiate the great potential of using casein micelles as natural vehicles for delivering HNs in functional food products.
Recent health trends favor the consumption of nonfat and low fat foods, especially dairy products. Thus, it is important to provide efficient tools for VD fortification of these products. Previously, we have loaded rCMs with VD3, used them to fortify 1% milk, and conducted a human clinical trial to study the in vivo bioavailability of VD3 in the milk,21 compared to a commercial aqueous supplement based on PS80. The results indicated that bioavailability in rCMs was not lower than that in the aqueous VD3 supplement. However, we wished to examine VD3-rCM enrichment in a nonfat product (and 0% fat yoghurt is the most common nonfat dairy product on the market) and to compare the bioavailability and sensory properties to the same product enriched with PS80, the synthetic emulsifier commonly used for the task.
Therefore, the aims of this study were:
1. To assess VD3 bioavailability from fat free yogurt enriched with VD3-rCMs compared to VD3-PS80.
2. To assess the differences in rheology and sensory properties between yogurts fortified with VD3-rCMs compared to VD3-PS80.
Materials and methods
Materials
Cholecalciferol (VD3) (C1357) was obtained from Sigma-Aldrich (Rehovot, Israel). PS80 was obtained from Frutarom (Haifa, Israel). Sodium caseinate (Casinella QN, lot number 901155) was kindly donated by Kelta Ltd, Israel on behalf of Molkerei Meggle Wasserburg GmbH & CO. KG Germany. Skim milk powder was obtained from Tnuva Ltd, Israel and thermophilic lactic culture for direct vat set yogurt (ST M5, batch number 3094560) was kindly donated by Hirshberg Brothers & Co. Chemicals Ltd, Israel, on behalf of Chr. Hansen, Denmark.Methods
The VD3-rCM solution was then homogenized using a Micro DeBee ultra-high pressure homogenizer (Bee Int'l Inc., South Easton, MA, USA). The solution was passed once through an orifice of 0.15 mm, with an average process pressure of 21 kpsi.
![[thin space (1/6-em)]](https://www.rsc.org/images/entities/char_2009.gif) :
:![[thin space (1/6-em)]](https://www.rsc.org/images/entities/char_2009.gif) 1 w/w ratio of polysorbate 80
1 w/w ratio of polysorbate 80![[thin space (1/6-em)]](https://www.rsc.org/images/entities/char_2009.gif) :
:![[thin space (1/6-em)]](https://www.rsc.org/images/entities/char_2009.gif) VD3. This ratio was based on previous experiments22 which showed that the particle size decreased with increasing ratio, and reached just below 10 nm at this ratio, while higher ratios did not result in lower sizes. Both VD3-PS80 and VD3-rCM solutions were stored at 4 °C for up to 24 hours prior to use.
VD3. This ratio was based on previous experiments22 which showed that the particle size decreased with increasing ratio, and reached just below 10 nm at this ratio, while higher ratios did not result in lower sizes. Both VD3-PS80 and VD3-rCM solutions were stored at 4 °C for up to 24 hours prior to use.
The following day, the 2 L jugs of milk were placed in warm incubators and periodically shaken until their contents reached approximately 37 °C, at which point they were inoculated with 0.17 g dried yogurt starter culture for every 1 kg of milk, and shaken gently to distribute the starter. The jugs were then incubated quiescently at 40 °C for 4.5 hours, after which they were removed from the incubator, vigorously shaken to break up the curd, and stored at 4 °C. One to seven days prior to ingestion, yogurt was poured from the jugs into sterile plastic cups, weighed to obtain 150 g portions, wrapped in aluminum foil, and stored at 4 °C.
Overall, there were 4 production days, and on each production day all three yogurt types (rCM, PS80, and placebo) were produced.
![[thin space (1/6-em)]](https://www.rsc.org/images/entities/char_2009.gif) 000 cfu per cc, and coliform counts of <1 per g, and all yogurt samples had coliform, yeast and mold counts of <1 per g, in compliance with Israeli Standard 285.
000 cfu per cc, and coliform counts of <1 per g, and all yogurt samples had coliform, yeast and mold counts of <1 per g, in compliance with Israeli Standard 285.
Experimental design
All subjects who met the eligibility criteria underwent a laboratory screening of: serum calcium, phosphate, creatinine, albumin and plasma PTH, CBC, ESR, and 25-hydroxyvitamin D [25(OH)D]. This last measurement was used to establish the baseline [25(OH)D] level for each individual.Within a week after screening, each individual was given a 150 g cup of yogurt to ingest in its entirety. The subjects were instructed to fast overnight/8 hours prior to ingestion, and 2 more hours post ingestion. Each yogurt cup had been covered in foil and labeled with a unique, randomly generated four digit number. On any given day, the nursing staff was given a group of labeled cups among which there were equal numbers of rCM, PS80 and placebo yogurt. They chose a random cup to give to each individual, and recorded the four digit code. This was to avoid conflating the effects of experimental block (a particular day) and yogurt type. The yogurt consumption date was labeled day 0, and participants then returned on days 1, 7, and 14 to have their blood samples taken. Serum [25(OH)D] levels were determined by a chemiluminescence immunoassay (CLIA), DiaSorin LIAISON (DiaSorin, Inc., Stillwater, Minnesota), in the Endocrine Laboratory in Rambam Health Care Campus. All samples of each participant were tested on the same kit, to avoid inter-assay variation.
Statistical analysis
Delta 25(OH)D levels were calculated by subtracting each individual's baseline serum 25(OH)D level from all measurements following yogurt consumption. Each data point then underwent a log(Δ25(OH)D + 10) transformation; the logarithmic transformation was necessary to meet ANOVA requirements regarding normality of residuals, with the +10 offset to correct for negative delta values and to anchor scores above 1.0. Two-way mixed-model (repeated measures with subjects as a random factor) ANOVA with fixed factors, yogurt type, day, and their interaction were used to assess time related changes in the log-transformed 25(OH)D levels. Tukey–Kramer post hoc tests were employed to examine significant pairwise differences as appropriate. SAS (SAS Institute, Cary, NC) was employed for statistical analyses.Yogurt rheology
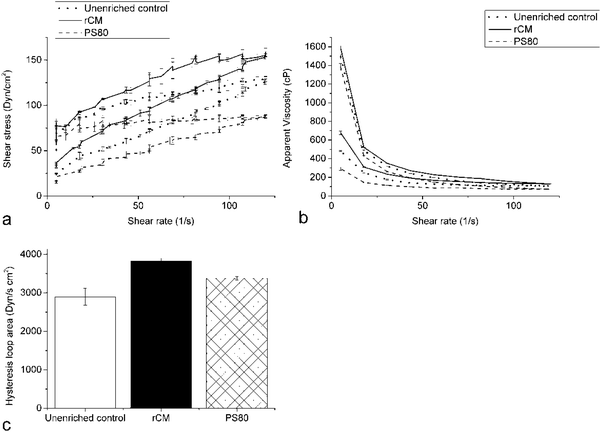
Ten ml yogurt samples were measured using a Brookfield DV2 T viscometer (Middleboro, MA, USA), with a bob and cup setup (spindle SC4–21) at a fixed temperature of 10 °C. A shear rate sweep was performed from 5 to 120 s−1, and then back down to 5 s−1. Shear stress was measured in Dyn cm−2, and apparent viscosity (in cP) was calculated as the ratio of the shear stress and the shear rate. Hysteresis was quantified by integrating the area between the upward and downward shear sweeps on the shear stress/shear rate curve. Samples were measured in duplicate.Sensory evaluation
Two sensory evaluation tests were performed. The first was a triangle test, to evaluate whether panelists could discriminate between VD3-rCM and VD3-PS80 yogurt. Each panelist received 3 teaspoons of yogurt, (two of one type, and one of the other), and was asked to select the sample which was different from the other two. The distribution of yogurt types and order of consumption was randomized. The second test was a preference test, in which each panelist received 3 small cups (∼15 g) of yogurt, containing VD3-rCM, VD3-PS80, and un-enriched control yogurt in a random order. The panelists were asked to taste all three yogurts, and assign each a numerical score with 1 being “bad tasting” and 10 being “good tasting”. Finally, they were asked to rank the 3 yogurts in order of preference.Results and discussion
VD3-RCM and VD3-PS80 particle size distribution
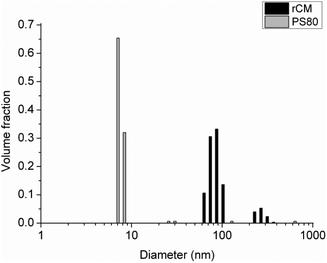
The homogenized VD3-rCMs displayed a bimodal particle size distribution with a majority of micelles distributed about a mean diameter of 89 nm and a smaller population of larger micelles distributed about a mean diameter of 277 nm, while the VD3-PS80 micelles were all narrowly distributed about a mean diameter of 7 nm (Fig. 1). This is consistent with our previous findings.21,22Yogurt VD3 content during cold storage
We have followed the changes in VD3 content over a three-week storage period at 4 °C for VD3-rCM and VD3-PS80 yogurt. Overall, the differences in vitamin content between the two enrichment methods, and with storage time were insignificant (p > 0.05) (results not shown).Although our experiment was designed to deliver 50![[thin space (1/6-em)]](https://www.rsc.org/images/entities/char_2009.gif) 000 IU of VD3 to each individual in the bioavailability study, the actual yogurt VD3 content varied slightly by production day, encapsulation method, and storage time. To correct for this very small variation, we averaged the measured VD3 concentrations for each production day and yogurt type, yielding eight values ranging from 47
000 IU of VD3 to each individual in the bioavailability study, the actual yogurt VD3 content varied slightly by production day, encapsulation method, and storage time. To correct for this very small variation, we averaged the measured VD3 concentrations for each production day and yogurt type, yielding eight values ranging from 47![[thin space (1/6-em)]](https://www.rsc.org/images/entities/char_2009.gif) 000 to 55
000 to 55![[thin space (1/6-em)]](https://www.rsc.org/images/entities/char_2009.gif) 000 IU. Each value was then divided by 51
000 IU. Each value was then divided by 51![[thin space (1/6-em)]](https://www.rsc.org/images/entities/char_2009.gif) 417 IU, the average of all eight, to yield a dimensionless correction factor. Each participant's serum 25(OH)D level was then divided by this factor to account for the relative quantity of VD3 consumed.
417 IU, the average of all eight, to yield a dimensionless correction factor. Each participant's serum 25(OH)D level was then divided by this factor to account for the relative quantity of VD3 consumed.
VD3 bioavailability
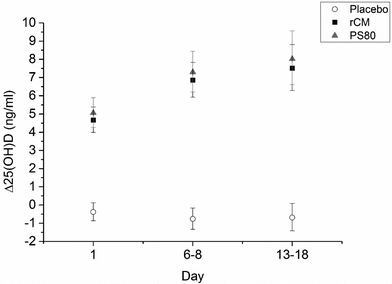
Mean serum Δ25(OH)D (ng ml−1) levels were plotted as a function of time (Fig. 2). The average baseline (day 0) 25(OH)D levels were as follows: 16.3 ng ml−1 for the placebo group, 17.1 ng ml−1 for the rCM group, and 15.5 ng ml−1 for the PS80 group. As expected, those individuals who consumed placebo yogurt showed no increase in serum 25(OH)D, while those who consumed VD3-rCM and VD3-PS80 yogurt showed increases of ∼8 ng ml−1 25(OH)D after two weeks. There was no significant difference (p ≫ 0.05) between mean Δ25(OH)D in individuals who consumed rCM yogurt versus PS80, at any of the time points. Thus, we conclude that the in vivo bioavailability in humans of VD3 encapsulated in rCM, added in the production of a nonfat yoghurt, is at least as good as that in the synthetic emulsifier, PS80 (Tween 80). In both forms, serum [25(OH)D] levels increased by an average of ∼8 ng ml−1 within two weeks after an administered dose of 50![[thin space (1/6-em)]](https://www.rsc.org/images/entities/char_2009.gif) 000 IU VD3. This is in line with our previous study, where 1% fat milk was enriched with rCM, and compared to a PS80 – stabilized aqueous commercial VD preparation.12 So far these are the only two studies reporting the bioavailability of vitamin D (and apparently any vitamin or nutraceutical) encapsulated in casein or in casein micelles, in humans. Zittermann et al., conducted a meta-analysis of 14 studies (65
000 IU VD3. This is in line with our previous study, where 1% fat milk was enriched with rCM, and compared to a PS80 – stabilized aqueous commercial VD preparation.12 So far these are the only two studies reporting the bioavailability of vitamin D (and apparently any vitamin or nutraceutical) encapsulated in casein or in casein micelles, in humans. Zittermann et al., conducted a meta-analysis of 14 studies (65![[thin space (1/6-em)]](https://www.rsc.org/images/entities/char_2009.gif) 548 total individuals) in which they estimated the overall change in relative mortality risk as a function of increase in serum [25(OH)D] concentration.23 According to their best-fit model, an increase of 8 ng ml−1 from baseline corresponds to a 20% reduction in mortality risk, assuming an average baseline concentration of 11 ng ml−1.
548 total individuals) in which they estimated the overall change in relative mortality risk as a function of increase in serum [25(OH)D] concentration.23 According to their best-fit model, an increase of 8 ng ml−1 from baseline corresponds to a 20% reduction in mortality risk, assuming an average baseline concentration of 11 ng ml−1.
Yogurt rheology
All yogurt samples expectedly exhibited pseudoplastic (shear-thinning) behavior; as the shear rate increased, the apparent viscosity decreased (Fig. 3b). The VD3-rCM yogurt had the highest apparent viscosity over all shear rates, while the VD3-PS80 yogurt had the lowest. Additionally, the rCM yogurt had the smallest hysteresis loop area, the PS80 yogurt had a larger area, and the unenriched control yogurt had the largest (Fig. 3c). The area of a yogurt sample's hysteresis loop is inversely proportional to its ability to rebuild its gel structure after undergoing shear. These results suggest that rCMs slightly improve both the viscosity and gel-rebuilding ability of yogurt. This is most likely due to the participation of the rCMs in the formation of the milk casein network. The PS80, on the contrary, decreased the yogurt viscosity, possibly suggesting disruptive interactions between PS80 and the casein network. The increase in viscosity due to the addition of rCM was an extra value added effect. It was most probably due to the slight increase in the total protein content, as the addition of micellar casein under constant total protein content has been reported to result in similar viscosity and storage modulus compared to yoghurt enriched with skim milk powder and relatively low compared to yoghurt enriched with sodium caseinate.24 | ||
| Fig. 3 (a) Shear stress vs. shear rate (b) apparent viscosity vs. shear rate (c) hysteresis loop area. | ||
Sensory evaluation
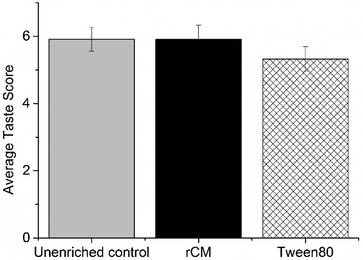
In the triangle test, out of 34 panelists, 16 correctly identified the different samples, which meant that the subjects were able to discriminate between the two yogurt types (p = 0.06). In the preference test, there was no significant difference between the scores of all three yogurt types (Fig. 4). In order to evaluate the ranking data, the methodology of Newell and MacFarlane25 was used. We recorded the number of times each yogurt type was ranked 1, 2 or 3 (a, b, and c, accordingly), and then calculated the absolute rank sum as (1*a + 2*b + 3*c), i.e. the larger the absolute rank sum, the lower the quality-ranking. The results are shown in Table 1. For 34 panelists and 3 yogurt types, a critical rank sum difference of 20 was necessary to establish a significant difference in preference (significance level of α = 0.05).25 Thus, we see that panelists exhibited a significant dislike for VD3-PS80 yogurt, compared to VD3-rCM or the unenriched control yogurt.| (Best) | (Worst) | |||
|---|---|---|---|---|
| 1 | 2 | 3 | Absolute rank number | |
| rCM | 15 | 12 | 7 | 60 |
| PS80 | 7 | 6 | 21 | 82 |
| Unenriched control | 12 | 16 | 6 | 62 |
Our findings that VD3-rCMs both successfully delivered VD3 and improved yogurt rheology while not affecting the taste, illustrate the utility of rCMs for creating fortified yogurt with a pleasant taste and texture – that are especially critical for fat-free yogurt.
Conclusions
In fat-free yogurt, the bioavailability of VD3 in rCMs was not lower than that in the synthetic surfactant, PS80, although PS80 micelles are smaller in diameter. In addition, VD3-rCM yogurt had a higher overall apparent viscosity, and was preferred in a sensory evaluation, compared to VD3-PS80 enriched yogurt. These results complement our previous findings12 which show that rCMs confer better protection to VD3 against degradation during heat treatment, and shelf life, compared to PS80. Moreover, the use of rCMs enables an “All-Natural Ingredients” product labeling, while PS80 does not. Taken together these results suggest important advantages of rCMs as a delivery vehicle compared to the currently used synthetic surfactant.Acknowledgements
The study was carried out with the partial support of the Israeli Dairy Board. We are grateful to Ms Aliza Willaume, Ms Marina Hefetz-Kustanovich and Ms Raya Gendelman for their expert technical assistance, to Dr Elliot Sprecher for his professional assistance with the statistical analysis, and to Ravit Edelman, for her help with the graphics.References
- M. F. Holick, N. Engl. J. Med., 2007, 357, 266–281 CrossRef CAS PubMed.
- M. F. Holick, Vitamin D: Physiology, Molecular Biology, and Clinical Applications, Humana Press, 2010 Search PubMed.
- M. F. Holick, Ann. Epidemiol., 2009, 19, 73–78 CrossRef PubMed.
- C. F. Garland, F. C. Garland, E. D. Gorham, M. Lipkin, H. Newmark, S. B. Mohr and M. F. Holick, J. Info., 2006, 96 Search PubMed.
- J. M. Lappe, D. Travers-Gustafson, K. M. Davies, R. R. Recker and R. P. Heaney, Am. J. Clin. Nutr., 2007, 85, 1586–1591 CAS.
- E. Hyppönen, E. Läärä, A. Reunanen, M.-R. Järvelin and S. M. Virtanen, Lancet, 2001, 358, 1500–1503 CrossRef.
- J. Parker, O. Hashmi, D. Dutton, A. Mavrodaris, S. Stranges, N.-B. Kandala, A. Clarke and O. H. Franco, Maturitas, 2010, 65, 225–236 CrossRef CAS PubMed.
- T. Loftsson and D. Hreinsdôttir, AAPS PharmSciTech, 2006, 7, 29–32 CrossRef PubMed.
- G. Markman and Y. D. Livney, Food Funct., 2012, 3, 262–270 CAS.
- E. Semo, E. Kesselman, D. Danino and Y. D. Livney, Food Hydrocolloids, 2007, 21, 936–942 CrossRef CAS.
- E. Deritter, J. Pharm. Sci., 1982, 71, 1073–1096 CrossRef CAS PubMed.
- M. Haham, S. Ish-Shalom, M. Nodelman, I. Duek, E. Segal, M. Kustanovich and Y. D. Livney, Food Funct., 2012, 3, 737–744 CAS.
- Y. Levinson, G. Israeli-Lev and Y. Livney, Food Biophys., 2014, 9, 332–340 CrossRef.
- G. Markman and Y. D. Livney, presented in part at the International Congress on Engineering and Food (ICEF11), Athens, Greece, May 22–26, 2011, 2011.
- E. Semo, E. Kesselman, D. Danino and Y. D. Livney, Food Hydrocolloids, 2007, 21, 936–942 CrossRef CAS.
- P. Zimet, D. Rosenberg and Y. D. Livney, Food Hydrocolloids, 2011, 25, 1270–1276 CrossRef CAS.
- A. Sahu, N. Kasoju and U. Bora, Biomacromolecules, 2008, 9, 2905–2912 CrossRef CAS PubMed.
- M. Esmaili, S. M. Ghaffari, Z. Moosavi-Movahedi, M. S. Atri, A. Sharifizadeh, M. Farhadi, R. Yousefi, J.-M. Chobert, T. Haertlé and A. A. Moosavi-Movahedi, LWT–Food Sci. Technol., 2011, 44, 2166–2172 CrossRef CAS.
- İ. Gülseren, A. Guri and M. Corredig, Food Dig., 2012, 3, 36–45 CrossRef.
- A. Shukla, T. Narayanan and D. Zanchi, Soft Matter, 2009, 5, 2884 RSC.
- M. Haham, S. Ish-Shalom, M. Nodelman, I. Duek, E. Segal, M. Kustanovich and Y. D. Livney, Food Funct., 2012, 3, 737–744 CAS.
- M. Haham, M.Sc., Technion, Israel Institute of Technology, 2011.
- A. Zittermann, S. Iodice, S. Pilz, W. B. Grant, V. Bagnardi and S. Gandini, Am. J. Clin. Nutr., 2012, 95, 91–100 CrossRef CAS PubMed.
- Y. Peng, M. Serra, D. S. Horne and J. A. Lucey, J. Food Sci., 2009, 74, C666–C673 CrossRef CAS PubMed.
- G. Newell and J. MacFarlane, J. Food Sci., 1987, 52, 1721–1725 CrossRef.
| This journal is © The Royal Society of Chemistry 2016 |


