Polysaccharide from Pleurotus nebrodensis induces apoptosis via a mitochondrial pathway in HepG2 cells†
Haiyan
Cui
,
Shufen
Wu
,
Yanping
Sun
,
Tiantian
Wang
,
Zhenjing
Li
,
Mianhua
Chen
and
Changlu
Wang
*
Key Laboratory of Food Nutrition and Safety, Ministry of Education, School of Food Engineering and Biotechnology, Tianjin University of Science and Technology, Tianjin 300457, PR China. E-mail: clw123@tust.edu.cn; Fax: +86 22-6027-2219; Tel: +86 22-6027-2219
First published on 29th September 2015
Abstract
A novel alkali extractable polysaccharide (designated as PNA-2) was purified from Pleurotus nebrodensis and the effects of purified PNA-2 on the proliferation and apoptosis of human hepatic cancer cells (HepG2) were investigated in this study. The results of a 3-(4,5-dimethylthiazol-2-yl)-2,5-diphenyltetrazolium bromide (MTT) assay indicated that PNA-2 inhibited the proliferation of HepG2 cells by apoptosis induction, which was also characterized using scanning electron microscopy (SEM). Moreover, the expression of apoptosis-associated mRNA, proteins and the cell-cycle arrest at the G0/G1 phase was determined using RT-qPCR, Western blot and flow cytometry, respectively. A notable inhibition of the migration rate of PNA-2-treated HepG2 cells was observed using a cell scratch assay. DNA damage was observed using a comet assay and AO/EB staining in HepG2 cells, which were exposed to PNA-2. Induction of the mitochondria-mediated intrinsic apoptotic pathway by PNA-2 was indicated by the loss of mitochondrial membrane potential (ΔΨm), Bcl-2 dysregulation and cytochrome c release. All the results suggested that the mitochondria-mediated intrinsic apoptotic pathway could be involved in PNA-2-mediated apoptosis of human liver carcinoma cells HepG2. Finally, the results indicated that PNA-2 significantly suppressed tumor growth in HepG2 tumor-bearing mice, indicating that PNA-2 may be developed as a candidate drug or functional food factor to prevent or treat liver cancer.
1. Introduction
Malignancy, particularly hepatocellular carcinoma (HCC), has become one of the most life-threatening diseases in recent years. Chemotherapy, as one of the cancer therapeutic methods, possesses some side effects, despite significant advances in this treatment.1 Therefore, treatments targeting apoptosis in cancer are potential alternatives, which have been paid more and more attention.2 Polysaccharides, as natural compounds, have been used to enhance therapeutic efficacy through the induction of apoptosis in cancer cells without killing normal cells.3Apoptosis is considered a regulated active process defined by specific biochemical and morphological changes, during which individual cells undergo systematic self-destruction in response to various stimuli.4 There may be several mechanisms for drug-induced apoptosis, and one of the most pivotal pathways in cells is the mitochondrial pathway,5 which is also important for polysaccharide-induced apoptosis in cancer cells.6 A potential antitumor polysaccharide (LSPc1) has been purified from the fruiting bodies of Lepista sordida and was proven to induce cancer apoptosis through the mitochondrial pathway.7 Atractylodes macrocephala polysaccharides (AMPs) have also been proved to induce apoptosis in glioma C6 cells via the mitochondrial pathway.8
Polysaccharides could be obtained from various organisms, such as algae, plants, microorganisms and animals.9 Several reports have confirmed that polysaccharides, especially those extracted from fungi, exhibited various biological activities.10–12 It is noted that the activity of proliferation suppression and apoptosis of tumor cells has been extensively studied.13,14
This work focuses on the apoptotic effects of PNA-2 (see ESI†) on HepG2 cells. PNA-2 was proven to inhibit cell proliferation, induce cell-cycle arrest, activate the mitochondria-dependent apoptotic pathway, and block the migration as well as invasion of HepG2 cells. Furthermore, an inhibition of Bcl-2, activation of cytochrome c and a decrease of the mitochondrial membrane potential induced by PNA-2 contributed to the apoptotic-inducing effect on HepG2 cells. The apoptotic pathway may play an important role in the inhibition of tumor growth in vivo. Taken together, our findings indicate that PNA-2 triggers apoptosis in HepG2 cells through the mitochondria-dependent apoptotic pathway, dramatically inhibiting tumor growth, and may become a potential antitumor compound for liver cancer therapy.
2. Methods
2.1 Materials and reagents
PNA-2 was obtained as described in the ESI.† Dulbecco's Modified Eagle's Medium (DMEM) with a high glucose concentration was purchased from Hyclone (Beijing, China). Fetal bovine serum (FBS) was obtained from Gibco GRL (Grand Island, NY, USA). The penicillin–streptomycin solution, trypsin, phosphate buffered saline (PBS, pH = 7.3), dimethyl sulfoxide (DMSO), 3-(4,5-dimethylthiazol-2-yl)-2,5-diphenyltertrazolium bromide (MTT), low-melting point agarose, normal-melting point agarose, and cell lysis solution were purchased from Solarbio (Beijing, China). Propidium iodide (PI), Rhodamine 123, and AO/EB were purchased from Sigma-Aldrich (St. Louis, MO, USA). The RNeasy Mini Kit was purchased from Qiagen (Hilden, Germany). The PrimeScript 1st Strand cDNA Synthesis Kit was obtained from Takara Bio (Dalian, China). The SYBR Green PCR master mix was purchased from Invitrogen (Shanghai, China). Antibodies against CYT, Bcl-2, Bax, α-tubulin,VDAC1, and β-actin and fluorescent secondary antibodies labeled with FITC were purchased from Abcam (Shanghai, China). Polyvinylidene fluoride (PVDF) was purchased from Millipore (Shanghai, China). All chemicals and other reagents were of analytical grade.2.2 Cells and animals
HepG2 cells, a human hepatic cancer cell line, were obtained from the Bioresource Collection and Research Center of the Food Industry Research and Development Institute (Hsinchu, Taiwan, ROC).BALB/cAnN-nu mice at 4 to 6 weeks of age (female, 18–22 g) were provided by Beijing Vital River Biotechnology Company (SPF certificate: no. SCXK (jing) 2013-0012, Beijing, China). The animals were kept according to the Guide for the Care and Use of Laboratory Animals (NRC 2011) and all experimental protocols were in accordance with Tianjin University of Science and Technology Medical College Animal Care Review Committee guidelines. The orthotopic inoculation protocol was approved by the committee on the use of live animals in teaching and research.
2.3 Cell culture
HepG2 cells were cultured in DMEM supplemented with 10% (v/v) fetal bovine serum and 1× penicillin/streptomycin (100 U mL−1 P and 0.1 mg mL−1 S), in a humidified atmosphere of 5% CO2/95% air at 37 °C. After the cells were grown to 90% confluency in T25 tissue culture flasks (TPP Biochrom AG, Trasadingen, Switzerland), they were plated at a desirable density for further assay. The plate was incubated at 37 °C overnight to allow for cell attachment to the bottom. After the cell supernatant was removed, an aliquot with an equal volume of test sample was added to the well.2.4 Assessment of cell viability
The cell viability of HepG2 cells treated with PNA-2 at different concentrations (0, 6.25, 12.5, 62.5, 125, 250 and 500 μg mL−1) was measured using the MTT assay according to Lee et al.15 with some modifications. HepG2 cells (8 × 10⁴ cells per mL, 100 μL per well) treated with and without PNA-2 were cultured in 96-well plates for 48 h. Then 20 μL of 5 mg mL−1 MTT dissolved in PBS was added to each well and incubated for another 4 h. After the culture medium was discarded, 150 μL of DMSO was added to each well and the plate oscillated for 15 min to dissolve the formazan completely. The absorbance was read at 570 nm using an ELISA reader (ASYS Hitech, GmbH, Austria), and the viability was calculated as follows:where A is the average OD value of the wells with untreated cells; B is the average for wells with PNA-2 treated cells; C is the average for wells without cells.
2.5 Invasiveness assay
The cells were seeded at a density of 1 × 10⁵ cells per well in 24-well plates, and allowed to attach overnight. Then the supernatant was removed carefully and the wells were given a sharp smack with a 10 μl pipette tip gently and vertically. Plates were then washed three times with PBS to remove the floating cells. Cells were treated with PNA-2 at concentrations of 0, 12.5, 62.5 and 125 μg mL−1 for 24 h and then examined under a phase-contrast microscope (Olympus, Japan).2.6 Observation of the morphology changes
HepG2 cells (1 × 10⁵ cells per mL) were inoculated on a cover slip, treated with PNA-2 (0, 12.5, 62.5 and 125 μg mL−1) for 24 h, and then pre-fixed with 2.5% glutaraldehyde at 4 °C for 30 min. In order to remove the water thoroughly, the cells were then rinsed with PBS and ethanol in gradient concentrations of 30%, 50%, 70%, 80%, 90%, and 100%, with each rinse lasting 5 min. Finally, the surface morphology of the cells treated with and without PNA-2 was characterized using SEM (Hitachi, Tokyo, Japan).2.7 Acridine orange/ethidium bromide (AO/EB) staining
HepG2 cells treated with PNA-2 (0, 12.5, 62.5 and 125 μg mL−1) were cultured in 24-well plates for 48 h at 37 °C in an atmosphere of 5% CO2. After washing three times with PBS and mixing with 4% paraformaldehyde for 10 min at 4 °C, cells were stained with an AO/EB solution (100 μg mL−1 AO and 100 μg mL−1 EB in PBS) for 30 min at room temperature in the dark. Finally, cells were washed with PBS and observed using an inverted fluorescence microscope (AMG, USA).2.8 Single cell gel electrophoresis assay
The HepG2 cells treated with PNA-2 and those without treatment were plated at a density of 1 × 10⁵ cells per dish and cultured for 48 h. Then the comet assay was conducted according to Tice et al.16 Finally, comets were stained with ethidium bromide (5 μg ml−1) and analyzed using confocal laser scanning microscopy (Nikon, Tokyo, Japan).2.9 Flow cytometric analysis
HepG2 cells (1 × 10⁵ cells per mL) were seeded in T25 tissue culture flasks and exposed to various concentrations of PNA-2 (0, 12.5, 62.5 and 125 μg mL−1). The cells were washed with PBS, collected after trypsinization, and then fixed in 70% glacial ethanol. After washing with PBS three times, cells were resuspended in 1 mL of PBS containing 50 U mL−1 RNase and 50 μg mL−1 propidium iodide (PI), and then incubated for 40 min in the dark at 4 °C. Cell cycle analysis was performed by flow cytometry (BD, Franklin Lakes, NJ, USA) at an excitation wavelength of 488 nm, and the population of cells in each phase was calculated using the Modifit LT software program. Each experiment was carried out three times.2.10 Rhodamine-123 staining
Changes in the mitochondrial membrane potential (ΔΨm) due to mitochondrial dysfunction were detected using rhodamine-123 staining.17 The HepG2 cells in 24-well plates treated with PNA-2 at concentrations of 0, 12.5, 62.5 and 125 μg mL−1 were cultured for 48 h at 37 °C and 5% CO2. After washing three times with PBS and fixing with 4% paraformaldehyde for 10 min at 4 °C, cells were stained with rhodamine-123 (5 μg mL−1) for 30 min at room temperature in the dark. Finally cells were washed with PBS and observed using an inverted fluorescence microscope (AMG, USA).2.11 Measurement of the activities of caspase-9 and caspase-3
An assay was carried out to determine the proteolytic activity of caspase-3 and caspase-9. The HepG2 cells treated with different concentrations of PNA-2 (12.5, 62.5 and 125 μg mL−1) were separately collected. Then the activity of caspase-9 as well as caspase-3 was measured using caspase-3,9 activity kit systems according to the manufacturer's instructions (Beyotime Institute of Biotechnology, Haimen, China). The absorbance was measured using an ELISA reader at 405 nm.2.12 Quantitative real-time PCR
The expression of caspase-3, caspase-9, Bcl-2, Cytochrome C (Cyt C), CD31 and Ki67 in HepG2 cells treated with PNA-2 was analyzed by qRT-PCR. Cells were washed with PBS and lysed using the lysis buffer provided by the kit. Total RNA was extracted using the RNeasy Mini-Kit according to the manufacturer's protocol. First-strand cDNA was synthesized using the PrimeScript1st Strand cDNA Synthesis Kit, with the Oligo dT-Adaptor Primer. Gene expression was monitored by qRT-PCR, carried out using the SYBR Green PCR master mix (Invitrogen). Primers for caspase-3, caspase-9, Bcl-2, Cyt C and actin were designed (Table 1). RT-qPCR was performed using the ABI step one plus system (applied biosystems) followed by a melting curve analysis with the following cycling program: initial activation at 95 °C for 2 min, followed by 48 cycles of denaturation at 95 °C for 15 s, annealing at 55 °C for 30 s, and extension at 72 °C for 15 s.| Gene | Sequence of primers(upstream/downstream) |
|---|---|
| Casp-3 | TGTGAGGCGTTGTAGAAGTT/CGCTTCCATGTATGATCTTTGGT |
| Casp-9 | TGGAGACTCGAGGGAGTCAG/TCGACAACTTTGCTGCTTGC |
| Bcl-2 | GATAACGGAGGCTGGGATGC/TCACTTGTGGCCCAGATAGG |
| Cyt C | CGTTGAAAAGGGAGGCAAGC/TCTCCCCAGATGATGCCTTTG |
| Ki67 | AACCTGCAAAGCGGAACGTG/CATTTGCCAGTTCCTCAGTGTG |
| CD31 | GACGTGCAGTACACGGAAGT/TCTGCTTTCCACGGCATCAG |
| β-Actin | AACTGGAACGGTGAAGGTGA/GTGCAATCAAAGTCCTCGGC |
2.13 Western blot analysis
Whole cell lysates were denatured by boiling in loading buffer (20 mM Tris-HCl, pH 6.8, 10% glycerol, 4% SDS, 100 mM DTT and 0.04% bromophenol blue) for 5 minutes. Each sample (40 μg protein) was loaded onto a 12% SDS polyacrylamide gel followed by electroblotting onto a PVDF membrane. After the blocking of non-specific binding with 5% nonfat milk (prepared in PBS containing 0.1% Tween 20) for 1 h at 37 °C, the membrane was incubated with antibodies against Cyt C, Bcl-2 and β-actin. This was followed by an incubation with a FITC labeled anti-rabbit antibody. Then the protein was detected using an Infrared Imaging System (Odyssey, USA). Densitometry was performed using the software Quantity One.2.14 Antitumor activity in vivo
A mouse model of HepG2 was established by inoculating cells (4 × 10⁷ cells per mL, 100 μL) into the right shoulder of each mouse. After 24 h, the mice were randomly divided into four groups with eight mice in each group. The experimental groups received different PNA-2 dosages of 12.5, 62.5 and 125 mg per kg body weight, respectively, while the control group was administered a 0.9% saline solution. PNA-2 or the saline solution was administered using an intragastric perfusion once daily. The tumor volume was measured from day 15. On the 30th day, the mice were weighed and sacrificed by cervical dislocation. Meanwhile, the tumor was excised and weighed.2.15 Statistical analysis
Each experiment was repeated at least three times. Numerical data are presented as the mean ± SEM. The difference between means was analyzed using a one-way ANOVA. All statistical analyses were performed using SPSS 17.0 software (Chicago, IL, USA). Differences were considered significant if P < 0.05.3. Results
3.1 Cell viability and migration ability of HepG2 cells treated with PNA-2
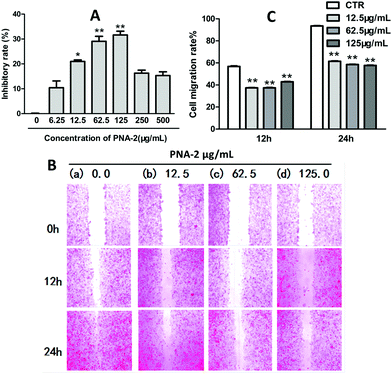
The antitumor activity of PNA-2 was investigated by an in vitro anticancer assay. After HepG2 cells were treated with PNA-2 (0, 6.25, 12.5, 62.5, 125, 250 and 500 μg mL−1) for 48 h, the cell inhibitory rate against cancer cell proliferation was determined. As shown in Fig. 1A, PNA-2 exhibited a significant cytotoxicity at concentrations of 12.5, 62.5 and 125 μg mL−1, and the inhibition rate decreased with reducing or increasing concentrations of PNA-2 at 6.25, 250 and 500 μg mL−1. Therefore, cells were treated with PNA-2 concentrations of 12.5, 62.5 and 125 μg mL−1 for the experiments hereafter.Cell migration is an essential mechanism for various processes in unicellular and multicellular organisms, such as wound healing, immune response and tissue formation,18 which is analyzed by cell scratch assay in vitro.19,20 For the present study, wound closure was examined at 0, 12 and 24 h in the presence of different concentrations of PNA-2 (0, 12.5, 62.5 and 125 μg mL−1). As shown in Fig. 1B, non-treated cells migrated into the scratched area and filled the gap at 24 h, whereas the migration of HepG2 cells treated with PNA-2 was inhibited, especially at concentrations of 62.5 and 125 μg mL−1 for 24 h. The migration rates of HepG2 cells treated with PNA-2 at 12.5, 62.5, and 125 μg mL−1 for 12 h were 39.1%, 38.6%, and 41.3%, respectively, while rates after 24 h were 60.4%, 58.3%, and 57.8% (Fig. 1C). Additionally, these data exhibit a significant difference from the control group (P < 0.01). All the results suggested that the migration ability of HepG2 cells was inhibited by PNA-2 in a dose- and time-dependent manner.
3.2 Morphological changes of HepG2 cells treated with PNA-2
Morphological changes of HepG2 cells treated with and without PNA-2 were characterized by SEM. Fig. 2 shows that the microvilli on the surface of the untreated cells remained intact, whereas typical apoptosis occurred in PNA-2-treated cells displaying phenomenons such as cell shrinkage, membrane blebbing, cytoplasmic vacuolization and so on. Thus PNA-2 indeed induces apoptosis in HepG2 cells.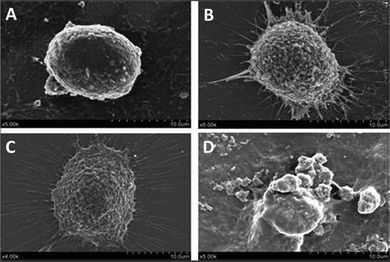 | ||
| Fig. 2 Changes on the cell surface observed using SEM. HepG2 cells were treated with PNA-2 at (A) 0 μg mL−1, (B) 12.5 μg mL−1, (C) 62.5 μg mL−1, and (D) 125 μg mL−1. | ||
3.3 Chromosome condensation and DNA damage of HepG2 cells induced by PNA-2
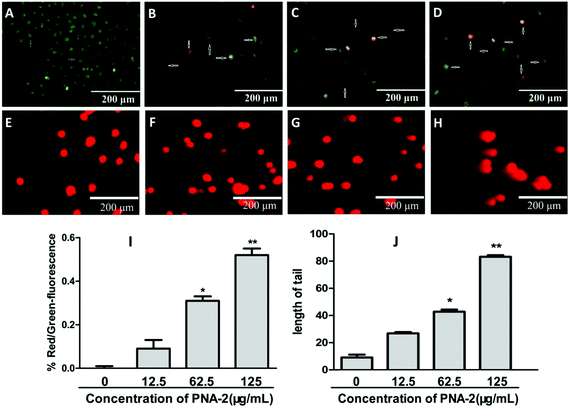
Apoptotic, necrotic and viable HepG2 cells were scored using a fluorescence microscope. A typical image of untreated cells with a green intact nuclear structure is shown in Fig. 3A. After a 48 h treatment with PNA-2 at low doses of 12.5 and 62.5 μg mL−1, cell apoptosis occurred (Fig. 3B and C) with marked nuclear condensation, membrane blebbing, nuclear shrinkage, as well as color changes from green to reddish-orange due to the binding of AO to denatured DNA, which indicates programmed cell death of HepG2 cells induced by PNA-2 (illustrated by arrows). In addition, necrosis was observed by the presence of a red color at a high dose of 125 μg mL−1 (Fig. 3D). The ratios between red and green fluorescence of treated HepG2 cells indicated clearly that PNA-2 had a dose-dependent apoptogenic effect (Fig. 3I).Furthermore, DNA damage was evaluated by the comet assay (or single-cell gel electrophoresis), a sensitivity method for detecting DNA strand breaks in individual cells. Cells treated with PNA-2 at 12.5 μg ml−1 showed some DNA damage with few comet tails, and the comet tail length was significantly extended in those treated with PNA-2 at 62.5 and 125 μg ml−1 (P < 0.05 and P < 0.01, respectively) (Fig. 3E–H).
3.4 G0/G1 arrest in HepG2 cells induced by PNA-2
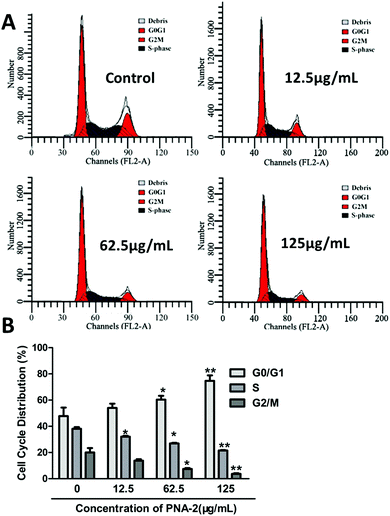
To explore the intrinsic mechanism by which PNA-2 inhibits cell proliferation, flow cytometry was performed on HepG2 cells with or without treatment with PNA-2 for 24 h (Fig. 4A). Compared with untreated cells, a significantly increased percentage of cells in the G0/G1 phase (from 46.36% ± 4.03% to 67.66% ± 3.28%, P < 0.01), along with a dramatically decreased cell population in the S phase (from 34.04% ± 0.29% to 25.94% ± 0.24%, P < 0.01) and the G2/M phase (from 18.91% ± 4.13% to 9.81% ± 0.6%, P < 0.01), were observed in HepG2 cells treated with PNA-2 at 125 μg mL−1 (Fig. 4B). These data suggested that PNA-2 could inhibit cell proliferation by inducing a G0/G1 arrest in a dose-dependent manner in HepG2 cells.3.5 Mitochondria-dependent apoptosis triggered by PNA-2
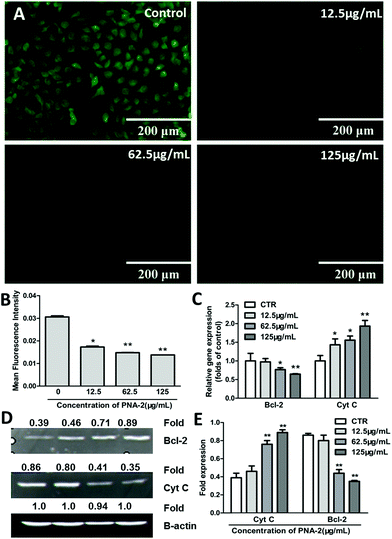
Here, rhodamine-123, a membrane potential-specific dye, was used as a probe to monitor the effects of PNA-2 on mitochondrial function in HepG2 cells. As shown in Fig. 5A, the green fluorescence was significantly reduced in cells exposed to PNA-2 compared with untreated cells. Following treatment with PNA-2 at concentrations of 12.5, 62.5, and 125 μg ml−1, the mean fluorescence intensity of cells significantly decreased (P < 0.05, P < 0.01, P < 0.01, respectively) (Fig. 5B), indicating that PNA-2-induced apoptosis was accompanied by mitochondrial membrane depolarization.Furthermore, the potential mitochondria-dependent signaling molecules involved in the PNA-2-mediated HepG2 cell pro-apoptotic pathway, such as Cyt C and Bcl-2, were investigated. Cyt C mRNA expression was significantly increased in a concentration-dependent manner, while that of the Bcl-2 protein was strongly inhibited by PNA-2 (Fig. 5C). Moreover, a 2.3-fold increase (0.89/0.39 = 2.3, Fig. 5D) and a reduction by 60% (1–0.35/0.86 = 60%, Fig. 5D) in Cyt C and Bcl-2 transcript levels were observed in cells treated with the highest concentration (125 μg mL−1) (Fig. 5E). All the results indicated that the mitochondria-dependent apoptotic pathway participated in PNA-2-induced HepG2 cell death.
3.6 Caspase-dependent apoptosis induced by PNA-2
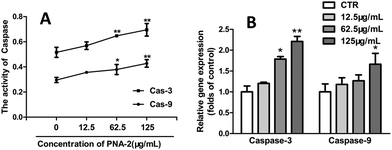
In order to determine whether a caspase-9-dependent pathway was involved in the apoptosis induced by PNA-2, both caspase-3 and caspase-9 were analyzed, for caspase-3, as an apoptosis executioner, is responsible for the degradation of cellular proteins and is activated by caspase-9. Fig. 6A shows that the activities of caspase-9 and caspase-3 in HepG2 cells treated with PNA-2 (concentrations of 62.5 and 125 μg mL−1) for 48 h were significantly increased. Additionally, the gene expression profiles were further confirmed by quantitative fluorescence polymerase chain reaction, and Fig. 6B shows that exposure to various concentrations of PNA-2 results in changes in the expression of mitochondrial caspase-9 and caspase-3, which means that the activation of caspase-9 and caspase-3 indeed participated in PNA-2-induced apoptosis in HepG2 cells.3.7 Growth inhibition of transplantable tumors by PNA-2
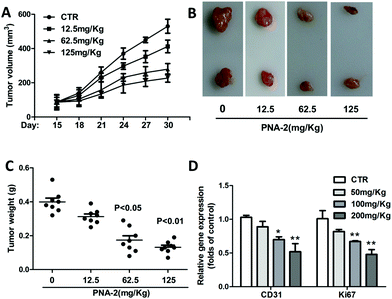
Inoculated with PNA-2 at various concentrations of 12.5, 62.5 and 125 μg mL−1, the tumor volume (Fig. 7A) and tumor weight (Fig. 7C) gradually decreased in tumor-bearing mice. Fig. 7B indicates that PNA-2 could inhibit the tumor growth in vivo more apparently. Moreover, mRNA expression of the angiogenetic factor CD31 as well as the proliferation marker Ki67 were significantly reduced in PNA-2 treated-tumors (Fig. 7D).3.8 Release of cytochrome c and apoptosis-associated protein expression induced by PNA-2
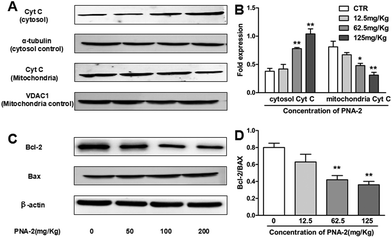
One key characteristic in the intrinsic apoptotic pathway is the liberation of mitochondrial intermembrane proteins into the cytosol, such as cytochrome c, which plays a pivotal role in the activation of the caspase cascade. As shown in Fig. 8A and B, the level of cytosolic cytochrome c protein was dose-dependently upregulated over the test dosage range of PNA-2, while PNA-2 caused a decrease in the protein level of cytochrome c in the mitochondrial fraction at 62.5 and 125 mg kg−1. Thus the results indicated that PNA-2 led to the release of cytochrome c from the mitochondria to the cytosol. As the Bcl-2 family members are important regulators of the mitochondrial apoptotic pathway, this study examined the expression of Bax and Bcl-2 proteins, in order to clarify the mechanism of PNA-2-induced apoptosis. Fig. 8C and D reveal that the protein levels of Bax increased dramatically in PNA-2-treated tumor-bearing groups at doses of 62.5 and 125 mg kg−1, whereas the protein expression level of Bcl-2 was decreased in a dose-dependent manner.4. Discussion
Cancers are chronic diseases affecting millions of humans. It has been reported that medicinal mushrooms could serve as supplementary cancer treatments or direct remedies against cancer development,21 and more and more medicinal compounds have hence been evaluated.22,23 β-Glucans, derived from mushrooms, have been under focus and recognized as a potential anticancer agent.24,25PNA-2, a novel fungal polysaccharide purified from P. nebrodensis in our previous work, contains β-(1,4)-linked-D-glucose main chains highly substituted with mannose units and β-(1,3)-linked-D-glucose branches. Although some β-glucans, such as lentinan, schizophyllan, maitake D-fraction, and Ganoderma polysaccharides, have been tested for potential antitumor effects,26–29 the antitumor activity of β-glucans derived from P. nebrodensis has not been evaluated, and the mechanism is also unclear.
In this study, PNA-2 anti-proliferative activities and its inhibition of tumor metastasis in HepG2 cells were investigated. Results demonstrated a significant inhibition in HepG2 cells with an inhibition rate of 34.2% at 125 μg mL−1 and a rapid decrease in the rates of migration from 88.2% to 57.8% at 24 h (Fig. 1).
Apoptosis and cell cycle arrest are two main mechanisms for cell growth inhibition. Apoptosis is a process of cell suicide characterized by specific morphological changes,30 such as condensation of chromatin, loss of microvilli, blebbing formation, and appearance of apoptotic bodies, which were observed in HepG2 cells treated with PNA-2. Meanwhile, the important hallmarks of apoptosis, including the increase of AO/EB stained apoptotic cells (Fig. 2) and evident DNA fragmentation (Fig. 3) were also displayed. Moreover, cell cycle arrest is one of the key mechanisms by which anticancer drugs exert their effect on cancer cells. Analysis of the cell cycle was carried out in cells treated with PNA-2, and results indicated that the cell number in G0/G1 phases increased (P < 0.01), and that in the S as well as the G2/M phase decreased significantly (P < 0.01) (Fig. 4).
As reported, mitochondria play a central role in initiating the apoptotic process and the loss of mitochondrial membrane potential (ΔΨm) is an early event in apoptosis.31,32 Mitochondria in cancer cells have a higher membrane potential, poor permeability and are less susceptible to activation by the mitochondrial pathway of apoptosis. Thus, breaking the respiratory chain and damaging the mitochondrial membrane potential could become a fundamental indicator for the elimination of cancer cells.33 Results in our work indicated that PNA-2 significantly depolarized the membrane potential in a dose-dependent manner (Fig. 5A and B). As is known, the process of apoptosis is triggered by mitochondrial disruption and the subsequent release of Cyt C, with expression changes of the pro-apoptotic Bcl-2 family proteins and anti-apoptotic proteins. And apoptosis is ultimately executed by the caspase family proteins. Here, we have found that the levels of cytosolic Cyt C are significantly increased in cells following PNA-2 treatment which subsequently activates caspase 9. Activated caspase 9 by the Cyt C protein in turn activates caspase 3, and activated caspase 3 ultimately induces apoptosis with a decrease in Bcl-2 levels (Fig. 5A–C). These results indicate that PNA-2 induces mitochondria-dependent apoptosis in HepG2 cells.
To further elucidate the role of PNA-2 in vivo, a HepG2 tumor model in BALB/cAnN-nu mice was established. Significant tumor suppression by PNA-2 at concentrations of 12.5, 62.5, and 125 mg kg−1 was observed, and the mRNA expression of tumor cell proliferative markers such as CD31 and Ki67 was also significantly decreased (Fig. 7). The mitochondria-mediated apoptotic pathway is under the control of multiple layers of regulation, and one of the most important players are members of the Bcl-2 family. Results indicated that PNA-2 inhibited the expression of the anti-apoptotic protein Bcl-2, and also triggered the expression of the pro-apoptotic protein Bax in HepG-2-bearing mice, which are necessary for the disruption of mitochondria, the release of cytochrome c from mitochondria into the cytosol (Fig. 8), and the activation of the mitochondria-dependent apoptotic signaling pathway.
Our data confirmed the potential of PNA-2 as an agent for cytostatic activity in HepG2 cells in vitro and in vivo, which may be valuable for applications in drug development. For further confirmation, other molecular mechanisms should be investigated to elucidate several molecular pathways and provide additional information on the potential use of this natural product in clinical settings.
5. Conclusion
In this study, the effect of PNA-2, a polysaccharide isolated from P. nebrodensis by an alkaline extraction method in our previous work, on human hepatic cancer cell (HepG2) proliferation and apoptosis-related mechanisms was investigated. The results suggested that PNA-2 could inhibit HepG2 cell proliferation, cause DNA damage and induce apoptosis via a mechanism primarily involving the activation of the intrinsic mitochondrial pathway.Acknowledgements
We are grateful for the financial support provided by the Ph.D. Training Foundation of Tianjin University of Science and Technology (Grant No. 201402).References
- A. C. Carr, M. C. Vissers and J. S. Cook, Fron. Oncol., 2014, 4, 283 Search PubMed.
- M. H. Kim and H. Kim, J. Cancer Prev., 2013, 18, 221 CrossRef PubMed.
- H.-S. Xu, Y.-W. Wu, S.-F. Xu, H.-X. Sun, F.-Y. Chen and L. Yao, J. Ethnopharmacol., 2009, 125, 310–317 CrossRef CAS PubMed.
- J. G. Teodoro and P. E. Branton, J. Virol., 1997, 71, 1739 CAS.
- T. Tatsuta, S. Sugawara, K. Takahashi, Y. Ogawa, M. Hosono and K. Nitta, Mol. Cell. Oncol., 2014, 4, 139 Search PubMed.
- N. Hirahara, T. Edamatsu, A. Fujieda, M. Fujioka, T. Wada and Y. Tajima, Oncol. Rep., 2013, 30, 99–104 CAS.
- S. Miao, X. Mao, R. Pei, S. Miao, C. Xiang, Y. Lv, X. Yang, J. Sun, S. Jia and Y. Liu, Int. J. Biol. Macromol., 2013, 61, 97–101 CrossRef CAS PubMed.
- C. M. Nasrallah and T. L. Horvath, Nat. Rev. Endocrinol., 2014, 10, 650–658 CrossRef CAS PubMed.
- R. Mehvar, Curr. Pharm. Biotechnol., 2003, 4, 283–302 CAS.
- B. H. Ali, A. Ziada and G. Blunden, Food Chem. Toxicol., 2009, 47, 1–8 CrossRef CAS PubMed.
- S. C. Jeong, Y. T. Jeong, B. K. Yang, R. Islam, S. R. Koyyalamudi, G. Pang, K. Y. Cho and C. H. Song, Nutr. Res., 2010, 30, 49–56 CrossRef CAS PubMed.
- Z. Yu, Y. LiHua, Y. Qian and L. Yan, Carbohydr. Polym., 2009, 75, 115–118 CrossRef CAS.
- S. C. Jeong, S. R. Koyyalamudi, Y. T. Jeong, C. H. Song and G. Pang, J. Med. Food, 2012, 15, 58–65 CrossRef CAS PubMed.
- X.-r. Zhang, C.-h. Qi, J.-p. Cheng, G. Liu, L.-j. Huang, Z.-f. Wang, W.-x. Zhou and Y.-x. Zhang, Int. Immunopharmacol., 2014, 19, 132–141 CrossRef CAS PubMed.
- S.-M. Lee, M.-Y. Yoon and H.-R. Park, Biosci., Biotechnol., Biochem., 2008, 72, 1272–1277 CrossRef CAS PubMed.
- R. Tice, E. Agurell, D. Anderson, B. Burlinson, A. Hartmann, H. Kobayashi, Y. Miyamae, E. Rojas, J. Ryu and Y. Sasaki, Environ. Mol. Mutagen., 2000, 35, 206–221 CrossRef CAS PubMed.
- J. Lemasters and A. Nieminen, Biosci. Rep., 1997, 17, 281–291 CrossRef CAS PubMed.
- M. Glaß, B. Möller, A. Zirkel, K. Wächter, S. Hüttelmaier and S. Posch, Pattern Recognit., 2012, 45, 3154–3165 CrossRef.
- C.-C. Liang, A. Y. Park and J.-L. Guan, Nat. Protocols., 2007, 2, 329–333 CAS.
- O. Debeir, I. Adanja, R. Kiss and C. Decaestecker, Motile Actin Syst. Health Dis., 2008, 123–156 Search PubMed.
- J. Jiang, A. Thyagarajan-Sahu, J. Loganathan, I. Eliaz, C. Terry, G. E. Sandusky and D. Sliva, Oncol. Rep., 2012, 28, 1139–1145 Search PubMed.
- I. CFR Ferreira, J. A. Vaz, M. H. Vasconcelos and A. Martins, Anti-Cancer Agents Med. Chem., 2010, 10, 424–436 Search PubMed.
- C. Lull, H. J. Wichers and H. F. Savelkoul, Mediators Inflammation, 2005, 2005, 63–80 CrossRef PubMed.
- N. Kodama, N. Harada and H. Nanba, Jpn. J. Pharmacol., 2002, 90, 357–360 CrossRef CAS PubMed.
- R. Beaglehole and R. Horton, Lancet, 2010, 376, 1619–1621 CrossRef.
- K. Sreenivasulu, M. Vijayalakshmi and K. R. Sambasivarao, Avicenna J. Med. Biotechnol., 2010, 2, 181 Search PubMed.
- K. Zhong, L. Liu, L. Tong, X. Zhong, Q. Wang and S. Zhou, Int. J. Biol. Macromol., 2013, 62, 13–17 CrossRef CAS PubMed.
- N. Kodama, Y. Murata, A. Asakawa, A. Inui, M. Hayashi, N. Sakai and H. Nanba, Nutrition, 2005, 21, 624–629 CrossRef CAS PubMed.
- J. Li, L. Lei, C. Yu, Z. Zhu, Q. Zhang and S. Wu, J. South. Med. Univ., 2007, 27, 1003–1005 CAS.
- E. J. Hagedorn and D. R. Sherwood, Curr. Opin. Cell Biol., 2011, 23, 589–596 CrossRef CAS PubMed.
- J. J. Lemasters, E. L. Holmuhamedov, C. Czerny, Z. Zhong and E. N. Maldonado, Biochim. Biophys. Acta, Biomembr., 2012, 1818, 1536–1544 CrossRef CAS PubMed.
- P. F. Li, R. Dietz and R. von Harsdorf, EMBO J., 1999, 18, 6027–6036 CrossRef CAS PubMed.
- V. Gogvadze, Curr. Pharm. Des., 2011, 17, 4034–4046 CrossRef CAS PubMed.
Footnote |
| † Electronic supplementary information (ESI) available. See DOI: 10.1039/C5FO00884K |
| This journal is © The Royal Society of Chemistry 2016 |


