 Open Access Article
 This Open Access Article is licensed under a
 Creative Commons Attribution 3.0 Unported Licence
Structural dynamics of photochemical reactions probed by time-resolved photoelectron spectroscopy using high harmonic pulses
Ryo
Iikubo
a,
Taro
Sekikawa
*a,
Yu
Harabuchi
b and
Tetsuya
Taketsugu
b
aDepartment of Applied Physics, Faculty of Engineering, Hokkaido University, Kita 13 Nishi 8, Kita-ku, Sapporo 060-8628, Japan. E-mail: sekikawa@eng.hokudai.ac.jp
bDepartment of Chemistry, Faculty of Science, Hokkaido University, Kita 10 Nishi 8, Kita-ku, Sapporo 060-0810, Japan
First published on 31st May 2016
Abstract
Femtosecond ring-opening dynamics of 1,3-cyclohexadiene (CHD) in gas phase upon two-photon excitation at 400 nm (=3.1 eV) was investigated by time-resolved photoelectron spectroscopy using 42 nm (=29.5 eV) high harmonic photons probing the dynamics of the lower-lying occupied molecular orbitals (MOs), which are the fingerprints of the molecular structure. After 500 fs, the photoelectron intensity of the MO constituting the C![[double bond, length as m-dash]](https://www.rsc.org/images/entities/char_e001.gif) C sigma bond (σCC) of CHD was enhanced, while that of the MO forming the C–C sigma bond (σCC) of CHD was decreased. The changes in the photoelectron spectra suggest that the ring of CHD opens to form a 1,3,5-hexatriene (HT) after 500 fs. The dynamics of the σCC and σCC bands between 200 and 500 fs reflects the ring deformation to a conical intersection between the 21A and 11A potential energy surfaces prior to the ring-opening reaction.
C sigma bond (σCC) of CHD was enhanced, while that of the MO forming the C–C sigma bond (σCC) of CHD was decreased. The changes in the photoelectron spectra suggest that the ring of CHD opens to form a 1,3,5-hexatriene (HT) after 500 fs. The dynamics of the σCC and σCC bands between 200 and 500 fs reflects the ring deformation to a conical intersection between the 21A and 11A potential energy surfaces prior to the ring-opening reaction.
Introduction
Electrocyclic reactions play important roles in biological activities1 and in photoelectric functions.2 The stereospecificity of electrocyclic ring-opening and ring-closing reactions is well understood by the Woodward–Hoffmann rules3 and the dynamics of the electrocyclic reactions has also been investigated experimentally. In particular, 1,3-cyclohexadiene (CHD) is of interest,4,5 because the ring-opening reaction of CHD to 1,3,5-hexatriene (HT) is the key reaction in the synthesis of vitamin D6–8 and in photochromic materials.2 CHD provides us a unique opportunity to investigate the ring-opening dynamics of biological and functional molecules in a simplified manner.To gain insight into the intrinsic ring-opening dynamics without the interaction with solvent, a gas-phase experiment is suitable. The ring-opening dynamics of CHD in gas phase has been extensively investigated by ionization mass and photoelectron spectroscopy,9–17 electron diffraction,18 X-ray scattering,19 theoretical calculations,20–24 and so forth. These investigations focus on the relaxation processes from the 11B state. The configurational coordinate model shown in Fig. 1 is used to understand the processes: upon photoexcitation to 11B, the nuclear wavepacket propagates to the 21A state via a conical intersection (CI). At the second CI with the 11A state on the 21A potential energy surface, it bifurcates into CHD and HT in the ground state. Experimentally, it was found that the internal conversion from 11B to 21A took 56 fs by the transient ionization experiment.12 Time-resolved photoelectron spectroscopy (TRPES) using ultraviolet (UV) light17 showed that the lifetime of 11B was 30 fs and that HT appeared at 142 fs after excitation. This is consistent with other works.11,12 New light sources were applied to the time-resolved spectroscopy of CHD recently;16 TRPES probed by 14 eV light gave the similar lifetimes of 70 and 60 fs for 11B and 21A, respectively, to those obtained by UV light. Structural dynamics observed by X-ray scattering using a free-electron laser (FEL) showed that the bond of CHD broke as the terminal carbon atoms moved perpendicular to the molecular plane.19 Electron diffraction18 showed that the CHD ring cleaved on the picosecond timescale including the isomerization processes of HT.
 | ||
| Fig. 1 Configurational coordinate model of the relaxation and the ring-opening processes in 1,3-cyclohexadiene (CHD) pumped by two-photon absorption of 400 nm photons. The arrows at the conical intersection indicate the bifurcation of the relaxation pathway at the conical intersection, leading to CHD or 1,3,5-hexatriene (HT). | ||
Here, we investigated the ring-opening dynamics pumped by two photons of 400 nm (=3.1 eV) light and probed it by TRPES using high harmonic pulses with a photon energy of 29.5 eV. The present experimental scheme has two features in comparison with the previous studies: first, 3p Rydberg states, found by the resonant-enhanced multiphoton ionization (REMPI),20 were excited by the two-photon absorption process, while the 11B state corresponding to ππ* transition was excited in the previous works.9–17 According to ref. 11, the ring opening was observed even at zero delay time under the two-photon excitation by 400 nm photons. This suggests that there are some very fast nonradiative processes from the Rydberg states. Therefore, the ring-opening dynamics might be different from the case of ππ* excitation.
Second, TRPES using high harmonic pulses enables us to take a snapshot of the molecular orbitals (MOs) under an assumption of Koopmans' theorem.25 The usage of ultrashort extreme ultraviolet (XUV) pulses by high harmonic generation enables us to probe not only the highest occupied MO (HOMO) but also lower-lying occupied MOs.26–30 Lower-lying occupied MOs can be the fingerprints of the molecular structure, because each MO can be associated with each bonding nature, e.g. single bond, double bond, conjugated double bond, and so forth.31 The dynamics particular to each MO reflects the local conformational changes of the molecule. Using high harmonic pulses, we can gain insight into both electronic structures and molecular structures, providing us a new perspective on the chemical dynamics. Recently, we observed the ultrafast relaxation of the excited 1,3-butadiene30 and the C–C bond breaking dynamics of 1,2-butadiene32 by TRPES using high harmonic pulses.
Experimental
The experimental setup is shown in Fig. 2. We used a Ti:sapphire laser system delivering 800 nm, 1.1 mJ, 30 fs pulses at a repetition rate of 1 kHz for TRPES. After the second harmonic (=3.1 eV) generation by a LiB3O5 (LBO) crystal (500 μm thickness) for the pump pulses with a pulse energy of 40 μJ, the remaining fundamental pulses were focused into a Kr pulse gas jet for high harmonic generation. The 19th harmonic (=29.5 eV) for the probe was selected among many harmonics by a time-delay compensated monochromator (TDCM),33–37 enabling the single harmonic selection with the time duration preserved. A TDCM consists of a pair of toroidal gratings and a slit: the first grating and a slit select the harmonic order and the second grating compensates for the pulse front tilt caused by the diffraction on the first grating. The shortest pulse duration of the selected high harmonics achieved in our system was 11 fs.35 The pump intensity was reduced to 19 μJ by the attenuator composed of a pair of thin film polarizers and a half-wave plate. Both the pump and probe pulses were focused into the sample gas with a polarization angle of 55° to avoid the time dependence induced by molecular rotation. The photon flux on target was ∼109 photons per s, corresponding to a pulse energy of 5 pJ.37 CHD was purchased from Sigma-Aldrich and was used without any further purification. The sample gas, evaporated at room temperature, was guided to the entrance of a magnetic bottle time-of-flight photoelectron spectrometer through a copper pipe. A retardation electric field was applied in the flight tube to improve the spectral resolution of the spectrometer. Hence, the spectral resolution was determined by the spectral width of the XUV light (200 meV). The transient photoelectron spectra were recorded by changing the optical delay between the pump and probe pulses. The temporal evolution of the photoelectrons ejected by the two-photon ionization of Kr gas by pump and probe pulses, i.e. the cross-correlation function,38,39 was employed as the response function of the system, of which the width τFWHM was 120 fs. Since we have already optimized the diffraction angle of the grating in the TDCM,35 the temporal width was mainly limited by the pump pulse duration. | ||
| Fig. 2 Experimental setup for time-resolved photoelectron spectroscopy using high harmonic pulses. Tis is Ti:sapphire. | ||
Computational details
To understand the photoelectron spectra, the ionization energies of CHD and the isomers of HT were calculated from the orbital energies obtained by long-range corrected density functional theory (LC-DFT) with LC-BOP/cc-pVDZ using the GAMESS-package25,40 under an assumption of Koopmans' theorem. Also, to investigate the origin of the transient states, the vertical excitation energies and ionization energies were calculated at the Franck–Condon (FC) structure of CHD by 2nd-order multi-reference perturbation theory (CASPT2) with Dunning's basis sets of double-zeta-quality plus Rydberg functions,41 using MOLPRO2010.42 Two sets of π and π* (12a, 10b, π*-a, π*-b) orbitals and four Rydberg orbitals (3s, 3px, 3py, 3pz) were included in the active space of the reference state-averaged complete active space self-consistent field (SA-CASSCF) wavefunction.Results and discussion
Molecular orbitals
The orbital energies and the MO shapes of CHD are summarized in Fig. 3. The orbital energies are in good agreement with the experimental ionization energies shown later, and thus, Koopmans' theorem is applicable to CHD. Each MO has a different spatial distribution and the character of the MO is named to signify the distribution in reference to ref. 31. The MO distribution is not directly connected with the classical chemical bond used in the structural formula. However, it is worth mentioning that the MOs with −12.56, −13.19, and −14.11 eV have a high density at the C5–C6 bond that cleaves upon photoexcitation. Thus, we expect that the intensities of photoelectrons or the ionization energies of these MOs are changed by the C5–C6 bond cleavage. These MOs can be the fingerprints of the ring structure of CHD. | ||
| Fig. 3 Structural formula and molecular orbitals of 1,3-cyclohexadiene calculated at the LC-BOP/cc-pVDZ level. The character and orbital energy of each MO are also indicated. | ||
Excited states
The calculated and experimental absorption energies of CHD are shown in Table 1. The 3p Rydberg states experimentally have the transition energies of 6.03 and 6.05 eV (ref. 20) and the absorption spectrum has sharp peaks around 6.2 eV,43 which is a feature of Rydberg states. Since the point group of CHD is C2, these states are both one- and two-photon transition allowed. Therefore, the excited states by two-photon absorption of 3.1 eV photons were mainly 3p Rydberg states in this experiment. The three-photon energy of the pump laser is larger than the ionization energy of CHD (=8.25 eV)31 and the second ionization energy should be much larger than the first ionization energy due to the Coulomb interaction. Hence, the photoelectrons from the cations would appear in a totally different spectral region from the neutral species. In this work, therefore, we eliminate the possibility that the dynamics of cations were observed.| State | CASPT2a | CASPT2b | expb | |
|---|---|---|---|---|
| a This work. b Ref. 20. | ||||
| Neutral | 11B(12a → π*-b) | 4.88 | 4.72 | 4.94 |
| 21A(12a → 3s) | 5.41 | 5.49 | 5.39 | |
| 21B(12a → 3px) | 5.94 | 5.98 | 6.03 | |
| 31A(12a → 3pz) | 6.03 | 6.12 | 6.05 | |
| 31B(12a → 3py) | 6.05 | 6.04 | ||
| Cation | 12A(GS) | 8.09 | ||
| 12B(10b → 12a) | 10.53 | |||
| 22B(12a → π*-b) | 11.78 | |||
| 22A(12a → π*-a) | 13.86 | |||
| 32A(12a → 3s) | 16.00 | |||
| 32B(12a → 3px) | 17.03 | |||
Time-resolved photoelectron spectra
In Fig. 4a, the photoelectron spectrum before the pump is shown by the black line, obtained by averaging the spectra at 5 negative delay times between −200 fs and −86 fs. Two broad photoelectron bands between 10.5 and 12 eV and between 12 and 14 eV are clearly shown. The broad spectrum is due to the spectral width of the probe light. The theoretical ionization energies of CHD indicated by the solid squares are found within the observed spectrum. In particular, the photoelectron band between 12 and 14 eV includes σCC at 13.19 eV and πCH2 at 12.56 eV constituting the C5–C6 bond, while the band between 10.5 and 12 eV is contributed by πCC+ at 10.98 eV and σCC at 11.47 eV forming the CC bond. To characterize each photoelectron band based on the MOs, we denote hereafter the band between 12 and 14 eV as the C–C band, and the band between 10.5 and 12 eV as the CC band.
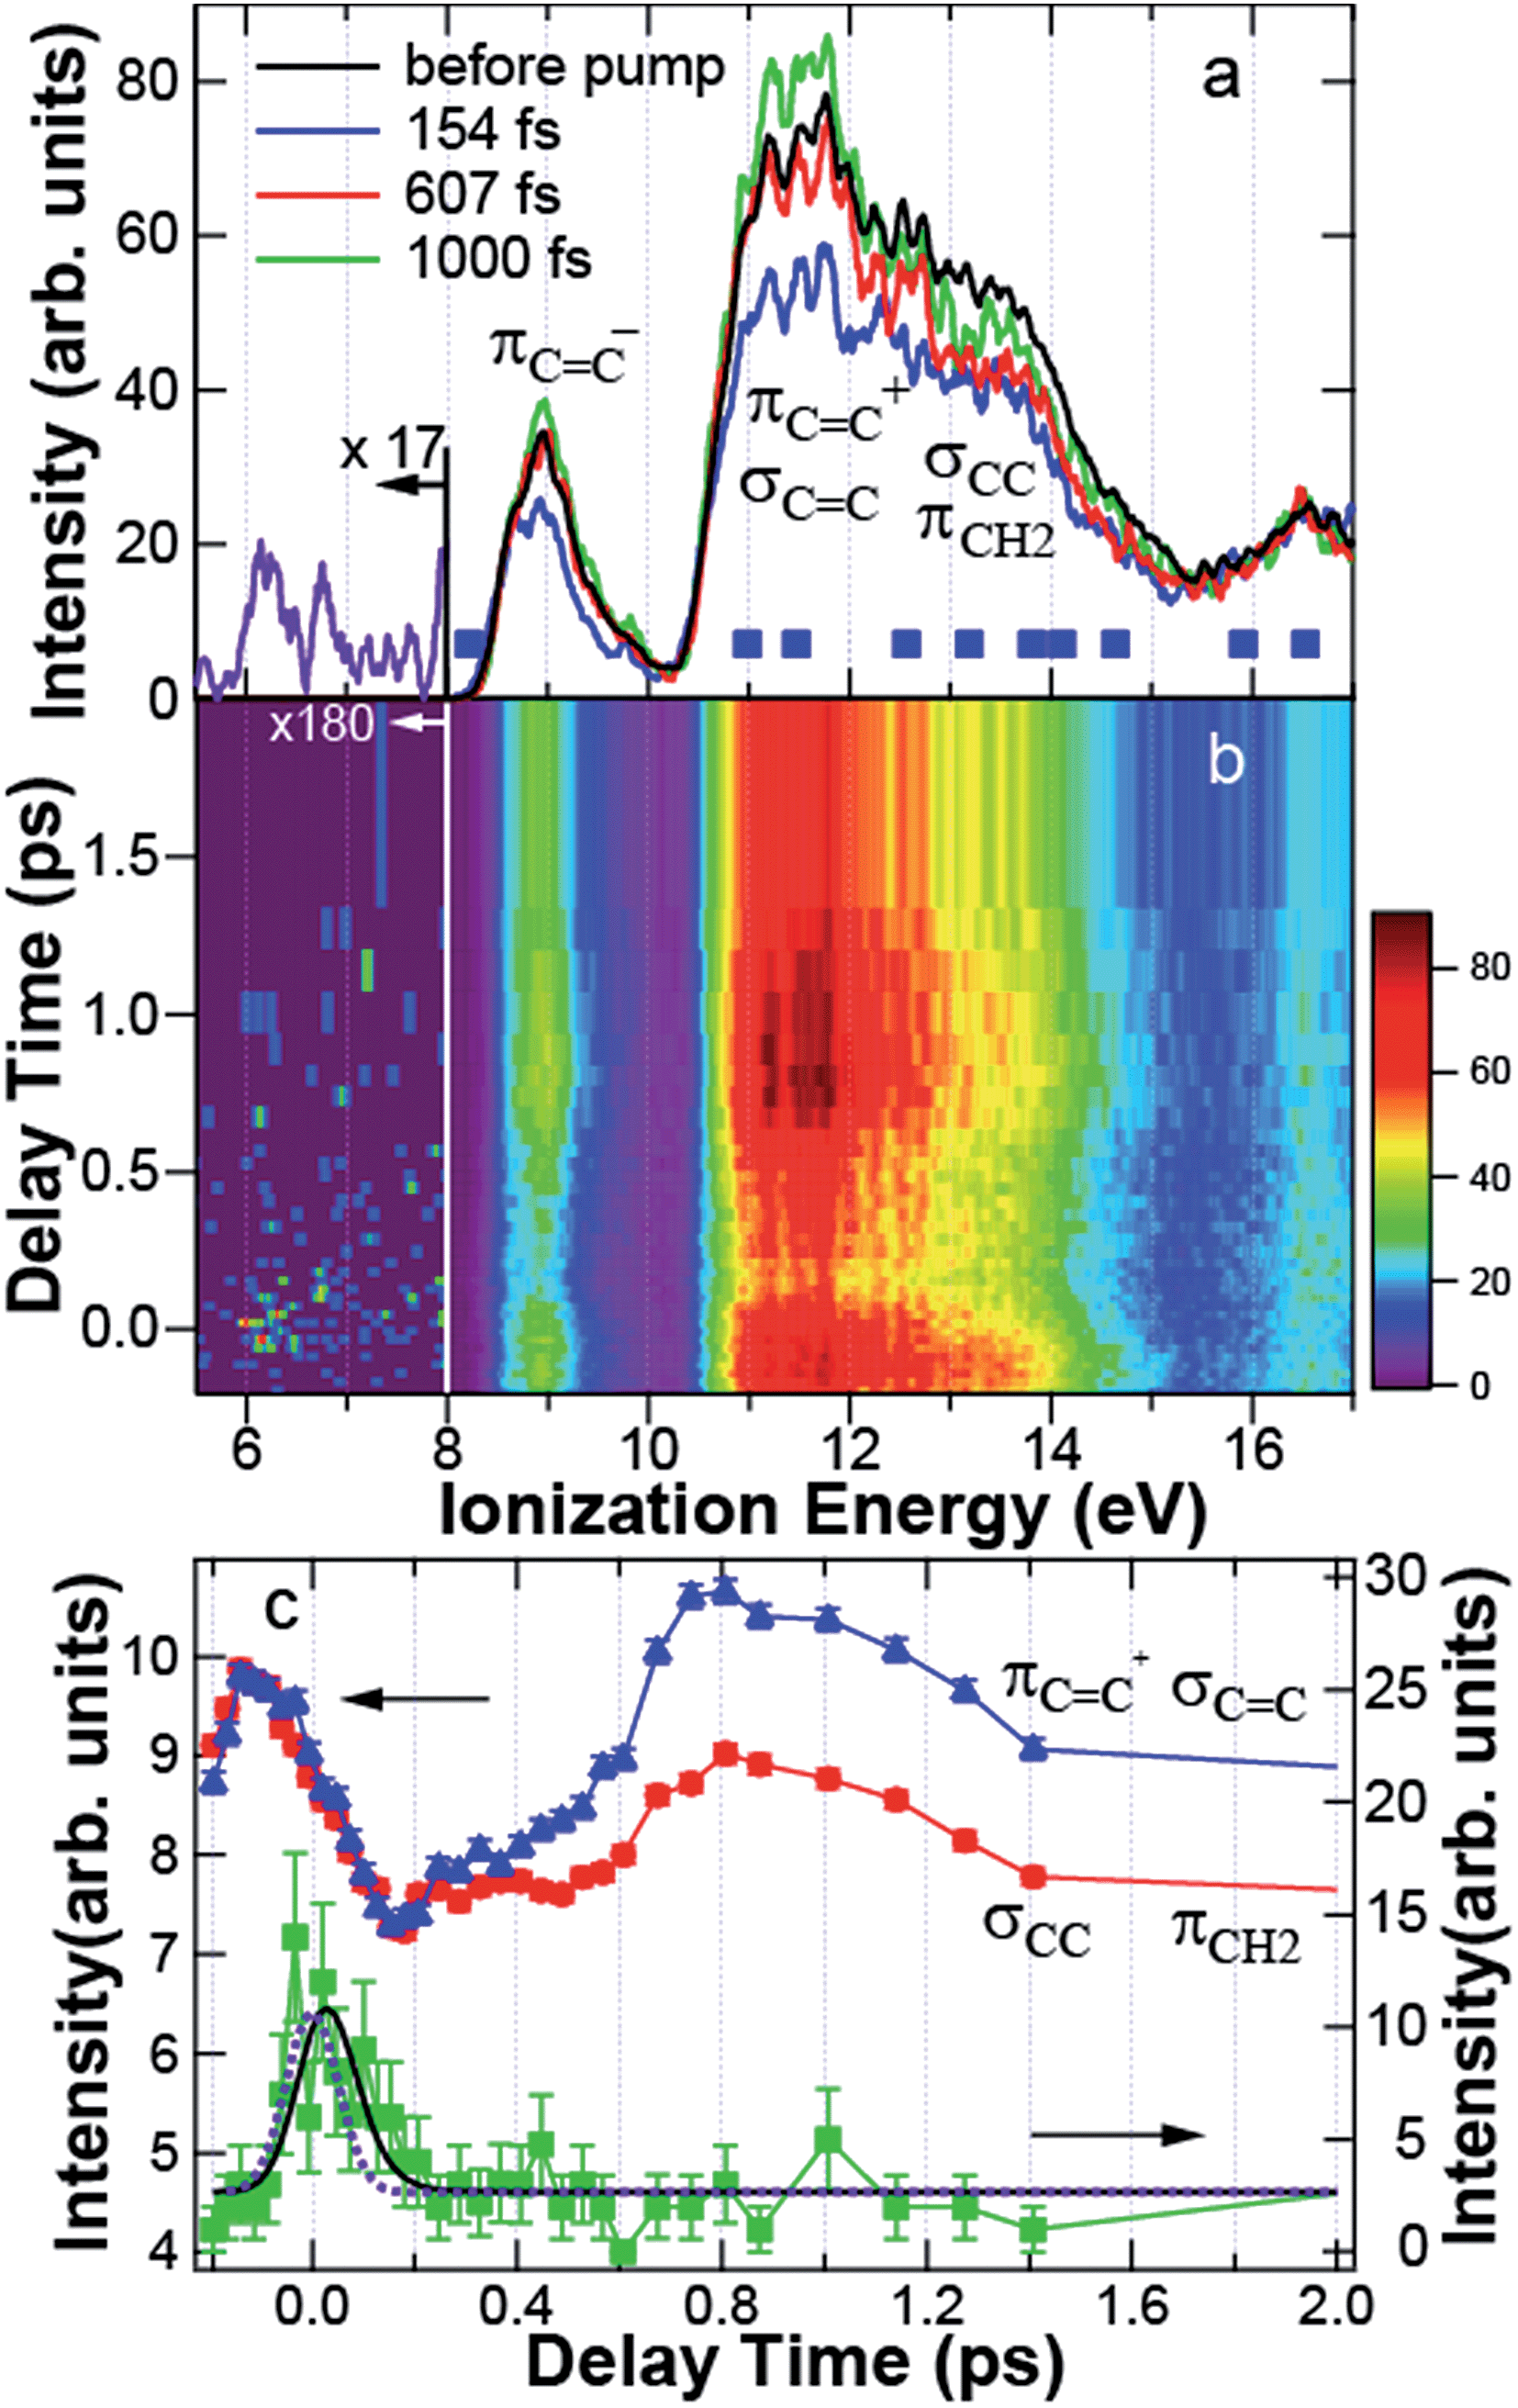 | ||
| Fig. 4 (a) Photoelectron spectrum before the pump (black) and the spectra at 154 fs (blue), 607 fs (red), and 1000 fs (green). The solid squares indicate the theoretical ionization energies of 1,3-cyclohexadiene. In the assignment to molecular orbitals, notations are taken from Fig. 3. The spectrum of the transient band integrated between −140 and 250 fs is shown by the purple line below 8 eV. (b) Photoelectron spectrogram between −0.2 and 2 ps. (c) Time dependence of the intensity of πCC+ and σCC (blue triangle), that of σCC and πCH2 (red circle), and the transient band (green square) integrated between 11.14 and 11.93 eV, 12.20 and 14.00 eV, and 5.69 and 7.75 eV, respectively. The blue, red, and green solid lines are a guide for the eye. The black solid and purple dotted lines are the results fitted to the experimental data and the response function of the system, respectively. | ||
Fig. 4a also shows the time-resolved photoelectron spectra at 154 fs (blue), 607 fs (red), and 1000 fs (green) after pump. Fig. 4b shows the photoelectron spectrogram between −200 and 2000 fs. Here, we would like to raise the following two features in Fig. 4a and b. First, the dynamics of the C–C and CC bands are different to each other: the photoelectron yield was reduced uniformly just after excitation. However, the intensity of the CC band was almost recovered at 607 fs, while that of the C–C band was still reduced. At 1000 fs, the CC band was even enhanced, although the C–C band intensity was still reduced. Second, Fig. 4b shows that a transient state appeared around 6–7 eV at 0 fs. The spectrum of the transient band below 8 eV integrated between −140 and 250 fs is shown in Fig. 4a by the purple line. The transient state has a broad spectrum almost reaching to the HOMO band.
To see these MO-dependent dynamics, the intensities of the CC, C–C, and the transient bands integrated between 11.14 and 11.93 eV, 12 and 14 eV, and 5.69 and 7.75 eV, respectively, were plotted as a function of delay time between −0.2 and 2 ps in Fig. 4c. Here, the intensities of the C–C band and the CC band are magnified to be on the same scale to verify that their dynamics are quite similar between −200 and 150 fs. The error bars show the statistical errors in the counting experiments. The time dependence of the transient band was fitted by the least squares method to a single exponential function I(t) = exp(−t/τ) convoluted with the correlation function of the system R(t) = exp{−4![[thin space (1/6-em)]](https://www.rsc.org/images/entities/char_2009.gif) ln2 (t/τFWHM)2}, where t, τ, and τFWHM are the time, decay time, and temporal width of R(t), respectively. The fitting function f(t) is expressed as.
ln2 (t/τFWHM)2}, where t, τ, and τFWHM are the time, decay time, and temporal width of R(t), respectively. The fitting function f(t) is expressed as.
 | (1) |
Ring-opening dynamics
Fig. 4c shows that, after 150 fs, the CC band increased gradually until ∼500 fs. Then, the intensity was enhanced up to 800 fs, while the C–C band was constant between 200 and 500 fs and was also enhanced after 500 fs. However, the intensity of the C–C band was not fully recovered in the spectrum before the pump. Because the C5–C6 bond mainly comes from the C–C band, the decrease in the relative intensity of the C–C band to the CC band can be associated with the cleavage of the C–C bond.
To find the intermediates and products of the ring-opening reaction, the difference time-resolved spectra from the photoelectron spectrum before the pump are shown at delay times of 154, 607, and 1000 fs in Fig. 5b. Here, we consider three isomers of HT, all-cis-hexatriene (cZc-HT), mono-s-cis-Z-hexatriene (cZt-HT), and di-s-trans-Z-hexatriene (tZt-HT). Their chemical formulas are shown in Fig. 6. The ionization energies of these isomers, calculated by the same method as those of CHD, are shown in Fig. 5a together with those of CHD. Fig. 5c shows the photoelectron spectrum of CHD without the pump for comparison. Although we found that the CC band was enhanced in Fig. 4c, Fig. 5b shows that the temporal evolution of the CC band was not uniform: the photoelectron band with a lower ionization energy than 11 eV was enhanced faster than the energetically higher region even within the CC band. As a result, the positive signal appeared below 11 eV at 607 fs in Fig. 5b. This suggests that an MO with an ionization energy lower than 11 eV appeared by ring opening. The theoretical ionization energies of HTs shown in Fig. 5a predict that HTs have smaller ionization energies around 10.2 eV than that of the πCC+ of CHD. The theoretical calculation also predicts the energy shift of the HOMO of cZc-HT to the higher ionization energy, which was experimentally observed at 1000 fs in Fig. 5b. Therefore, we attribute the MO lower than 11 eV observed at 607 fs to πCC of cZc-HT produced just after the ring opening reaction. At almost the same delay time, we also observed the enhancement of the C–C band in Fig. 4c, suggesting a drastic change in the electronic structure, i.e. ring opening, of the molecule. Thus, we conclude that the ring starts to open at ∼500 fs.
 | ||
| Fig. 5 (a) Ionization energies of tZt-hexatriene (triangle), cZt-hexatriene (diamond), cZc-hexatriene (circle), and 1,3-cyclohexadiene (CHD) (square). (b) Difference photoelectron spectra from the averaged photoelectron spectrum in the negative delay time. (c) Photoelectron spectrum of CHD without optical pump. | ||
 | ||
| Fig. 6 Chemical formulas of hexatriene isomers. (A) cZc-hexatriene, (B) cZt-hexatriene, and (C) tZt-hexatriene. | ||
The enhancement of the CC band compared to the C–C band upon ring opening is qualitatively understood as the change in the electronic structure from CHD to cZc-HT. If the ionization cross section of each MO is almost the same, the photoelectron intensity is proportional to the number of MOs involved in a selected region: CHD has three MOs in the CC band between 10 and 12.2 eV, while cZc-HT has four shown in Fig. 5a. Thus, the CC band is expected to be enhanced by ring opening. On the other hand, CHD has three MOs in the C–C band between 12.2 and 14.0 eV, while cZc-HT has two, also explaining the decrease in the C–C band by ring opening. The enhancement of the CC and C–C bands ended at 800 fs and then, their band intensities began to be reduced till 1.4 ps. The relative intensity of the C–C band to the CC band remained smaller after 800 fs, suggesting that the molecule stayed at the HT structures. Therefore, the decrease in the photoelectron intensities of both the C–C and the CC bands after 800 fs are attributable to subsequent isomerization to cZt-HT or to tZt-HT.
Fig. 7 shows the long-term measurement of the CC and C–C bands. After 7 ps, the intensities of both bands increased but the CC band was more enhanced. Then, at 40 ps, the CC band intensity decreased. Fig. 5a shows that the changes in the ionization energies among the isomers of HT are not so significant. Thus, the assignment of the molecular structure is not conclusive. However, the structural dynamics observed by the electron diffraction revealed the picosecond dynamics and the coexistence of HT isomers.18 After the ring opening, the rotational inertia around the C–C bond should induce the isomerization of HT. As a result, the long-term dynamics shown in Fig. 7 is attributed to the isomerization among HTs.
 | ||
| Fig. 7 Time dependence of the intensity of πCC+ and σCC (blue triangle) and that of σCC and πCH2 (red circle) integrated between 11.14 and 11.93 eV and 12.20 and 14.00 eV, respectively. Delay times are presented on a logarithmic and on a linear scale in the positive and negative regions, respectively. The blue and red solid lines are a guide for the eye. The dotted line indicates the intensity of πCC+ and σCC in the averaged spectrum. | ||
TRPES using ultraviolet light also suggested that HTs have the higher vibrational temperature.17 According to ref. 17, the deconvoluted photoelectron spectrum of HT extended to the lower ionization energies. This suggests that the isomers of HTs coexist and that anharmonic vibrations broaden the spectrum.
Dynamics of transient states
Now, we would like to discuss the processes prior to the ring opening. Just after excitation, we observed the transient state around 6–7 eV. We attribute this transient state to the FC states of 3p Rydberg states, which relax to the lower-lying excited states through CIs with a time constant of 37 ± 13 fs. The corresponding relaxation dynamics of the CC and C–C bands was also observed: upon photoexcitation, both the CC and C–C band intensities decreased with the response function of the system, owing to the different ionization cross section of the ground state or FC factors from those of the excited states, and then, the slight increment was observed at 200 fs in Fig. 4c. The relaxation of the transient state took place simultaneously with these increments of the CC and C–C bands, indicating the relaxation to the lower-lying excited states. The broad spectral width of the transient state over 2 eV shown in Fig. 4a suggests that the transient band is composed of more than a few states.
As shown in Table 1, the present calculations well reproduced the experimental and previously calculated excitation energies for neutral CHD.20 The first ionization energy was calculated as 8.09 eV which is consistent with the HOMO energy from LC-BOP calculations (8.21 eV). According to the relative energy values in Table 1, the ionization energies from the 31A state of the neutral species to the cationic states, 22B (12a → π*-b) and 22A (12a → π*-a), are 5.75 and 7.83 eV, respectively. Thus, the observed transient photoelectron bands could be assigned to these two states.
We did not detect any signals via the transition from the 3p Rydberg states of the neutral species to the 12A and 12B states of the cation, which are expected to appear around 2.06 and 4.50 eV, respectively. We think that this is due to the lower collection efficiency for the faster photoelectrons of the magnetic bottle spectrometer, because the faster electrons are not well guided to the detector due to the larger Larmor radius of the electron in the magnetic field.44
Dynamics on the 21A potential energy surface
After the relaxation to the 21A or 11B state, the temporal evolution of the CC and C–C bands observed between 200 and 500 fs should reflect the dynamics in the 21A or 11B excited states. Tamura and coworkers investigated the quantum dynamics of CHD on the potential energy surfaces, calculated by a multireference configuration interaction method, after excitation to the 11B state.23 According to this report, the wavepacket decays from the FC state to 21A through a CI on the 11B-21A seam line. In the 21A state, the ring structure is distorted firstly to the open-ring, then to the closed-ring, and finally to the five-membered ring (5 MR) structures. Since a CI with the 11A state is located close to 5 MR, the molecular structure bifurcates into CHD or cZc-HT in the ground state. Due to dynamics in the 21A state, it is predicted that the appearance of cZc-HT has about 180 fs time lag behind photoexcitation. In the present experiment, CHD was excited to the 3p Rydberg states. Therefore, the relaxation pathway from the FC structure on the potential energy surface does not necessarily lead to the 11B state and the experimental results might not be directly comparable to the theoretical work by Tamura et al.23 However, the time-resolved photoelectron spectra show that the CHD ring opened not just after photoexcitation but after 500 fs. We would like to ascribe this delayed ring-opening reaction to the ring-deformation dynamics in the 21A state after the relaxation from 3p Rydberg states. Still, we do not have any idea why only the CC band intensity increases gradually during the ring deformation. We suspect that the ionization cross sections of the MOs forming the CC band are enhanced by the strong vibronic coupling with the symmetry breaking vibrational modes provoking the ring opening reaction.11,12
In this work, we found that the excitation to the 3p Rydberg states leads to the longer time for the ring-opening reaction than that to the 11B state.11,12,19 During sliding down to the 21A potential energy surface, the absorbed photon energy is redistributed among the vibrational modes in the isolated molecules and the molecule excited to the 3p Rydberg states has more internal energy than that to the 11B state. Thus, it takes more time for the energy dissipation to reach the CI on the 21A potential energy surface compared with the excitation to the 11B state.
Estimation of the ring-opening efficiency
The quantum yield for the ring-opening reaction was estimated as follows: Fig. 4a shows that the band between 13 and 14 eV was not recovered at 1000 fs, which should be due to cZc-HT formation. We focus on the band between 13 and 14 eV, because the intensity at 607 fs, when the ring was not fully opened, was still almost the same as at 154 fs and because it was less modified by the recovery of the CC band. The reduced area at 154 fs is attributed to the depletion of the ground state of CHD. If the recovered portion at 1000 fs is attributed totally to the ground state of CHD, the quantum yield of cZc-HT is estimated to be 0.46. Here, the ionization cross section between 13 and 14 eV of cZc-HT is assumed to be zero in this estimation. So 0.46 is the minimum quantum yield for the ring-opening reaction after the two-photon excitation to the FC states of the 3p Rydberg states. On the other hand, the efficiency in the solvent45 and in gas phase by TRPES16 upon 11B excitation were 0.4 and 0.3, respectively. According to the theoretical work,46 the quantum efficiency upon 21A excitation is lower than that upon 11B. Since the initial states are different in the present case, the efficiency is not comparable. We suspect that the excess energy by photoexcitation to 3p Rydberg states promotes the ring opening deformation on the 21A potential energy surface.
Conclusions
TRPES using high harmonic pulses shed light on the detailed structural dynamics of the ring-opening processes of CHD by correlating the lower-lying MOs with particular spatial electron distributions predicted by quantum chemical calculation. Upon two-photon excitation to the FC state of 3p Rydberg states, the electronic state slides to 21A with a time constant of 37 ± 13 fs. On the 21A potential energy surface, the ring structure might be deformed to 5MR, where a CI with the ground state is located. Then, the ring-opening reaction to cZc-HT starts at ∼500 fs and finishes at ∼800 fs. The isomerization to cZt-HT or to tZt-HT proceeds upto 1.4 ps. The long-term measurement suggests further isomerization among HT isomers.Acknowledgements
This work is supported by CREST, JST. T. S. was also supported by KAKENHI (26600107, 15H03702, and 16K13854) and the Eno Science Foundation. T. T. was also supported by KAKENHI (26288001). Part of the calculations was performed on supercomputers at the Research Center for Computational Science, Okazaki, Japan.References
- C. M. Beaudry, J. P. Malerich and D. Trauner, Chem. Rev., 2005, 105, 4757–4778 CrossRef CAS PubMed.
- M. Irie, Chem. Rev., 2000, 100, 1683–1684 CrossRef CAS PubMed.
- R. B. Woodward and R. Hoffmann, Angew. Chem., Int. Ed. Engl., 1969, 8, 781–853 CrossRef CAS.
- B. C. Arruda and R. J. Sension, Phys. Chem. Chem. Phys., 2014, 16, 4439–4455 RSC.
- S. Deb and P. M. Weber, Annu. Rev. Phys. Chem., 2011, 62, 19–39 CrossRef CAS PubMed.
- H. J. C. Jacobs, J. W. J. Gielen and E. Havinga, Tetrahedron Lett., 1981, 22, 4013–4016 CrossRef CAS.
- M. Braun, W. Fuß, K. L. Kompa and J. Wolfrum, J. Photochem. Photobiol., A, 1991, 61, 15–26 CrossRef CAS.
- O. G. Dmitrenko, I. P. Terenetskayab and W. Reischl, J. Photochem. Photobiol., A, 1997, 104, 113–117 CrossRef CAS.
- S. A. Trushin, W. Fuß, T. Schikarski, W. E. Schmid and K. L. Kompa, J. Chem. Phys., 1997, 106, 9386 CrossRef CAS.
- W. Fuß, W. E. Schmid and S. A. Trushin, J. Chem. Phys., 2000, 112, 8347–8362 CrossRef.
- N. Kuthirummal, F. M. Rudakov, C. L. Evans and P. M. Weber, J. Chem. Phys., 2006, 125, 133307 CrossRef PubMed.
- K. Kosma, S. A. Trushin, W. Fuß and W. E. Schmid, Phys. Chem. Chem. Phys., 2009, 11, 172–181 RSC.
- J. L. White, J. Kim, V. S. Petrovi and P. H. Bucksbaum, J. Chem. Phys., 2012, 136, 054303 CrossRef CAS PubMed.
- V. S. Petrović, M. Siano, J. L. White, N. Berrah, C. Bostedt, J. D. Bozek, D. Broege, M. Chalfin, R. N. Coffee, J. Cryan, L. Fang, J. P. Farrell, L. J. Frasinski, J. M. Glownia, M. Gühr, M. Hoener, D. M. P. Holland, J. Kim, J. P. Marangos, T. Martinez, B. K. McFarland, R. S. Minns, S. Miyabe, S. Schorb, R. J. Sension, L. S. Spector, R. Squibb, H. Tao, J. G. Underwood and P. H. Bucksbaum, Phys. Rev. Lett., 2012, 108, 253006 CrossRef PubMed.
- V. S. Petrovic, S. Schorb, J. Kim, J. White, J. P. Cryan, J. M. Glownia, L. Zipp, D. Broege, S. Miyabe, H. Tao, T. Martinez and P. H. Bucksbaum, J. Chem. Phys., 2013, 139, 184309 CrossRef PubMed.
- S. Adachi, M. Sato and T. Suzuki, J. Phys. Chem. Lett., 2015, 6, 343–346 CrossRef CAS PubMed.
- C. C. Pemberton, Y. Zhang, K. Saita, A. Kirrander and P. M. Weber, J. Phys. Chem. A, 2015, 119, 8832–8845 CrossRef CAS PubMed.
- C.-Y. Ruan, V. A. Lobastov, R. Srinivasan, B. M. Goodson, H. Ihee and A. H. Zewail, Proc. Natl. Acad. Sci. U. S. A., 2001, 98, 7117–7122 CrossRef CAS PubMed.
- M. P. Minitti, J. M. Budarz, A. Kirrander, J. S. Robinson, D. Ratner, T. J. Lane, D. Zhu, J. M. Glownia, M. Kozina, H. T. Lemke, M. Sikorski, Y. Feng, S. Nelson, K. Saita, B. Stankus, T. Northey, J. B. Hastings and P. M. Weber, Phys. Rev. Lett., 2015, 114, 255501 CrossRef CAS PubMed.
- M. Merchán, L. Serrano-Andrés, L. S. Slater, B. O. Roos, R. McDiarmid and X. Xing, J. Phys. Chem. A, 1999, 103, 5468–5476 CrossRef.
- A. Hofmann, L. Kurtz and R. d. Vivie-Riedle, Appl. Phys. B, 2000, 71, 391–396 CrossRef CAS.
- M. Garavelli, C. S. Page, P. Celani, M. Olivucci, W. E. Schmid, S. A. Trushin and W. Fuss, J. Phys. Chem. A, 2001, 105, 4458–4469 CrossRef CAS.
- H. Tamura, S. Nanbu, T. Ishida and H. Nakamura, J. Chem. Phys., 2006, 124, 084313 CrossRef PubMed.
- A. Nenov, P. Kolle, M. A. Robb and R. d. Vivie-Riedle, J. Org. Chem., 2010, 75, 123–129 CrossRef CAS PubMed.
- T. Tsuneda, J.-W. Song, S. Suzuki and K. Hirao, J. Chem. Phys., 2010, 133, 174101 CrossRef PubMed.
- L. Nugent-Glandorf, M. Scheer, D. A. Samuels, A. M. Mulhisen, E. R. Grant, X. Yang, V. M. Bierbaum and S. R. Leone, Phys. Rev. Lett., 2001, 87, 193002 CrossRef CAS PubMed.
- P. Wernet, M. Odelius, K. Godehusen, J. Gaudin, O. Schwarzkopf and W. Eberhardt, Phys. Rev. Lett., 2009, 103, 013001 CrossRef PubMed.
- P. Wernet, Phys. Chem. Chem. Phys., 2011, 13, 16941–16954 RSC.
- M. Fushitani, A. Matsuda and A. Hishikawa, Opt. Express, 2011, 19, 9600–9606 CrossRef CAS PubMed.
- A. Makida, H. Igarashi, T. Fujiwara, T. Sekikawa, Y. Harabuchi and T. Taketsugu, J. Phys. Chem. Lett., 2014, 5, 1760–1765 CrossRef CAS PubMed.
- Handbook of HeI Photoelectron Spectra of Fundamental Organic Molecules : Ionization Energies, Ab Initio Assignments, and Valence Electronic Structure for 200 Molecules, ed. K. Kimura, Japan Scientific Societies Press, Tokyo, 1981 Search PubMed.
- R. Iikubo, T. Fujiwara, T. Sekikawa, Y. Harabuchi, S. Satoh, T. Taketsugu and Y. Kayanuma, J. Phys. Chem. Lett., 2015, 6, 2463–2468 CrossRef CAS PubMed.
- P. Villoresi, Appl. Opt., 1999, 38, 6040–6049 CrossRef CAS PubMed.
- L. Poletto, P. Villoresi, E. Benedetti, F. Ferrari, S. Stagira, G. Sansone and M. Nisoli, Opt. Lett., 2007, 32, 2897–2899 CrossRef PubMed.
- H. Igarashi, A. Makida, M. Ito and T. Sekikawa, Opt. Express, 2012, 20, 3725–3732 CrossRef PubMed.
- H. Igarashi, A. Makida and T. Sekikawa, Opt. Express, 2013, 21, 20632–20640 CrossRef PubMed.
- M. Ito, Y. Kataoka, T. Okamoto, M. Yamashita and T. Sekikawa, Opt. Express, 2010, 18, 6071–6078 CrossRef CAS PubMed.
- T. E. Glover, R. W. Schoenlein, A. H. Chin and C. V. Shank, Phys. Rev. Lett., 1996, 76, 2468–2471 CrossRef CAS PubMed.
- T. Sekikawa, T. Katsura, S. Miura and S. Watanabe, Phys. Rev. Lett., 2002, 88, 193902 CrossRef PubMed.
- M. S. Gordon and M. W. Schmidt, in Theory and Applications of Computational Chemistry, the First Forty Years, ed. C. E. Dykstra, G. Frenking, K. S. Kim and G. E. Scuseria, Elsevier, Amsterdam, 2005, ch. 41, pp. 1167–1189 Search PubMed.
- T. H. Dunning Jr., J. Chem. Phys., 1970, 53, 2823 CrossRef.
- H.-J. Werner, P. J. Knowles, G. Knizia, F. R. Manby, M. Schütz, P. Celani, T. Korona, R. Lindh, A. Mitrushenkov, G. Rauhut, K. R. Shamasundar, T. B. Adler, R. D. Amos, A. Bernhardsson, A. Berning, D. L. Cooper, M. J. O. Deegan, A. J. Dobbyn, F. Eckert, E. Goll, C. Hampel, A. Hesselmann, G. Hetzer, T. Hrenar, G. Jansen, C. Köppl, Y. Liu, A. W. Lloyd, R. A. Mata, A. J. May, S. J. McNicholas, W. Meyer, M. E. Mura, A. Nicklass, D. P. O'Neill, P. Palmieri,D. Peng, K. Pflüger, R. Pitzer, M. Reiher, T. Shiozaki, H. Stoll, A. J. Stone, R. Tarroni, T. Thorsteinsson and M. Wang, Molpro, Version 2015.1, a package of ab initio programs, 2015, see http://www.molpro.net Search PubMed.
- R. McDiarmid, A. Sabljić and J. P. Doering, J. Chem. Phys., 1985, 83, 2147–2152 CrossRef CAS.
- P. Kruit and F. H. Read, J. Phys. E: Sci. Instrum., 1983, 16, 313–324 CrossRef CAS.
- S. H. Pullen, N. A. Anderson, L. A. Walker and R. J. Sension, J. Chem. Phys., 1998, 108, 556–563 CrossRef CAS.
- A. Ohta, O. Kobayashi, S. O. Danielache and S. Nanbu, Chem. Phys., 2015, 459, 45–53 CrossRef CAS.
| This journal is © The Royal Society of Chemistry 2016 |