 Open Access Article
Creative Commons Attribution 3.0 Unported Licence
Advances in electroanalysis, sensing and monitoring in molten salts
Damion K.
Corrigan
a,
Justin P.
Elliott
a,
Ewen O.
Blair
b,
Simon J.
Reeves
a,
Ilka
Schmüser
b,
Anthony J.
Walton
b and
Andrew R.
Mount
*a
aEaStCHEM, School of Chemistry, The University of Edinburgh, King's Buildings, Edinburgh, EH9 3FJ, UK. E-mail: a.mount@ed.ac.uk
bSMC, School of Engineering, The University of Edinburgh, King's Buildings, Edinburgh, EH9 3FF, UK
First published on 11th February 2016
Abstract
Microelectrodes have a number of advantages over macroelectrodes for quantitative electroanalysis and monitoring, including reduced iR drop, a high signal-to-noise ratio and reduced sensitivity to convection. Their use in molten salts has been generally precluded by the combined materials challenges of stresses associated with thermal cycling and physical and corrosive chemical degradation at the relatively high temperatures involved. We have shown that microfabrication, employing high precision photolithographic patterning in combination with the controlled deposition of materials, can be used to successfully address these challenges. The resulting molten salt compatible microelectrodes (MSMs) enable prolonged quantitative microelectrode measurements in molten salts (MSs). This paper reports the fabrication of novel MSM disc electrodes, chosen because they have an established ambient analytical response. It includes a detailed set of electrochemical characterisation studies which demonstrate both their enhanced capability over macroelectrodes and over commercial glass pulled microelectrodes, and their ability to extract quantitative electroanalytical information from MS systems. MSM measurements are then used to demonstrate their potential for shedding new light on the fundamental properties of, and processes in, MSs, such as mass transport, charge transfer reaction rates and the selective plating/stripping and alloying reactions of liquid Bi and other metals; this will underpin the development of enhanced MS industrial processes, including pyrochemical spent nuclear fuel reprocessing.
1 Introduction
Molten salts (MSs) are a key constituent of a number of industrial processes, including metal refining,1 pyrochemical reprocessing of spent nuclear fuel,2–5 molten salt batteries6 and catalysis.7,8 Chloride melts are the MS of choice for a wide range of applications, due to their relatively low melting points and viscosities, their complexing ability, and their reduced corrosion compared to fluoride melts. A particularly intensively studied chloride system is the lithium chloride–potassium chloride eutectic (LKE) which has a relatively low melting point of 625 K at the eutectic composition (59 mol% LiCl![[thin space (1/6-em)]](https://www.rsc.org/images/entities/char_2009.gif) :
:![[thin space (1/6-em)]](https://www.rsc.org/images/entities/char_2009.gif) 41 mol% KCl), a relatively high ionic conductivity of 1.57 S cm−1 at 723 K (ref. 5) and a wide electrochemical window of 3.62 V, within which a wide range of reactions can be studied.5
41 mol% KCl), a relatively high ionic conductivity of 1.57 S cm−1 at 723 K (ref. 5) and a wide electrochemical window of 3.62 V, within which a wide range of reactions can be studied.5
As a result of its industrial importance, particularly in the nuclear sector, there has been a desire to develop analysis techniques suitable for MS systems, which address the challenges of withstanding the high temperatures and corrosive nature of the melts when they contain reactive species.9–11 Electrochemical methods have typically been practically limited to macroelectrode measurements12–20 and therefore suffer from a low signal-to-noise ratio, a time-dependent signal, iR distortion of the response and sensitivity to convection.21 These effects at best complicate and often preclude quantitative analysis. Optical spectroscopies suffer from the disadvantages of the broad emissions of many of the target analytes, difficulties in identifying multiple analytes and corrosion of sampling windows.10
When considering electroanalysis, microelectrodes can be fabricated using a number of methods and have well-established advantages under ambient conditions of high signal-to-noise ratios, and steady-state (time-invariant) and quantitative signals which are relatively insensitive to convection when compared to macroelectrodes.22,23 They have therefore been developed for ambient and near-ambient sensing applications24 and for use in the monitoring of industrial processes.25 However, there has been a significant technological barrier to the development of similar microelectrode sensors for reproducible and quantitative MS analysis and monitoring. For example, microelectrodes fabricated by drawing a wire encapsulated in glass and then exposing the end, have been employed with limited success, as this has been shown to result in initial and time-dependent variation of the response.26 The initial variability can be attributed to differences in the wire size and cross section due to variation in the wire drawing process, which as a result requires optical and/or electrochemical characterization of electrode size and shape. The time-dependent variation in the MS can be attributed to one or more of: the tendency for chemical attack of the glass, which compromises the electrode insulation; the differential thermal expansion of the microelectrode materials, which causes materials stress and cracking; and the chemical corrosion of the electrode, which can cause it to progressively recess with time. All of these effects cause a progressive change in effective electrode area and the diffusion regime, which precludes the effective deployment of microelectrodes in MS media for physicochemical analysis.
Previously, we have reported the development and characterisation of an MSM designed to overcome the above issues.21,27–29 In this study we have built on our previous work, employing our established photolithographic fabrication techniques to produce novel disc-shaped MSMs with precisely controlled dimensions and geometries. Disc microelectrodes have been chosen due to their well-established and quantitative ambient analytical response.29 We first establish whether the microelectrode response of the disc MSMs under ambient aqueous conditions is similar to other microelectrodes and then compare and contrast the performance of these devices in the LKE MS21 both with macroelectrodes and with the ambient microelectrode response. This paper has three main aims: (1) to clearly demonstrate the enhanced capabilities of the MSM in MS by benchmarking against a traditional glass pulled microelectrode, (2) to quantitate and explain the analytical response and extract physicochemical parameters in order to gain fundamental insight into the behaviour of the LKE molten salt system and (3) to investigate the potential for gaining fundamental insight into industrially relevant molten salt processes through MSM measurements. In this work we have concentrated on the characterisation of mass transport and charge transport in redox processes, along with the plating/stripping of metals and the formation of metal alloys. These are essential steps in the development of molten salt industrial processes, including pyrochemical spent nuclear fuel reprocessing, which we are developing through UK (the EPSRC REFINE programme) and EU (SACSESS programme) activities.
2 Materials and methods
2.1 Design and fabrication of the electrode devices
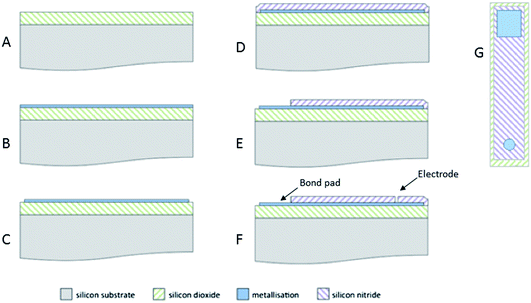
The disk MSM devices were produced using reliable, well-characterised silicon-based microfabrication processes (Fig. 1). First, a 500 nm thick layer of silicon dioxide insulation (Fig. 1A) was grown on the silicon substrate. Next, a 20 nm thick film of titanium nitride was deposited onto the surface as an adhesion layer for the electrode metal (which was either a 200 nm thick layer of tungsten or a 50 nm thick layer of platinum) (Fig. 1B). Patterning of the electrode metal layer was then achieved by reactive ion etching, using photolithographic masking to prevent the exposure of a band of metal around the perimeter of each device when diced (Fig. 1C). Subsequent deposition of a 500 nm thick layer of silicon nitride produced a top insulator (Fig. 1D), which was again patterned using photolithographic masking and reactive ion etching of the insulator to expose the bond pad (Fig. 1E) and the microelectrode (Fig. 1F). Fig. 1G shows a sketch of a completed device.2.2 High temperature measurements in LKE
Experiments using LKE were conducted at fixed temperatures within the range 673–773 K in a glassy carbon crucible sealed inside a quartz cell within a vertical tube furnace (Carbolite, Derbyshire, UK). Tungsten wire (Goodfellow, Cambridge, UK) was employed as the counter electrode with a 1% AgCl/Ag electrode used as the reference electrode. The latter was prepared by encapsulating a silver wire in LKE containing 1% by mass silver(I) chloride (Sigma Aldrich, Poole, Dorset, UK) in a mullite tube (Multilab, Newcastle upon Tyne, UK). All potentials, E, applied to the working electrodes and quoted in this paper are with respect to this reference electrode. For each experiment, anhydrous analytical grade salts of LiCl and KCl (Sigma Aldrich, Poole, Dorset, UK) were mixed at the eutectic composition (a molar ratio of 7![[thin space (1/6-em)]](https://www.rsc.org/images/entities/char_2009.gif) :
:![[thin space (1/6-em)]](https://www.rsc.org/images/entities/char_2009.gif) 5) in a glassy carbon crucible and then melted in vacuo under dry Argon to form LKE. The microelectrode (connected to a tungsten wire via a crocodile clip with the connector sealed in ceramic) was deployed through a port in the cell lid as in previous work.
5) in a glassy carbon crucible and then melted in vacuo under dry Argon to form LKE. The microelectrode (connected to a tungsten wire via a crocodile clip with the connector sealed in ceramic) was deployed through a port in the cell lid as in previous work.
2.3 Ambient aqueous benchmarking measurements
For ambient aqueous control experiments, the disc MSM was employed as the working electrode, with a saturated calomel reference electrode (SCE) and platinum gauze counter electrode. All aqueous solutions were prepared with deionised water (Millipore MilliQ). Electrochemical experiments were typically performed using background electrolyte solutions of aqueous potassium chloride (Fisher Scientific, lab reagent grade, >99% purity), with redox experiments using potassium ferricyanide, K3[Fe(CN)6] (Fisons, SLR reagent grade, >99% purity) in background electrolyte. All solutions were thoroughly degassed using pure shield argon (BOC) for at least 20 minutes prior to experimentation.All experiments in 2.2 and 2.3 were performed using a PC-controlled Autolab PGSTAT12 potentiostat (EcoChemie, Utrecht, Netherlands) and results were analysed using GPES 4.9 and NOVA 1.11 software (EcoChemie), with iterative fitting carried out using Origin 2015 (OriginLab). EIS experiments were typically carried out by applying a 10 mV rms amplitude sinusoid superimposed on the dc potential, EDC, using logarithmically spaced frequencies between 100 kHz and 0.1 Hz.
3 Results and discussion
3.1 Demonstrating the enhanced fidelity of the disc MSM
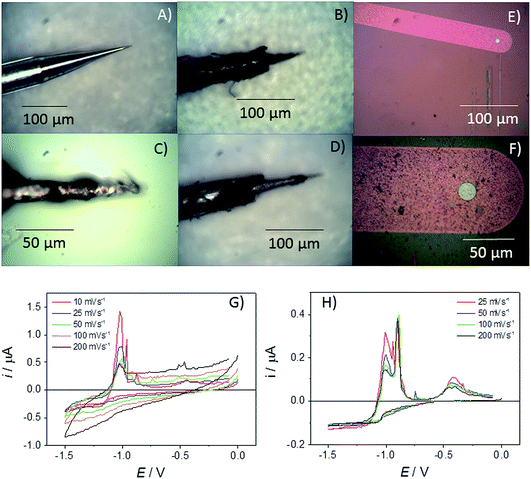
In previous work, assessments have been made for the robustness, possibilities for quantitation and measurement errors associated with ambient aqueous measurements on square MSMs.21 In terms of the measured steady-state currents, it was found that typical intra-experimental errors were relatively low, with the variation in the mass transport limiting current for one electrode in a solution of a given concentration across repeated measurements being less than 1.4%, and that for different electrodes of the same nominal edge length being less than 4.2%. In both cases these reported errors were likely to be overestimates, as the largest errors involved measurements using volatile redox couples, which results in uncertainty associated with their concentration.21 Errors from ambient studies involving glass pulled microelectrodes can be ∼10% (ref. 24) highlighting the benefit of the microfabrication approach and also the fidelity of the MSM devices in the melt. In this study, as disc MSMs have been fabricated and characterised for the first time, the response and lifetime of these MSMs in LKE is initially contrasted with a commercially available glass pulled tungsten “cone” microelectrode, which has a base diameter of the exposed cone of 26 μm (see Fig. 2A).The quantitative response of cone microelectrodes has been established as:30
| iL = 4nFDcr(1 + qHp) | (1) |
However, over the course of ten minutes in LKE these devices were observed to progressively physically deteriorate, with the etching and removal of the insulating glass seen to be the most prominent failure mechanism (see Fig. 2B–D). Thus, the exposed electrode area clearly enlarged with time. Given this, it is not surprising that the cyclic voltammograms (CVs) observed for Zn2+ reduction in LKE showed a change in response with scan rate and time (Fig. 2G). The observed increasing capacitance, and increasing and non-steady-state currents, together indicates the absence of characteristic microelectrode behaviour and an increasing exposed electrode area attributable to progressive insulator compromise. In contrast an r = 10 μm Pt MSM employed for the same measurement showed no appreciable visible deterioration and produced a stable and characteristic microelectrode response, with the zinc reduction plating currents observed at E < −0.5 V being invariant with time or sweep rate (Fig. 2H). The resulting diffusion coefficient for Zn2+ in LKE of 2.85 × 10⁻⁵ cm2 s−1, obtained from the mass transport limited current for this reduction, and the established analytical response of a disc microelectrode:
| iL = 4nFDcr | (2) |
3.2 Quantitative physicochemical parameterisation using disc MSMs and soluble redox couples in LKE MS
In chloride melts, Eu(III) has been shown to react according to the following scheme:32
| 2EuCl3 ⇌ 2EuCl2 + Cl2 |
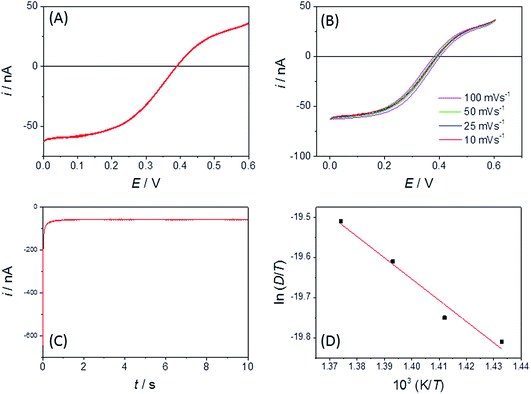
It is clear that both oxidation and reduction waves can be seen on the CV, centred around E = +0.4 V, which arise from Eu(II) and Eu(III) species respectively, which we attribute to the effects of the above reactions in LKE (actually, the proportion of Eu(III) and Eu(II) is likely to vary between experiments with the concentration of dissolved chlorine in, and/or the overall oxidising environment of, the LKE). Reassuringly, the CV has a wave-like form characteristic of a microelectrode response, along with the characteristic microelectrode sweep rate independence (Fig. 3B) (there is only a small additional capacitive current whose importance increases as expected with sweep rate, leading to a slightly increased separation between forward and backward scans). Previous work32 has shown the diffusion coefficients for Eu(III) and Eu(II) to be comparable. Assuming therefore a global diffusion coefficient, D, and taking iL as the difference in oxidation and reduction mass transport limited current and c = 19 mM, it is possible to calculate this global diffusion coefficient from eqn (2) as (5.0 ± 0.2) × 10−6 cm2 s−1 in LKE at 703 K; for any CV, the combined heights of the oxidation and reduction waves (Fig. 2A and B) or the steady-state chronoamperometric currents observed at long times when carrying out both mass transport limited oxidation and reduction (e.g.Fig. 2C) through eqn (1) can then be used to determine the concentrations of Eu(III) and Eu(II). Fig. 3D shows an Arrhenius plot of ln(D/T) vs. 1/T derived from the global diffusion coefficient data obtained using the MSMs at various temperatures (note that this plot assumes the validity of the Stokes–Einstein equation33 , where k is the Boltzmann constant, rh is the effective radius of the diffusing species and η is the viscosity of the MS, which is assumed to vary with temperature according to
  , where η0 is a constant and Ea is the activation energy). The value of Ea obtained from the slope was (43 ± 5) kJ mol−1 which shows good agreement (within error) with that reported previously (44 kJ mol−1),12 establishing the principle of disc MSM LKE activation energy measurement.
In fact, it should also be possible to extract values for D and c from analysing the shape of the chronoamperometric transients for disc MSMs. If one avoids fitting the currents obtained in the first few tens of milliseconds, where double layer charging dominates the current, Xiong et al.34 have shown satisfactory fits to the equation developed by Shoup and Szabo:35
 | (3) |
 ,
,  ,
,  and
and  for redox couples in non-aqueous solvents and ionic liquids, particularly for data recorded over the first few seconds of the transient.
Fig. 4A shows a comparable chronoamperometric transient recorded in aqueous media, when using an r = 25 μm Pt MSM to study 5 mM ferricyanide in 100 mM aqueous KCl. Consistent with Xiong et al., it is clear that a good fit of eqn (3) to the data is observed if one limits the fit to the data recorded between 0.05 s and 1 s. The adjusted R2 value was found to be 0.9988 and physically realistic values for ferrocyanide of c = 5.6 ± 0.1 mM and D = (4.2 ± 0.1) × 10−6 cm2 s−1 were obtained. Also included in the plot is a fit to eqn (4), the established equation for the transient current at a hemispherical electrode.34
 | (4) |
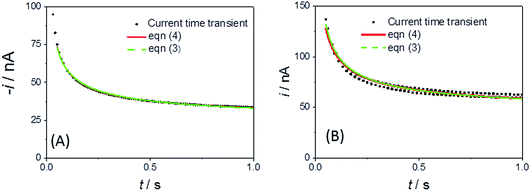 | ||
| Fig. 4 Current–time transient and fits to eqn (3) and (4) for an r = 25 μm MSM Pt disc in (A) 100 mM aqueous KCl with 5 mM ferricyanide (E jumped from +0.34 to 0.14 V at t = 0) and (B) LKE with 19 mM added EuCl3 (E jumped from +0.5 to +0.2 V at t = 0). | ||
Fig. 4B shows the typical corresponding fits to the current–time transient recorded with EuCl3 in LKE. In this case the fit to the Shoup–Szabo eqn (3) was again reasonable, with D = (4.4 ± 0.3) × 10−6 cm2 s−1, which is consistent with the global value of D, c = 9.5 ± 0.4 mM and adj. R2 = 0.9694. The fit to eqn (4) again produced comparable parameters with c = 8.7 ± 0.5 mM and D = (4.3 ± 0.3) × 10−6 cm2 s−1 and was only marginally worse with adj. R2 = 0.9655.
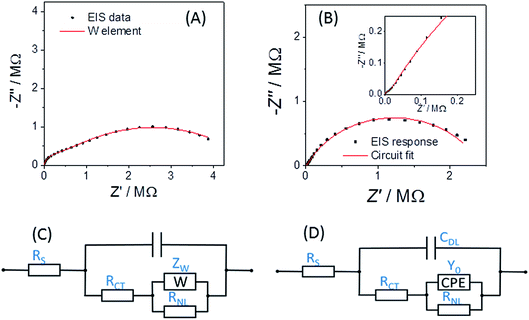
Fig. 5A shows the typical EIS response for a r = 25 μm Pt disc MSM to an aqueous 5 mM potassium ferricyanide solution at 293 K. It is reassuring that the response fits well (with χ2 = 0.002) to the established modified Randles' equivalent circuit for the disc microelectrode36–38 (Fig. 5C), confirming its applicability to ambient aqueous measurements with disc MSMs as with other disc microelectrodes.
Fig. 5B shows the corresponding response of an MSM to the Eu(III/II) couple at its formal potential in LKE solution at 703 K. For these and all other EIS LKE disc MSM data, the best fit was achieved by replacing the Warburg element with a constant phase element (CPE), which is required to fit the gradient of greater than 45° observed at higher frequencies in the Nyquist plot (see inset to Fig. 5B). The fitted values for these data were: CDL = 1.66 ± 0.02 nF; RCT = 1590 ± 50 kΩ; Q0 = (1.12 ± 0.03) × 10−7 S sn; n = 0.695 ± 0.005; RNL = 2.42 ± 0.04 MΩ, with χ2 = 0.03. It is interesting that the equivalent data recorded in the same LKE solution using a bare tungsten macrowire electrode also requires the use of a constant phase element in place of the Warburg element in the Randles' circuit, and that the fitted value of n = 0.69 ± 0.03 is the same within experimental error as that observed for the MSM in LKE. This suggests a fundamental difference in the linear diffusional properties of ambient aqueous and LKE MS solution at these frequencies. Cuervo-Reyes et al.39 have recently interpreted a diffusional CPE as being due to subdiffusive transport and local trapping of charge carriers. It is tempting to infer that some of the strong electrostatic coupling and local mobile ion trapping postulated in this work in batteries and mobile glasses may also be present to some extent in LKE MS, and that this may also be the origin of the observed CPE.
Turning to the other measured EIS parameters, we have previously shown for square ambient aqueous microelectrodes that at the formal potential of a one-electron redox couple the minimum values of the two resistances RCT and RNL should be given by:29
 | (5) |
and
 | (6) |
 | (7) |
and
 | (8) |
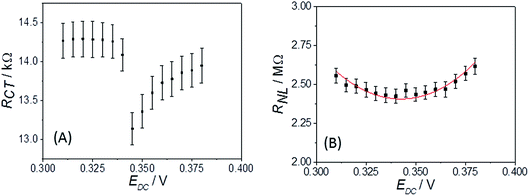
It is clear from Fig. 6B that there is good agreement between the disc MSM data and eqn (7), and the fitted value of RminNL = 2.42 ± 0.02 MΩ also agrees well with the value of 2.41 ± 0.03 MΩ calculated from the data in Fig. 3A and B using eqn (5). This indicates that the established EIS MSM theory (eqn (5)–(8)) can be used to extract quantitative information from disc MSM measurements in LKE MS. Using the observed value of RminCT = 13.1 ± 0.2 kΩ a value of k0 = 0.26 cm s−1 can be extracted from eqn (6).29 This value is two orders of magnitude faster than that previously reported in the literature for this system (3.31 × 10⁻³ cm s−1 on a glassy carbon macroelectrode).40 This is consistent with previous ambient aqueous microelectrode measurements, which have demonstrated that reduction of the dimensions of the electrode to the micron scale allows for markedly more efficient mass transport and the measurement of more realistic charge transfer rates.41 Given this, it is interesting that the RCT data (Fig. 6A) shows the predicted minimum at EDC = E0, but that these data do not fit well to eqn (8). Although the errors on these data are relatively large, this may suggest some difference between charge transfer behaviour in LKE MS and in ambient aqueous solution.
3.3 Extending the nature of disc MSM measurements – electroanalysis to characterise the formation of metal alloys
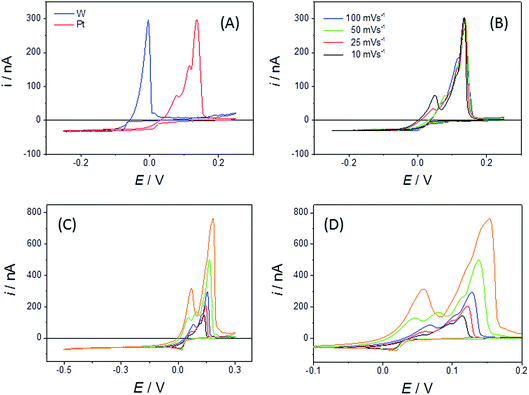
Bismuth is a metal of importance within nuclear pyrochemical processing. It melts at 271.4 °C and liquid bismuth electrodes are well known for their propensity to form alloys when electroreducing actinide and lanthanide species dissolved in LKE.42 As a result of these properties, bismuth is one of the candidates to be used as a reactive liquid metal cathode for the selective extraction of fuel species as metal alloys during the electro-refining stage of nuclear fuel reprocessing.43 In this study, our aim was to observe whether electrochemical Bi alloying reactions could be studied using the disc MSM.Fig. 7A shows typical CVs of the behaviour of the bismuth(III/0) couple on Pt and W disc MSM electrodes. When cycling the W MSM electrodes, a simple plating wave (for Bi(III) reduction and deposition) and essentially single stripping peak (for Bi(0) oxidation and dissolution) were observed, centred near E = −0.06 V. This is consistent with the phase diagram, which indicates that W and Bi do not form alloys. Using eqn (1) and the observed mass transport limited reduction current, the diffusion coefficient for Bi3+ was determined to be (6.7 ± 0.02) × 10−6 cm2 s−1 at 698 K. In contrast, the Pt MSMs showed Bi(III)/(0) plating and associated stripping electrochemistry, centred slightly above 0 V, with three identifiable, overlapping stripping peaks. It is satisfactory that there is very close agreement for the values of iL found for the Pt and W MSM electrodes (a 2.1% variation in iL, which is within the error for the devices), which demonstrates that these differences are not due to changes in n or A, but rather to the effects of Pt/Bi alloying.
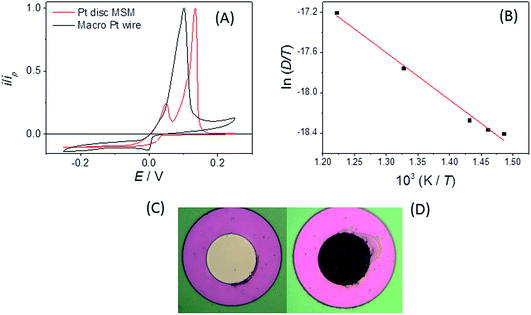
The Pt–Bi phase diagram44 indicates two thermodynamically stable solid alloy phases under these conditions (PtBi2 and PtBi), with a third state of intermediate composition (Pt2Bi3) which is thermodynamically stable above 843 K. We tentatively propose these three stripping peaks originate from stable PtBi2, metastable Pt2Bi3 and stable PtBi phases respectively; further quantitative experiments are underway to establish whether this is the case. Fig. 7B also shows that when a Pt disc MSM electrode is swept over a range of scan rates a fourth stripping peak is increasingly observed at the most cathodic potential at the slowest scan rates. This we attribute to stripping of the stable liquid metal alloy (predominantly Bi) phase expected from the phase diagram at high Bi concentrations. Additionally, Fig. 7C and D show the effect of progressively increasing the negative potential limit of the CV scan (which also increases the deposition time). In this case all peaks increase in size, consistent with increased Bi deposition and alloy formation, and unlike in Fig. 7B, the peaks shift progressively to more positive potentials, indicating the contribution of stripping kinetics at these increased coverages. That significant Bi is deposited was confirmed by visual inspection following prolonged plating (Fig. 8C and D). The maximum thickness of liquid Bi plated across the r = 25 μm Pt disc surface, at the slowest sweep rate, was calculated to be ∼9 nm. It is interesting that the reduction to bismuth metal takes place at a higher potential on the MSM than on a Pt wire macroelectrode (Fig. 8A), and distinct stripping peaks were not observed when using this macrowire, even though the calculated amount of Bi deposited per unit area was similar on each electrode. This indicates greater richness in Bi alloy characterisation information when using MSMs.
As with Eu(III)/(II) above, the values of iL observed for Bi(III) plating on the disc MSMs were used in eqn (1) to obtain Bi(III) diffusion coefficients, from which an Arrhenius plot was constructed (Fig. 8B). The resulting value of Ea = 39 ± 4 kJ mol−1 was in close agreement with that found for Eu.
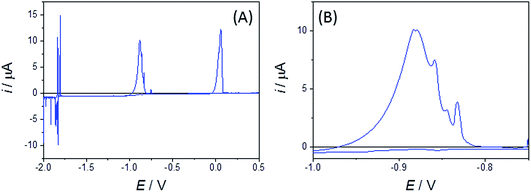
Bismuth binary and ternary alloys that do not involve Pt (of potential importance when carrying out coextraction using Bi electrodes) can also be studied by using W disc MSMs. Fig. 9 shows typical CVs for a mixed Bi(III), Zn(II) system in LKE, which shows Bi(III)/(0) plating/stripping (near E = 0 V), Zn(II)/Zn(0) plating stripping (near E = −0.9 V) and Li(I)/(0) plating/stripping (at and below E = −1.8 V). The distinct peaks observed in Li(I)/(0) plating/stripping and Zn(0) stripping features are again attributed to alloy formation, and further indicate the richness of alloying information provided by these disc MSMs.
4 Conclusions
This work has demonstrated the feasibility of fabrication of Pt and W disc MSMs and their stability in, and their potential for, quantitative characterisation of, the LKE MS system. Much of the information that can be obtained is comparable to that obtained from ambient aqueous studies using these or other disc microelectrodes, with values of E0, D, c and Ea being readily obtainable from established electrochemical methods using analysis established for aqueous systems. As with aqueous measurements, it appears that the enhanced mass transport rates at disc MSMs lead to the measurement of markedly larger and more realistic electrochemical charge transfer rate constants, k0, than those observed at macroelectrodes.In addition to these established similarities to aqueous disc MSM responses, which demonstrate the potential of disc MSMs in enhanced MS sensing, analysis and process development, there are also some interesting differences. Whilst a minimum is observed at E0 for RCT in EIS, the shape of the variation with EDC is apparently not as predicted by ambient aqueous theory. There are hints from variation in the EIS equivalent circuit that there may be a contribution from subdiffusive transport in the LKE MS, as seen previously in glass melts and Li-ion battery materials. There is also the marked enhancement of characterisation information for metal alloy formation from LKE MS compared to macroelectrodes. These measurements provide real motivation for additional study to gain further physicochemical insight into the properties of LKE and other MS systems.
Acknowledgements
The authors acknowledge financial support from, and development of this work through, the UK EPSRC REFINE project (EP/J000779/1) and the EC SACSESS (Contract No. FP7-Fission-2012-323282) and SMART Microsystems (FS/01/02/10 IeMRC Flagship) programmes. We also acknowledge EPSRC and National Nuclear Laboratory (NNL) financial support for studentships. Data used within this publication can be accessed at (http://dx.doi.org/10.7488/ds/1338).References
- G. Z. Chen, D. J. Fray and T. W. Farthing, Nature, 2000, 407, 361 CrossRef CAS PubMed.
- K. Sridharan, Thermal Properties of LiCl–KCl Molten Salt for Nuclear Waste Separation, Project No. 09-780, Nuclear Energy University Programs, US Department of Energy, 2012 Search PubMed.
- H. P. Nawada and K. Fukuda, J. Phys. Chem. Solids, 2005, 66, 647 CrossRef CAS.
- D. D. Sood and S. K. Patil, J. Radioanal. Nucl. Chem., 1996, 203, 547 CrossRef CAS.
- T. Inoue and L. Koch, Nucl. Eng. Technol., 2008, 40, 183–190 CrossRef CAS.
- K. Xu, Chem. Rev., 2004, 104, 4303 CrossRef CAS PubMed.
- D. Hamon, M. Vrinat, M. Breysse, B. Durand, M. Jebrouni, M. Roubin, P. Magnoux and T. des Courieres, Catal. Today, 1991, 10, 613 CrossRef CAS.
- G. W. Parshall, J. Am. Chem. Soc., 1972, 94, 8716 CrossRef CAS.
- S. Y. Oh, J. Y. Kim, S. E. Bae, Y. H. Cho, J. W. Yeon and K. Song, J. Lumin., 2013, 134, 706 CrossRef CAS.
- C. A. Schroll, S. Chatterjee, T. G. Levitskaia, W. R. Heineman and S. A. Bryan, Anal. Chem., 2013, 85, 9924 CrossRef CAS PubMed.
- A. Uehara, T. Nagai, T. Fujii, O. Shirai and H. Yamana, J. Nucl. Mater., 2013, 437, 166 CrossRef CAS.
- C. Caravaca, G. Cordoba and M. J. Tomas, Electrochemical study of europium trichloride in molten eutectic LiCl–KCl 2005, https://oecd-nea.org/pt/docs/iem/lasvegas04/09_Poster_Session_I/PS1_01.pdf Search PubMed.
- Y. Castrillejo, P. Herníndez, J. A. Rodriguez, M. Vega and E. Barrado, Electrochim. Acta, 2012, 71, 166 CrossRef CAS.
- G. Cordoba and C. Caravaca, J. Electroanal. Chem., 2004, 572, 145 CrossRef CAS.
- S. Ghosh, S. Vandarkuzhali, P. Venkatesh, G. Seenivasan, T. Subramanian, B. Prabhakara Reddy and K. Nagarajan, J. Electroanal. Chem., 2009, 627, 15 CrossRef CAS.
- T. J. Kim, Y. K. Jeong, J. G. Kang, Y. Jung, D. H. Ahn and H. S. Lee, J. Radioanal. Nucl. Chem., 2010, 286, 283 CrossRef CAS.
- K. Kushkhov, M. K. Vindizheva, R. A. Karashaeva and M. R. Tlenkopachev, Russ. J. Electrochem., 2010, 46, 691 CrossRef CAS.
- H. A. Laitinen, C. H. Liu and W. S. Ferguson, Anal. Chem., 1958, 30, 1266 CrossRef CAS.
- P. Masset, D. Bottomley, R. Konings, R. Malmbeck, A. Rodrigues, J. Serp and J. P. Glatz, J. Electrochem. Soc., 2005, 152, A1109 CrossRef CAS.
- B. Prabhakara Reddy, S. Vandarkuzhali, T. Subramanian and P. Venkatesh, Electrochim. Acta, 2004, 49, 2471 CrossRef.
- D. K. Corrigan, E. O. Blair, J. G. Terry, A. J. Walton and A. R. Mount, Anal. Chem., 2014, 86, 11342 CrossRef CAS PubMed.
- R. J. Forster, Chem. Soc. Rev., 1994, 23, 289 RSC.
- J. Heinze, Angew. Chem., Int. Ed., 1993, 32, 1268 CrossRef.
- M. Sosna, G. Denuault, R. W. Pascal, R. D. Prien and M. Mowlem, Sens. Actuators, B, 2007, 123, 344 CrossRef CAS.
- S. Legeai, K. k. Soropogui, M. Cretinon, O. Vittori, A. Heeren De Oliveira, F. d. r. Barbier and M. F. Grenier-Loustalot, Anal. Bioanal. Chem., 2005, 383, 839 CrossRef CAS PubMed.
- R. T. Carlin and R. A. Osteryoung, J. Electrochem. Soc., 1989, 136, 1249 CrossRef CAS.
- E. O. Blair, D. K. Corrigan, J. G. Terry, A. R. Mount and A. J. Walton, J. Microelectromech. Syst., 2015, 24, 1346 CrossRef.
- A. Relf, D. Corrigan, C. L. Brady, J. G. Terry, A. J. Walton and A. R. Mount, ECS Trans., 2013, 50, 105 CrossRef.
- H. L. Woodvine, J. G. Terry, A. J. Walton and A. R. Mount, Analyst, 2010, 135, 1058 RSC.
- C. G. Zoski and M. V. Mirkin, Anal. Chem., 2002, 74, 1986 CrossRef CAS PubMed.
- G. J. Janz and N. P. Bansal, J. Phys. Chem. Ref. Data, 1982, 11, 505 CrossRef CAS.
- S. A. Kuznetsov and M. Gaune-Escard, J. Electroanal. Chem., 2006, 595, 11 CrossRef CAS.
- A. Einstein, Ann. Phys., 1905, 17, 549 CrossRef CAS.
- L. Xiong, L. Aldous, M. C. Henstridge and R. G. Compton, Anal. Methods, 2012, 4, 371 RSC.
- D. Shoup and A. Szabo, J. Electroanal. Chem., 1982, 140, 237 CrossRef CAS.
- P. Los, G. Zabinska, A. Kisza, L. Christie, A. Mount and P. G. Bruce, Phys. Chem. Chem. Phys., 2002, 2, 5449 Search PubMed.
- P. Los and P. G. Bruce, Pol. J. Chem., 1997, 71, 1151 CAS.
- M. Fleischmann, S. Pons and J. Daschbach, J. Electroanal. Chem., 1991, 317, 1 CrossRef CAS.
- E. Cuervo-Reyes, C. P. Scheller, M. Held and U. Sennhauser, J. Electrochem. Soc., 2015, 162, A1585 CrossRef CAS.
- M. R. Bermejo, F. de la Rosa, E. Barrado and Y. Castrillejo, J. Electroanal. Chem., 2007, 603, 81 CrossRef CAS.
- I. Schmueser, A. J. Walton, J. G. Terry, H. L. Woodvine, N. J. Freeman and A. R. Mount, Faraday Discuss., 2013, 164, 295 RSC.
- M. Kurata, Y. Sakamura and T. Matsui, J. Alloys Compd., 1996, 234, 83 CrossRef CAS.
- W. Dong, X. Yang, J. Zhang and J. Sheng, J. Mater. Sci., 2008, 43, 3240 CrossRef CAS.
- H. Okamoto, J. Phase Equilib., 1991, 12, 207 CrossRef CAS.
| This journal is © The Royal Society of Chemistry 2016 |

