DOI:
10.1039/C5FD00225G
(Paper)
Faraday Discuss., 2016,
188, 387-398
Methanol oxidation on Fe2O3 catalysts and the effects of surface Mo
Received
15th December 2015
, Accepted 22nd December 2015
First published on 6th January 2016
Abstract
The adsorption of methanol on haematite has been investigated using temperature programmed methods, combined with in situ DRIFTS. Model catalysts based on this material have then been made with a shell–core configuration of molybdenum oxide monolayers on top of the haematite core. These are used as models of industrial iron molybdate catalysts, used to selectively oxidise methanol to formaldehyde, one of the major chemical outlets for methanol. Haematite itself is completely ineffective in this respect since it oxidises it to CO2 and the DRIFTS shows that this occurs by oxidation of methoxy to formate at around 200 °C. The decomposition behaviour is affected by the absence or presence of oxygen in the gas phase; oxygen destabilises the methoxy and enhances formate production. In contrast, when a monolayer of molybdena is placed onto the surface by incipient wetness, and it remains there after calcination, the pathway to formate production is blocked and formaldehyde is the main gas phase product in TPD after methanol dosing.
Introduction
This paper concerns the adsorption and reaction of methanol with iron oxide (haematite) and model catalysts of Mo monolayers deposited on that oxide. This is of importance for a variety of reasons. Firstly, iron oxide is one on the most abundant materials readily available on earth and so represents an interesting base material for catalysis from both an economic and environmental point of view. Due to its abundance it is relatively cheap and environmentally cleaner as it is usually mined from near the surface of the earth, therefore little energy is wasted in separation and refining, in contrast to the situation for precious metals. It is also used in a variety of catalytic applications, such as ammonia synthesis, the high temperature water-gas shift reaction (HTWGS), Fischer–Tropsch synthesis of hydrocarbons and styrene synthesis by ethyl benzene dehydrogenation.1–4 It must be noted, however, that in the active phase of ammonia synthesis it is in metallic form, in FTS, it is probably carbidic, while in HTWGS, although prepared as haematite, it is in the magnetite form during reaction. However, it is also used as part of the process for the selective oxidation of methanol, which consists of iron in compound form with molybdenum5 and in its ferric state. In connection with the latter, we are interested in the way in which methanol interacts not only with iron oxide, but as we report below, we have investigated also model methanol oxidation catalysts by placing monolayers of Mo at the surface. We report the changes in behaviour of reactivity and surface species formed when such model catalysts are fabricated using temperature programmed methods and DRIFTS.
Experimental
The Fe2O3 catalyst used in this study was a commercial Fe2O3 (Sigma-Aldrich, <50 nm particle size). A catalyst of the type MoOx/Fe2O3 was synthesised by doping 6 monolayer equivalents of Mo oxide onto the Fe2O3. The desired amount of aqueous ammonium heptamolybdate was dosed onto the surface of the Fe2O3 by incipient wetness impregnation. The sample was dried at 120 °C for 24 h, before being calcined in a muffle furnace in air at 500 °C, for 24 h.
Reactor data was obtained by use of a CATLAB reactor (Hiden Ltd, Warrington, U.K.). For the catalytic reaction (TPO/TPR), 1 μL of liquid methanol was injected every 2 min into a flow of 10% O2/He or He, at a flow rate of 30 mL min−1. The products were determined by the online mass spectrometer in the CATLAB system. For the TPD, approximately 6 injections of 1 μL of methanol were dosed onto the catalyst, at ambient temperature in a flow of 30 mL min−1 of 10% O2/He or He. This was followed by ramping the temperature to 400 °C at a rate of 8 °C min−1, while monitoring the products formed by mass spectrometry.
In situ diffuse reflectance infrared Fourier transform spectroscopy (DRIFTS) was performed in a Harrick high temperature DRIFTS cell fitted with ZnSe windows. The cell was attached to the Praying Mantis Optics and spectra collected with an Agilent Carey 680 FTIR spectrometer, taking 64 scans with a resolution of 4 cm−1 using the DTGS detector. The TPD and TPO experiments were performed by injecting approximately 5 injections of 1 μL of methanol at ambient pressure in a flow of 30 mL min−1 of 10% O2/He or He. The temperature was then ramped at 10 °C min−1 while collecting spectra every 15 °C.
Results and discussion
Fig. 1 shows TPD data from the adsorption of methanol on the iron oxide catalyst. A simple pattern is observed, and is similar to that reported by us previously.6 That is, weakly held methanol is desorbed at low temperatures, with a maximum at 100 °C. This is then followed by a major desorption at around 300 °C, when both CO2 and hydrogen desorb, though the line-shapes for the two are a little different. The hydrogen shows a shoulder (at ∼250 °C) on the main peak at 300 °C, while the CO2 appears to be a single peak at ∼305 °C. As reported previously6–8 this desorption is likely to be due to the presence of a formate species on the surface. This is confirmed by the in situ TPDRIFT (temperature-programmed diffuse reflectance infra-red Fourier transform) spectra in Fig. 2, but additionally here we can identify the temperature range in which the formate is formed. Upon adsorption we see a variety of bands due to a mixture of methanol and methoxy, but after heating to ∼100 °C, we are left with just methoxy bands at 1070, 2827 and 2937 cm−1 (Table 1). Upon heating above about 175 °C, formate bands (1569, 1377, 1358 and 2866 cm−1, Table 1 and references therein) start to appear and methoxy is slowly lost, leaving mainly formate at 325 °C. Thus the formate is present on the surface before the desorption of CO2, but is not present upon adsorption, so it is formed during the heating process. Most of the hydrogen desorption is clearly from the methoxy decomposition, the methoxy loss rate from the IR data being maximised at ∼250 °C (Fig. 3), beginning at ∼200 °C and being 80% diminished by 300 °C. Thus it appears that the low temperature shoulder on the hydrogen curve in Fig. 1 is associated with the methoxy decomposition, but the maximum in hydrogen evolution occurs well after most of the methoxy has been lost.
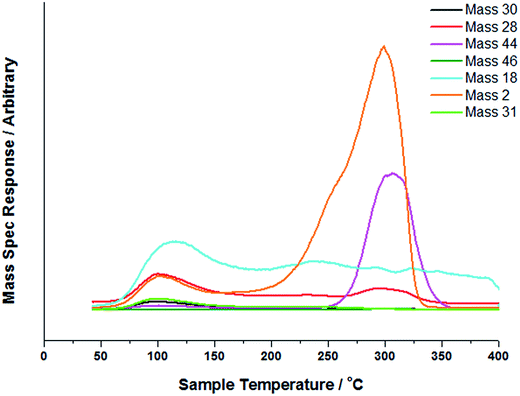 |
| | Fig. 1 TPD profile of Fe2O3 under a 8 °C min−1 ramp in a flow of He after methanol adsorption. | |
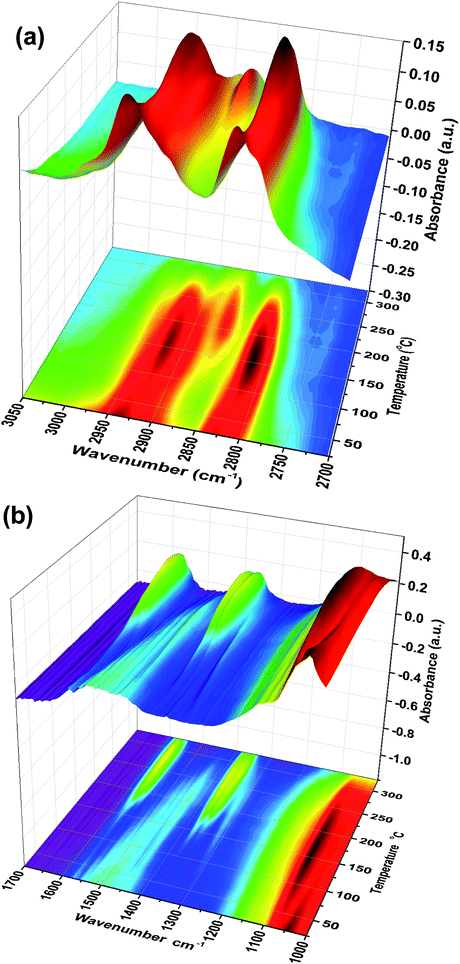 |
| | Fig. 2 Stacked TPDRIFTS spectra under He, in the (a) 2700–3050 cm−1 and (b) 1000–1700 cm−1 range. | |
Table 1 Assignments for the bands observed in the DRIFTS experiments, a bands observed above ∼150 °C, b bands observed above 175 °C
| Assignment |
Methoxy9 (cm−1) |
Methanol9 (cm−1) |
Formate10 (cm−1) |
This work, above 100 °C, (cm−1) |
| TPD |
TPO |
|
ν
as(COO) + δ(CH) |
|
|
2960 |
2960b |
2964a |
|
ν
s(CH) |
2898 |
2925 |
2880 |
2922, 2895, 2866b |
2923, 2895, 2864a |
| 2δ(CH3) |
2805 |
2824 |
|
2816 |
2818, 2808 |
|
ν
s(COO) + δ(CH) |
|
|
2730 |
2734b |
2734a |
|
ν
as(COO) |
|
|
1565 |
1569b |
1571a |
|
δ(CH) |
δ
as(CH) 1460, δs(CH) 1439 |
1379 |
1377b |
1376a |
|
ν
s(COO) |
|
|
1358 |
1358b |
1355a |
|
ν(CO)11 |
1070 |
1036 |
|
1073 |
1070 |
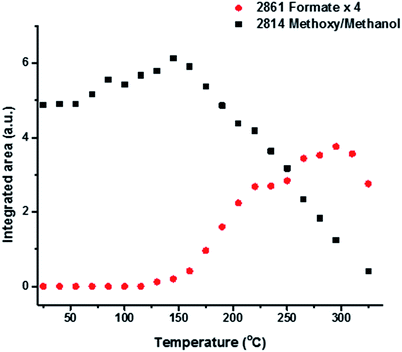 |
| | Fig. 3 Integrated intensities of the main bands due to methoxy and formate species on the iron oxide surface as a function of temperature during TPD of methanol under a flow of He. | |
One thing which is immediately obvious from the TPD data is that very little water is evolved from the catalyst during the experiment, and this is unusual for oxidic catalysts: for instance, similar experiments with MoO3 yield water and no hydrogen ((ref. 6 and 7) and see below). This further implies that hydrogen has difficulty extracting oxygen from the iron oxide lattice in these circumstances, a feature which is an obvious advantage when considering a reaction such as the water-gas shift reaction in the forward direction, eqn (1). Iron oxide is the catalyst for the high temperature shift reaction,1 though under operating conditions it is thought to be present in the form of magnetite.
Fig. 4 shows a similar TPD experiment, but this time it is run in a flow of O2/He, effectively TPO, temperature-programmed oxidation. The results are rather revealing and different from those in Fig. 1. Here we still have the major CO2 evolution at ∼300 °C, but there is little hydrogen coincident with it. Instead the hydrogen evolution is now shifted down to ∼200 °C and appears to be independent of CO2 evolution. There is also water desorbing in a rather broad band of peaks from ∼100–300 °C, and a small CO evolution at about 270 °C (mass 28 for CO is a cracking fragment of mass 44 for CO2, but the lineshape of the two here is different). The IR data are shown in Fig. 5 and 6. In Fig. 6 the same main bands are seen as in Fig. 2, that is, the formate and the methoxy, but now the ratio of these two IR bands is different, with much more formate formed. Further, the main hydrogen evolution appears to relate to the methoxy decomposition: the highest rate of loss of methoxy in IR (Fig. 6) is at about 190 °C, corresponding with the peak in the TPD. The methoxy peak is lost in IR by about 250 °C, corresponding with the end of the main hydrogen desorption. Similarly the formate band in IR is maximised at about the same temperature (∼300 °C) as the CO2 desorption.
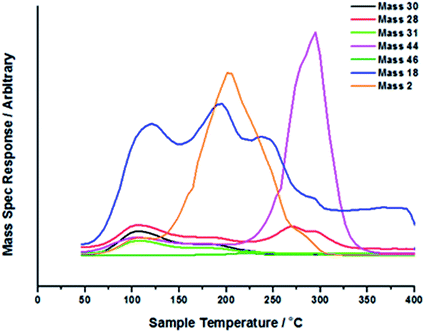 |
| | Fig. 4 TPD profile of Fe2O3 under a 8 °C min−1 ramp in a flow of 10% O2/He after methanol adsorption. | |
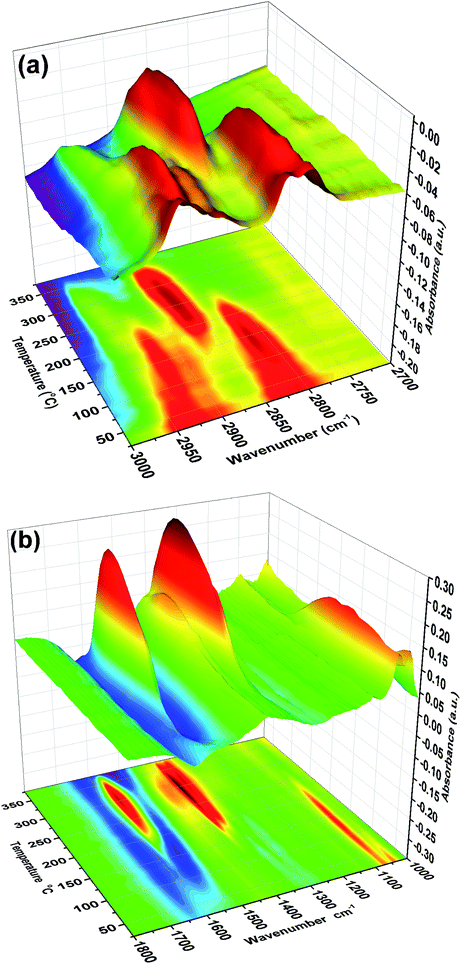 |
| | Fig. 5 Stacked TPDRIFTS under 10% O2/He spectra in the (a) 2700–3000 cm−1 and (b) 1000–1800 cm−1 range. | |
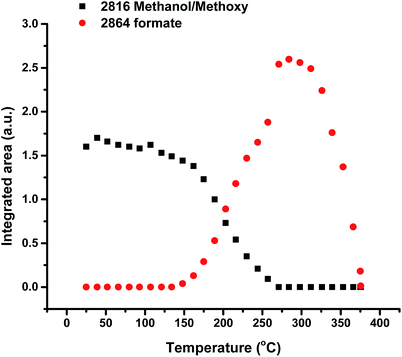 |
| | Fig. 6 Integrated intensities of the main bands due to methoxy and formate species on the iron oxide surface as a function of temperature during TPD of methanol under a flow of 10% O2/He. | |
Experiments were carried out with the pulsed flow reactor described in the experimental section, and the data are displayed in Fig. 7, as a plot of the integrals of products as a function of temperature. In this situation, where only methanol is present during pulses into the He flow, the product profile is broadly similar to the results of the transient TPD experiments above. Here there is some hydrogen production, but the products are predominantly those of combustion, with methanol conversion beginning at around 160 °C, reaching 50% conversion by ∼220 °C and 100% by ∼260 °C. The first product is that of dehydration, dimethyl ether (46 amu), together with water. This occurs at low conversion, maximising at 200 °C, but with high selectivity at these low conversions. This is followed by CO and H2 seen between 220–300 °C (28 and 2 amu peaks at that point), and with CO2 and H2O becoming dominant above 250 °C. At the highest temperatures there is also some methane production, beginning at about 350 °C (increase in 16 amu, while carbon dioxide decreases). Clearly, since there is significant water production here, we must be reducing the iron oxide catalyst and labilising oxygen from subsurface regions. In the TPD experiment of Fig. 1 this does not occur, but, of course, methanol is not present in the gas phase during those experiments, and is only adsorbed on the surface layer.
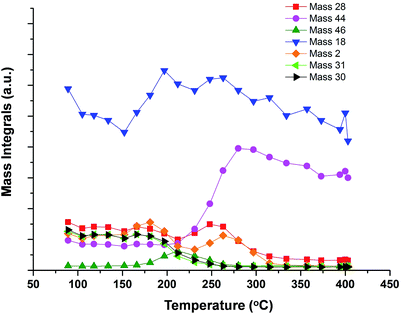 |
| | Fig. 7 TPPR (temperature-programmed pulsed reaction) profiles for methanol pulses into a flow of He. | |
If the same experiment is carried out in aerobic conditions, in a flow of 10% O2/He (Fig. 8), the results are broadly similar, but conversion is shifted to somewhat lower temperature and there is reduced hydrogen production.
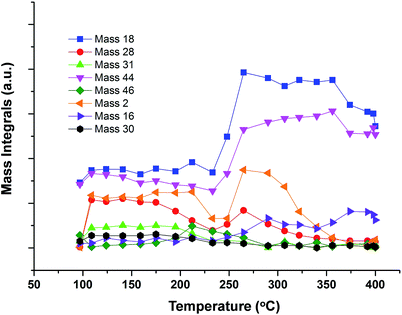 |
| | Fig. 8 TPPR (temperature-programmed pulsed reaction) profiles for methanol pulses into a flow of 10% O2/He. | |
Clearly then, the following series of reactions takes place on the haemetite surface.
where the subscript a refers to adsorbed species and S is an adsorption site.
| | | CH3OHa + S → CH3Oa + Ha | (3) |
| | | CH3Oa + CH3OH → CH3OCH3 + OHa | (4) |
The reason for writing DME production in this form, that is, the reaction of surface methoxy with gas phase methanol, is that (i) DME production ceases in Fig. 7 when methanol conversion is very high (i.e. little methanol in the gas phase) and (ii) we see no DME in the TPD experiments, where there is no gas phase methanol dosed during the temperature ramp. The other reactions are:
| | | CH3Oa + Osl → HCOOa + 2Ha | (5) |
Here Osl refers to lattice oxygen in the iron oxide, but which is at the surface and so available for reaction (and intrinsically different from lattice oxygen in the bulk). It is formed from the IR experiments during the temperature ramp above 150 °C. The formate can then decompose as follows:
and the liberated hydrogen then has two possible routes to loss from the surface, recombination to gas phase hydrogen or reaction with surface hydroxyls to give water.
Finally it also appears that once the surface has become sufficiently reduced, methane can be evolved into the gas phase, presumably by a deoxygenation reaction with anion vacancies at the surface:
| | | CH3OH + VO2− → CH4 + Osl | (9) |
From these various data we can get an idea of the reaction kinetics involved here. If we first examine the formate decomposition, step 6, we can analyse the leading edge in Fig. 1 to give an activation energy of 128 kJ mol−1. We can obtain the formation kinetics for the formate from the curve in Fig. 6 between 10 and 20 minutes reaction time (∼120–220 °C) before formate decomposition occurs, and that value is 60 kJ mol−1. For the anaerobic experiments the surface ends up in a reduced state, since CO2 is a product, so, at least in the surface region, the overall reaction in the absence of gas phase oxygen is
| | | CH3OH + Os → CO2 + 2H2 + Ov | (10) |
and clearly the dominant process in the TPD of
Fig. 1 is hydrogen evolution, also seen in
Fig. 4. However, in these cases methanol was not present in the gas phase during the TPD.
Fig. 7 and
8 also show that when methanol is present in the gas phase, then water production dominates above 300 °C, though some hydrogen is produced at intermediate temperatures. So H
2 can apparently reduce the sample under these conditions:
We have gone on to make model catalysts related to industrial formaldehyde synthesis catalysts, which are iron molybdates.6 These convert methanol by selective oxidation, with high selectivity. We have deposited monolayers of Mo on the surface of iron oxide, because then otherwise bulk spectroscopic techniques (such as XAS12,13) can be used to give surface information, if they are sensitive to Mo. When Mo is deposited onto the surface of the iron oxide there is a complete change of behaviour from that described above. TPD results reported in ref. 13 show that the main product is now formaldehyde, with no CO2 produced. Similarly, reactor results (not shown, but see ref. 6 and 8) show high selectivity to formaldehyde in the temperature range 200 to 350 °C. This in itself shows that once Mo is deposited onto the surface it remains there after calcination, and repeated TPD experiments are reproducible. Spectroscopy and electron microscopy confirm such surface stability.12,13 The TPD alone implies that the methoxy species dominates the surface and that dehydrogenation of this species yields the formaldehyde. This is confirmed from TPDRIFTS studies, Fig. 9, which show only the presence of methoxy on the surface after the adsorption of methanol. This methoxy species is lost at approximately the same temperature as the formaldehyde peak appears in the TPD.13 No conversion to formate species is observed over these catalysts. Thus the presence of Mo appears to block step 5 above.
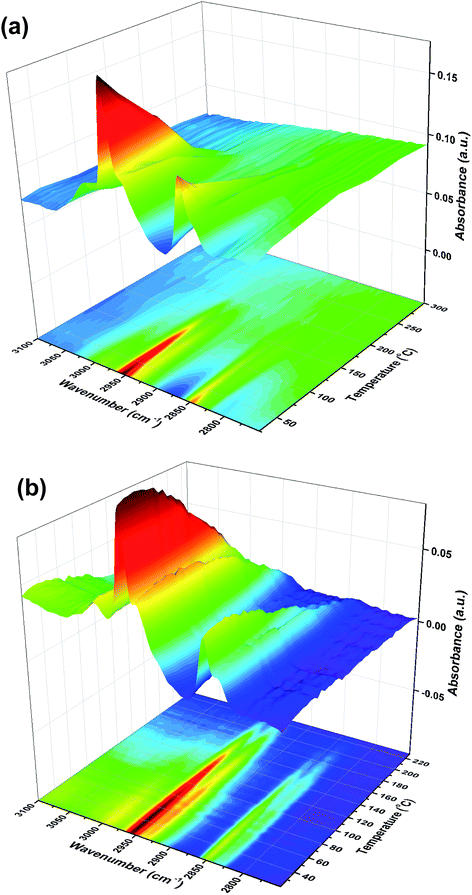 |
| | Fig. 9 Stacked TPDRIFTS under (a) He and (b) 10% O2/He after adsorption of methanol on 6 monolayers of molybdena on Fe2O3. | |
Conclusions
Model catalysts of haematite and shell/core molybdena/haematite have been produced and their interaction with methanol examined. Haematite is shown to convert methanol into adsorbed methoxy, which is then oxidised to formate, the intermediate to combustion. In contrast, when dosed with surface Mo, the material becomes very selective to formaldehyde production and the formate pathway is blocked. Such materials, then, can make very useful model catalysts for answering a number of questions about catalytic behaviour.
Acknowledgements
The UK Catalysis Hub is kindly thanked for resources and support provided via our membership of the UK Catalysis Hub Consortium and funded by EPSRC (portfolio grants EP/K014706/1, EP/K014668/1, EP/K014854/1, EP/K014714/1, and EP/I019693/1) and to Diamond plc for support for a studentship to CB.
References
- C. Rhodes, G. J. Hutchings and A. M. Ward, Catal. Today, 1995, 23, 43 CrossRef CAS.
- A. Y. Khodakov, W. Chu and P. Fongarland, Chem. Rev., 2007, 107, 1692 CrossRef CAS PubMed.
- N. Mimura and M. Saito, Catal. Today, 2000, 55, 173 CrossRef CAS.
- I. D. Gonzalez-Jimenez, K. Cats, T. Davidian, M. Ruitenbeek, F. Meirer, Y. Liu, J. Nelson, J. C. Andrews, P. Pianetta, F. M. F. de Groot and B. M. Weckhuysen, Angew. Chem., Int. Ed., 2012, 51, 11986 CrossRef CAS PubMed.
- A. P. V. Soares, M. F. Portela and A. Kiennemann, Catal. Rev., 2005, 47, 125 CAS.
- M. Bowker, R. Holroyd, A. Elliott, A. Alouche, C. Entwistle and A. Toerncrona, Catal. Lett., 2002, 83, 165 CrossRef CAS.
- M. P. House, A. F. Carley, R. Echeverria-Valda and M. Bowker, J. Phys. Chem. C, 2008, 112, 4333 CAS.
- M. Bowker, C. Brookes, A. F. Carley, M. P. House, M. Kosif, G. Sankar, I. Wawata, P. P. Wells and P. Yaseneva, Phys. Chem. Chem. Phys., 2013, 15, 12056 RSC.
- G. Busca, J. Lamotte, J.-C. Lavalley and V. Lorenzelli, J. Am. Chem. Soc., 1987, 109, 5197 CrossRef CAS.
- L. J. Burcham, L. E. Briand and I. E. Wachs, Langmuir, 2001, 17, 6175 CrossRef CAS.
- A. Glisenti, G. Favero and G. Granozzi, J. Chem. Soc., Faraday Trans., 1998, 94, 173 RSC.
- C. Brookes, P. P. Wells, G. Cibin, N. Dimitratos, W. Jones and M. Bowker, ACS Catal., 2014, 4, 243 CrossRef CAS.
- C. Brookes, P. P. Wells, N. Dimitratos, W. Jones, E. K. Gibson, D. J. Morgan, G. Cibin, C. Nicklin, D. Mora-Fonz, D. O. Scanlon, C. R. A. Catlow and M. Bowker, J. Phys. Chem. C, 2014, 118, 26155 CAS.
|
| This journal is © The Royal Society of Chemistry 2016 |
Click here to see how this site uses Cookies. View our privacy policy here.  Open Access Article
 ad and
C.
Brookes
ab


