 Open Access Article
 This Open Access Article is licensed under a
 Creative Commons Attribution 3.0 Unported Licence
A unified view on heterogeneous and homogeneous catalysts through a combination of spectroscopy and quantum chemistry†
Dimitrios
Maganas
a,
Annette
Trunschke
b,
Robert
Schlögl
*ab and
Frank
Neese
*a
aMax Planck Institute for Chemical Energy Conversion, Stiftstr. 34-36, D-45470 Mülheim an der Ruhr, Germany. E-mail: Frank.Neese@cec.mpg.de; rs01@fhi-berlin.mpg.de
bFritz-Haber Institut, Faradayweg 4-6, 14195 Berlin, Germany
First published on 4th January 2016
Abstract
Identifying catalytically active structures or intermediates in homogeneous and heterogeneous catalysis is a formidable challenge. However, obtaining experimentally verified insight into the active species in heterogeneous catalysis is a tremendously challenging problem. Many highly advanced spectroscopic and microscopic methods have been developed to probe surfaces. In this discussion we employ a combination of spectroscopic methods to study two closely related systems from the heterogeneous (the silica-supported vanadium oxide VOx/SBA-15) and homogeneous (the complex K[VO(O2)Hheida]) domains. Spectroscopic measurements were conducted strictly in parallel for both systems and consisted of oxygen K-edge and vanadium L-edge X-ray absorption measurements in conjunction with resonance Raman spectroscopy. It is shown that the full information content of the spectra can be developed through advanced quantum chemical calculations that directly address the sought after structure–spectra relationships. To this end we employ the recently developed restricted open shell configuration interaction theory together with the time-dependent theory of electronic spectroscopy to calculate XAS and rR spectra respectively. The results of the study demonstrate that: (a) a combination of several spectroscopic techniques is of paramount importance in identifying signature structural motifs and (b) quantum chemistry is an extremely powerful guide in cross connecting theory and experiment as well as the homogeneous and heterogeneous catalysis fields. It is emphasized that the calculation of spectroscopic observables provides an excellent way for the critical experimental validation of theoretical results.
Introduction
The impact of heterogeneous catalysis on industrial scale processes hardly needs to be emphasized. In fact the majority of catalytic processes that are implemented on a large-scale industrial basis, are based on heterogeneous catalysis.1 Developing new catalysts that are efficient, stable and selective is a major challenge. Rather than finding such systems through trial and error, one would hope to take a rational approach that is based on a detailed understanding of the catalytic mechanism. To achieve the latter requires obtaining insight into the reactive species that exist on surfaces under in operando conditions.2Theoretical calculations are in very widespread use in order to obtain insight into heterogeneous catalysts. The theoretical treatment of surfaces and solids is strongly dominated by the method of density functional theory (DFT).3 While this method has definite and important strengths and advantages, it also suffers from some significant shortcomings, as will be elaborated below. In many cases the connection between theory and experiment is rather indirect. For example, volcano plots are frequently used to correlate structure and reactivity by connecting substrate binding energies at ideal surfaces with kinetic rates.4,5 Due to several strong assumptions needed for the connection between thermodynamics, kinetics and mechanism, the necessity for a more immediate connection between theory and experiment emerges. It is the aim of this paper to emphasize that such strong ties between theory and experiment can be established by combining a range of spectroscopic methods with the results of carefully calibrated theoretical spectroscopy.
Combined experimental and theoretical multi-method protocols have been used to great advantage in (bio)inorganic chemistry and catalysis. For example, a theoretical spectroscopy approach has proven instrumental in characterizing exotic reactive species in model systems (e.g. genuine Fe(V)6 and the first Fe(VI) complex7), enzymes8–10 (e.g. the identification of a unique carbide center in the active site of the dinitrogen activating enzyme nitrogenase11), or in clarifying the structure12 and oxidation states13 of the oxygen evolving complex in photosynthesis. It should be emphasized that in order to successfully apply a theoretical spectroscopy approach, it is of utmost importance that the theoretical methods are properly calibrated, that is, the error bars of the theoretical predictions must be known from studying a series of known and understood systems. Hence, all predictions of theoretical methods are only valid within the confidence intervals defined by the calibration procedure. All contemporary calculations of homogeneous and heterogeneous systems likewise are afflicted with methodological errors and errors stemming from the inevitable oversimplification of real systems. It is for this reason that one is well advised to connect theory with as many spectroscopic experiments as one can possibly obtain. It should be emphasized that, once broad agreement between theory and experiment has been achieved, one can: (a) cross correlate structure–spectra relationships between vastly different experimental methods and (b) obtain experimentally calibrated insight into not only the geometric but also the all-important electronic structure of the systems under investigation. The latter is instrumental for obtaining deep insight into the reactivity of the system. This might be impressively exemplified with the case of the reactive Fe(IV)–oxo (FeO)2+ core, the complex reactivity of which might well be considered as understood.9,10
In this work, we will try to establish a strong connection between the domains of homogeneous and heterogeneous catalysis by using parallel spectroscopic protocols for a heterogeneous system, namely silica supported vanadia catalysts,14,15 and a closely related homogeneous system, the coordination complex K[VO(O2)Hheida]. The chemical importance of these systems is presented in the ESI† while representative structures are shown in Fig. 1.
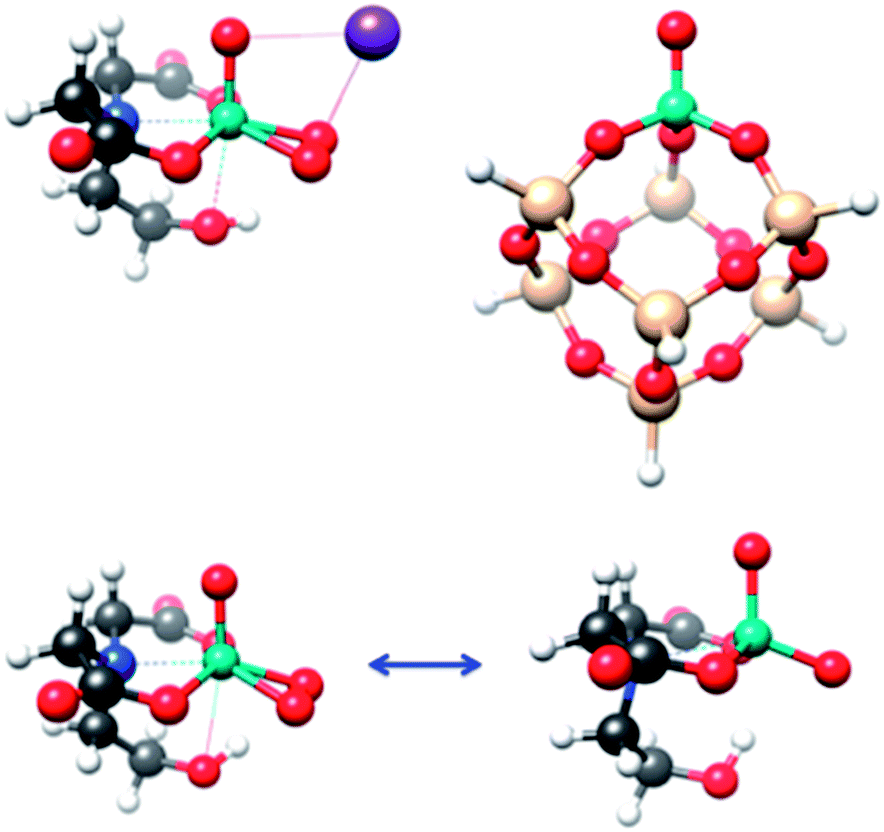 | ||
| Fig. 1 Top left: The molecular structure of K[VO(O2)Hheida]. Top right: Representative model structure of monomeric silica supported vanadia catalyst, VSi7H7O13. Bottom: Two possible active forms of the molecular catalyst; [VO(O2)Hheida]− (left) and oxygen deficient [VO(O)Hheida]− (right). Atom colouring: H (white), C (gray), O (red), N (blue), V (cyan), Si (light yellow) and K (purple). | ||
The experimental methods that were chosen for the current study involve vanadium L-edge and oxygen K-edge X-ray absorption (XAS) spectroscopy, absorption (ABS) and resonance Raman (rR) spectroscopy. The theoretical methodology required to calculate L-edge XAS and rR spectra is not part of the standard arsenal of theoretical solid state physics or quantum chemistry. In fact, both techniques require extensive method development. In particular, the field of L-edge spectroscopy cannot be successfully approached on the basis of DFT at all. Hence, our theoretical approaches deviate strongly from the currently employed DFT methods in that they are largely based on ideas from wavefunction-based ab initio quantum chemistry. We emphasize the properties of the N-particle states of the system (N being the number of electrons) in favour of the ubiquitous one-particle (orbital) picture that is implied by interpretation based on DFT. The drawback of focusing on wavefunction approaches is that truly periodic calculations are not available for the approaches that we are using. The next best alternative, that we follow, is to employ embedded clusters. Once the clusters are sufficiently large, the results of the periodic calculations are approached. However, convergence with cluster size is an issue that must be carefully monitored. Fortunately, cluster calculations with a few hundred atoms are feasible with modern hard- and software technologies such that the limitations of using cluster models are not nearly as severe as they were in the past.
We have recently introduced the restricted open shell configuration interaction singles (ROCIS) method as a method of general applicability to interpret metal L-edge spectra of a large class of molecules, ranging from mononuclear complexes up to polymetallic clusters.16–19 The method is able to predict metal L-edge spectra for a variety of metal complexes in different oxidation states and coordination environments. In addition it has been calibrated for a large set of vanadium mononuclear complexes and has proven successful in interpreting V L-edge and O K-edge spectra of V2O5 (ref. 16) as well as the Ti L-edge spectra of TiO2 (rutile and anatase) and Ca L-edge spectra of CaF2 solids.20 Furthermore, we have also presented a highly efficient method to treat the band-shape of optical absorption spectra and resonance Raman spectra for large molecules.21,22
Experimental section
Synthesis
VOx/SBA-15 catalysts (V loading of 2–14% wt%/0.6–13.7 V-atoms nm−2) were prepared by an ion-exchange approach as described elsewhere.23 Further details regarding spectroscopic characterization and theoretical calculations are summarized in the ESI.†Spectroscopic data
The absorption spectrum of K[VO(O2)Hheida] is presented in Fig. 2. It is characterized by a low energy and a broad signal located at 26![[thin space (1/6-em)]](https://www.rsc.org/images/entities/char_2009.gif) 000 cm−1, as well as by a higher energy shoulder showing a maximum at 34000 cm−1. This later signal grows at the rising edge of an even broader and partially saturated signal centered at 45000 cm−1. On the other hand the absorption spectrum of VOx/SBA-15 (vanadium loading 2% and 8%) is presented in Fig. S2.† It is characterized by a low energy shoulder located at 25000 cm−1 followed by a high-energy broad signal centered at about 40000 cm−1. It should be noted that the absorption spectra show pronounced changes at low vanadium loadings, in fact the spectrum manifold shifts to higher energies as the vanadium loading decreases. This phenomenon merits further investigation.
000 cm−1, as well as by a higher energy shoulder showing a maximum at 34000 cm−1. This later signal grows at the rising edge of an even broader and partially saturated signal centered at 45000 cm−1. On the other hand the absorption spectrum of VOx/SBA-15 (vanadium loading 2% and 8%) is presented in Fig. S2.† It is characterized by a low energy shoulder located at 25000 cm−1 followed by a high-energy broad signal centered at about 40000 cm−1. It should be noted that the absorption spectra show pronounced changes at low vanadium loadings, in fact the spectrum manifold shifts to higher energies as the vanadium loading decreases. This phenomenon merits further investigation.
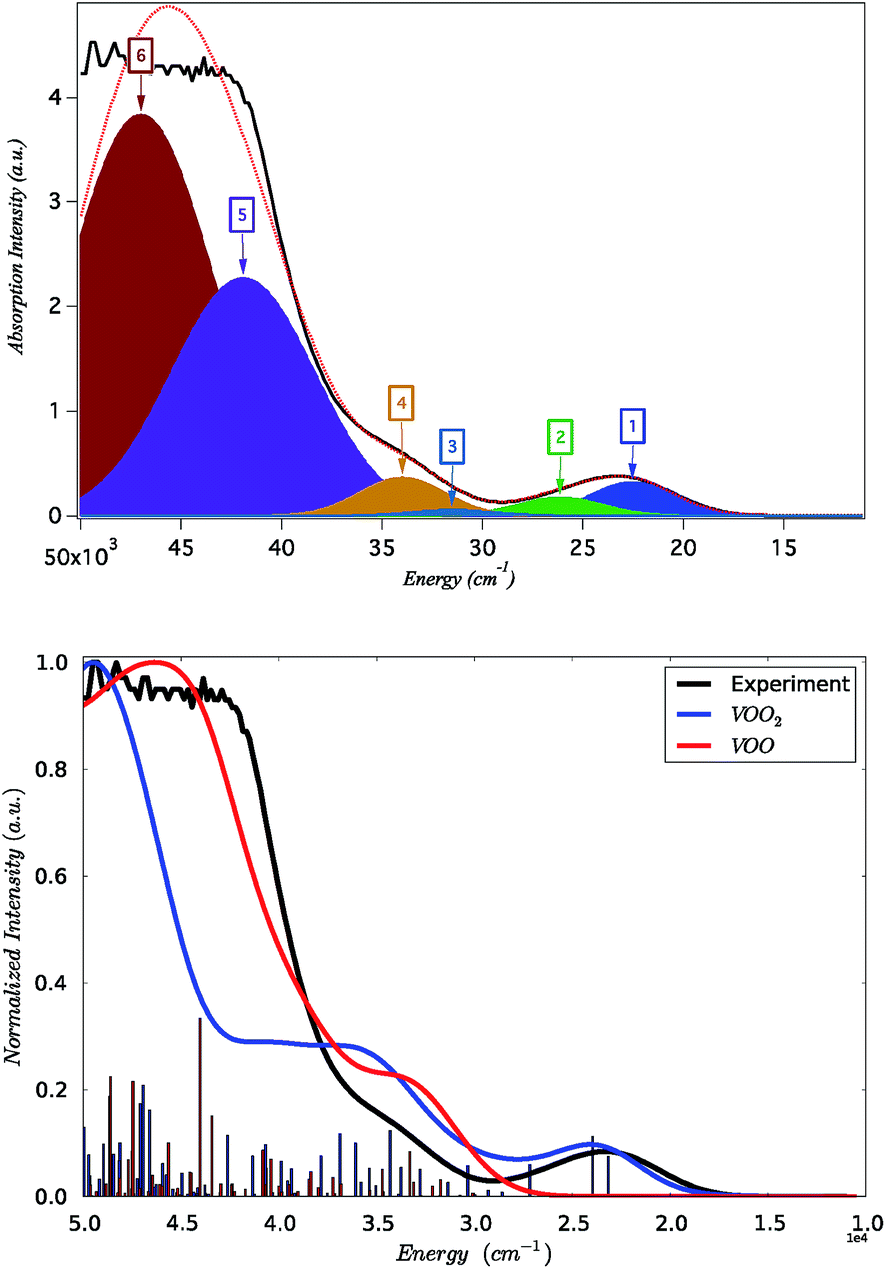 | ||
| Fig. 2 Black line: experimental absorption spectrum of K[VO(O2)Hheida]. Top: Gaussian deconvolution of the absorption spectrum. The Gaussian fit is constrained to constant widths FWHM = 4000 and 7500 cm−1 for bands 1–4 and 5–6 respectively. Bottom: B3LYP TD-DFT calculated spectra for [VO(O2)Hheida]− (blue) and [VO(O)Hheida]− (red) complexes. Blue and red sticks indicate the corresponding calculated non-relativistic states. | ||
Furthermore, for both catalytic systems Raman spectra were obtained under near resonance conditions. For the molecular complex, this was achieved using a 532 nm laser.24 As can be seen in Fig. 3 the spectrum shows characteristic enhanced rR bands located at 970, 922, 569, 556, 509 and 485 cm−1. The corresponding Raman spectrum of dehydrated VOx/SBA-15 at low vanadium loading (about 2%), was obtained upon excitation25,26 with a 488 nm laser23 and is presented in Fig. S2.† For such a low vanadium loading value, the only Raman active signal with substantial intensity is located in the region between 950–1100 cm−1. This signal has been assigned to a variety of V, O and Si functionalities ranging between monomeric to oligomeric vanadia species as are shown in Scheme 1.14,25,27–33 However, no consensus has emerged. It is clear that based on these data, this signal can only be assigned to a mixture of overlapping features of monomeric and oligomeric vanadyl species coexisting on SBA-15 already at small vanadium loadings (e.g. 0.6 V atoms per nm2).
 | ||
| Fig. 3 Experimental (black) rRaman spectrum of K[VO(O2)Hheida] observed at 18700 cm−1 excitation energy (532 nm). Calculated (green) TD-DFT rRaman spectrum. Coloured groups and blue arrows indicate the active vibrational modes dominating certain experimental (and calculated) signals. | ||
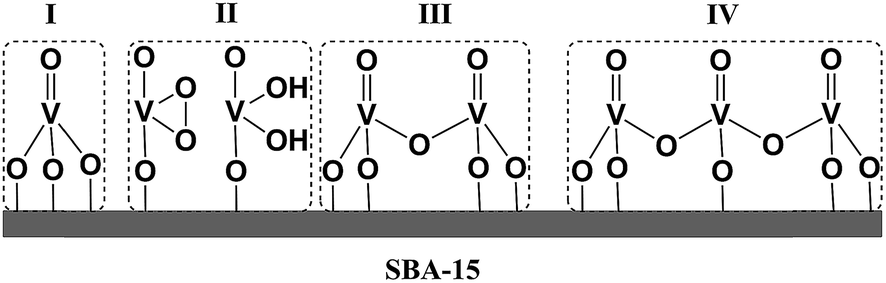 | ||
| Scheme 1 Four possible scenarios for VOx growing over a 2D silica surface (SBA-15). (I) Vanadyl type, (II) umbrella type, (III) dimeric and (IV) oligomeric species. | ||
In addition, the experimental V L-edge and O K-edge XAS spectra for K[VO(O2)Hheida] and VOx/SBA-15 at various vanadium loadings are presented in Fig. 4 and 5, respectively. In general VOx species are characterized by characteristic V L-edge and O K-edge spectra.34,35 In particular, for the case of the K[VO(O2)Hheida] complex the V L3-edge spectrum is characterized by an intense feature located at 518 eV, as well as three shoulders located at 515, 516 and 519 eV. The V L2-edge spectrum is even broader showing two features centered at 523 and 524 eV. It must be emphasized that in total the V L-edge spectrum reveals a much broader bandwidth with respect to the corresponding spectra of other oxo-peroxo V(V) complexes17 indicating the coexistence of more than one species, as will be analyzed in the theoretical section. Similarly, the O K-edge spectrum also has two broad features located at 529 and 534 eV.
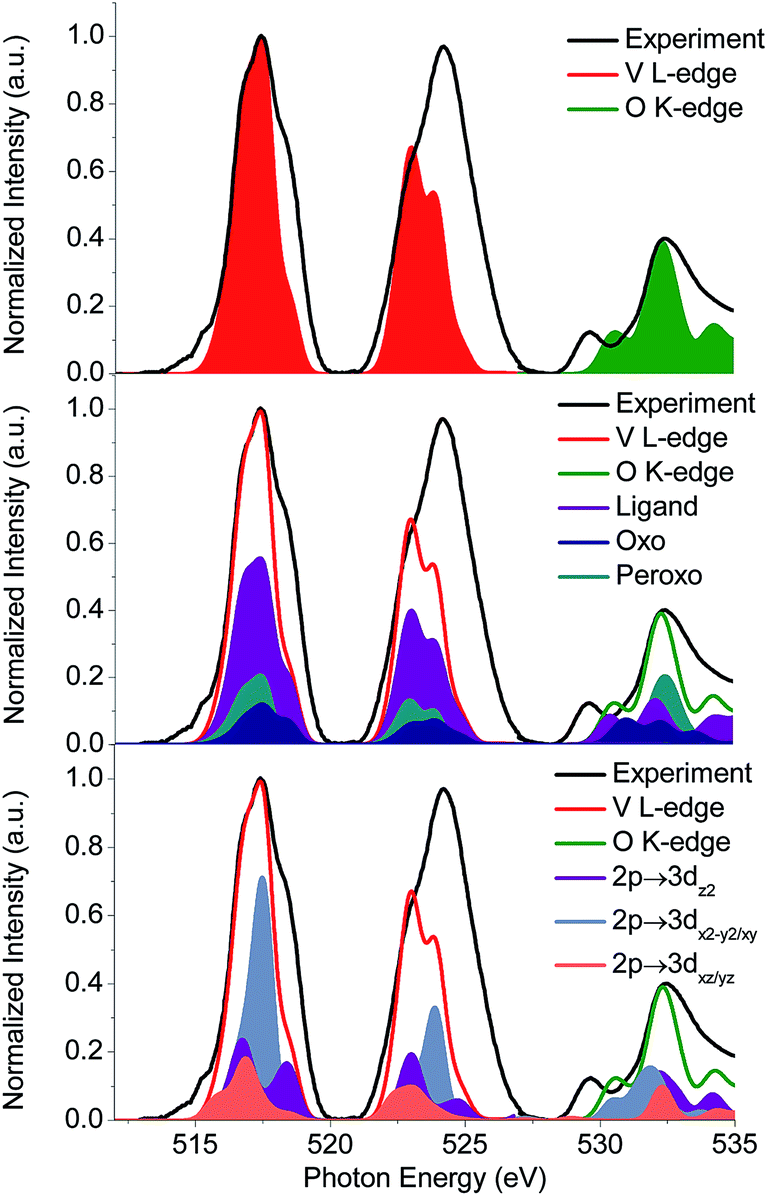 | ||
| Fig. 4 Black line: experimental V L-edge and O K-edge X-ray absorption spectra. Red and green lines and areas correspond to the B3LYP/ROCIS calculated spectra for 80% [VO(O2)Hheida] + 20% [VO(O)Hheida] active species composition (top). Deconvolution of the calculated spectra in terms of participating functional groups (middle) and single electron excitations (bottom). | ||
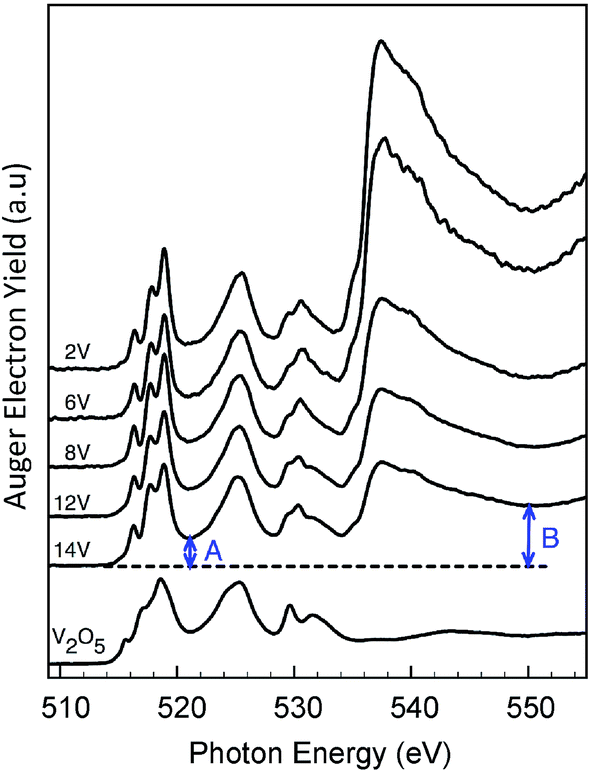 | ||
| Fig. 5 V L3,2 and O K-NEXAFS of dehydrated VOx/SBA-15 catalysts with various V loadings as indicated. Spectra were recorded in 50 Pa O2 at 673 K. A reference spectrum of V2O5 powder is shown as well. The V edge jump “A” and the total edge jump “B” are marked with arrows. | ||
The corresponding spectra of VOx/SBA-15 are presented in Fig. 5. In the V L3 region three distinguishable signals are observed at 516, 517.5 and 519 eV while in the V L2 region only one broad signal is observed at 525 eV. In addition the O K-edge spectrum contains a dominant signal around 530 eV with two broad shoulders located at 529.5 and 531 eV. These spectra differ substantially from the respective V L-edge and O K-edge spectra of crystalline V2O5 shown also in Fig. 5 (bottom). In fact, the V L-edge spectrum of V2O5 is broader due to bulk effects originating from weak O–V⋯O–V interactions within the bilayer crystallographic structure.16 Previously, theoretical investigations have concluded that a mixture of monomeric and oligomeric vanadyl species dominates the O K-edge spectrum.36 On the other hand, recent studies on ceria supported vanadia species have suggested that at low vanadium loadings (0.7 V atoms per nm2) there is a uniform coverage of the catalyst with trimeric V species.37
In the next section a systematic computational study of all these properties will be carried out based on model structures described in the ESI and shown in Fig. 6 and S1.†
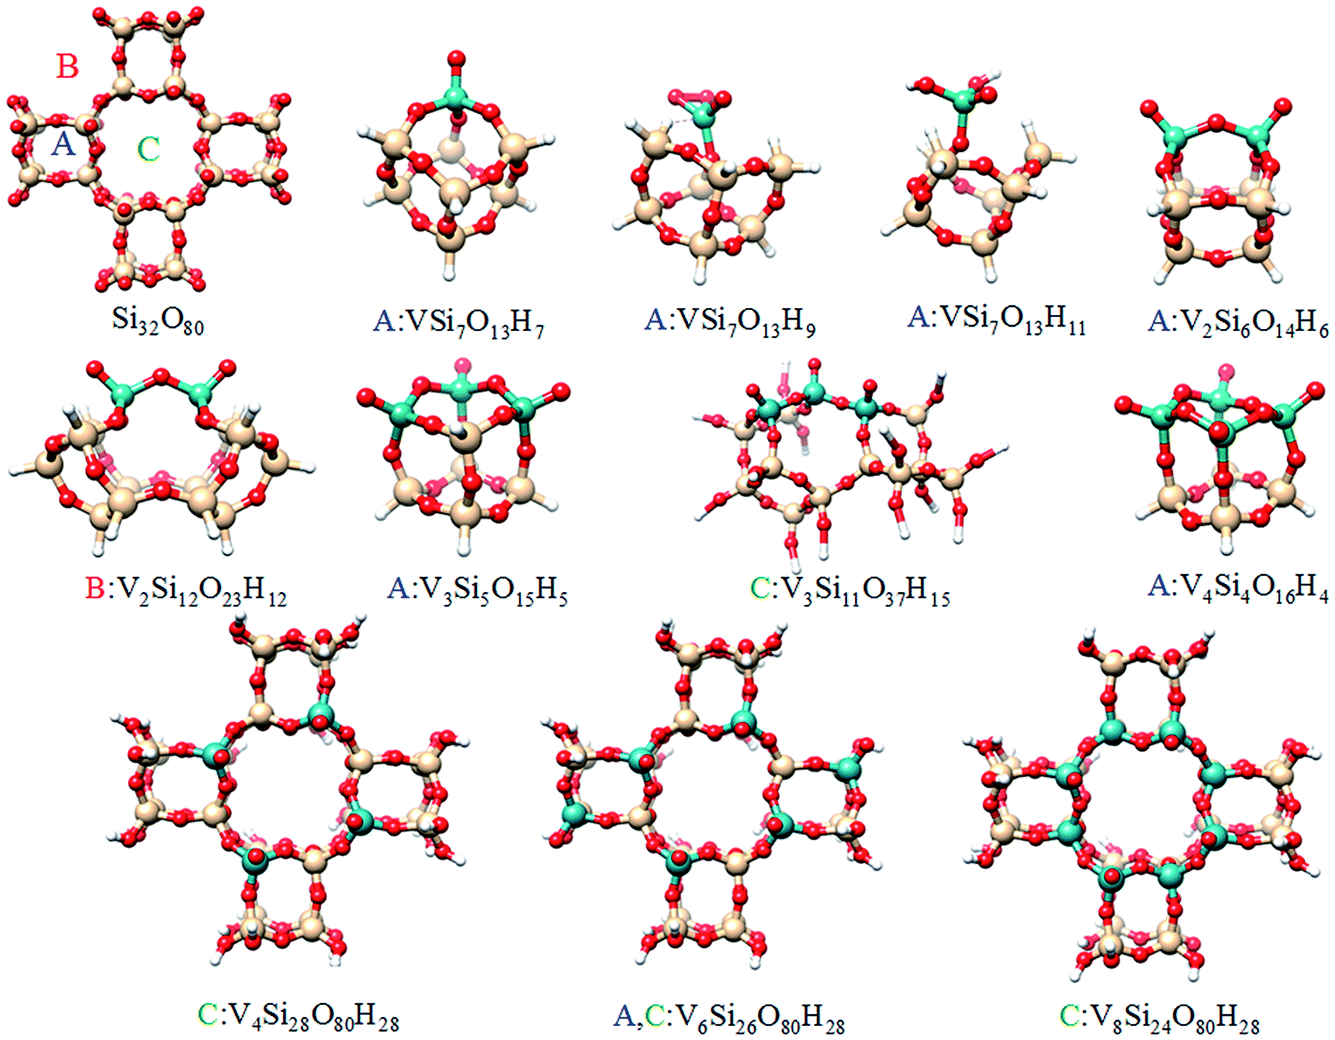 | ||
| Fig. 6 Graphical representation of the cluster models used to model the different silica supported vanadia centers. More information is provided in the ESI (Fig. S1†). | ||
Theoretical calculations
Absorption spectroscopy
On the basis of the particle/hole excitation patterns shown in Fig. 7 and S3† the absorption spectrum of [VO(O2)Hheida]− can be satisfactorily fitted with a minimum of six Gaussian bands. In the second step of the analysis we perform TD-DFT calculations of the absorption spectra assuming the coexistence of [VO(O2)Hheida]− and the oxygen deficient [VO(O)Hheida]− complexes. The results are shown in Fig. 2 (bottom). Evidently, the signal located at 26000 cm−1 is solely dominated by the V–OO2 functional group. In fact the Gaussian bands 1 and 2 correspond to the LMCT 1E(1a1 → 2e), 1E(1a1 → 3e) and 1A1(1a1 → 2a1) one-electron excitations, respectively. On the other hand, the bands located at 34000 and 45000 cm−1 (Gaussians 3–6) are dominated by LMCT and Ligand to Ligand CT (LLCT) electron excitations arising from the V–OO2 and V–OO functional groups. Likewise the changes observed in the VOx/SBA-15 spectra (Fig. S2,† top-left) are nicely reproduced in the calculations, as shown in Fig. S2† (top-right). Indeed, by proceeding from monomeric to oligomeric species, there are spectral shifts at lower energies. As long as the vanadium loading remains limited (about 2%), it is necessary to investigate whether a unique structure can primarily dominate the experimental spectra as will be shown below by analyzing the rRaman and XAS spectra.
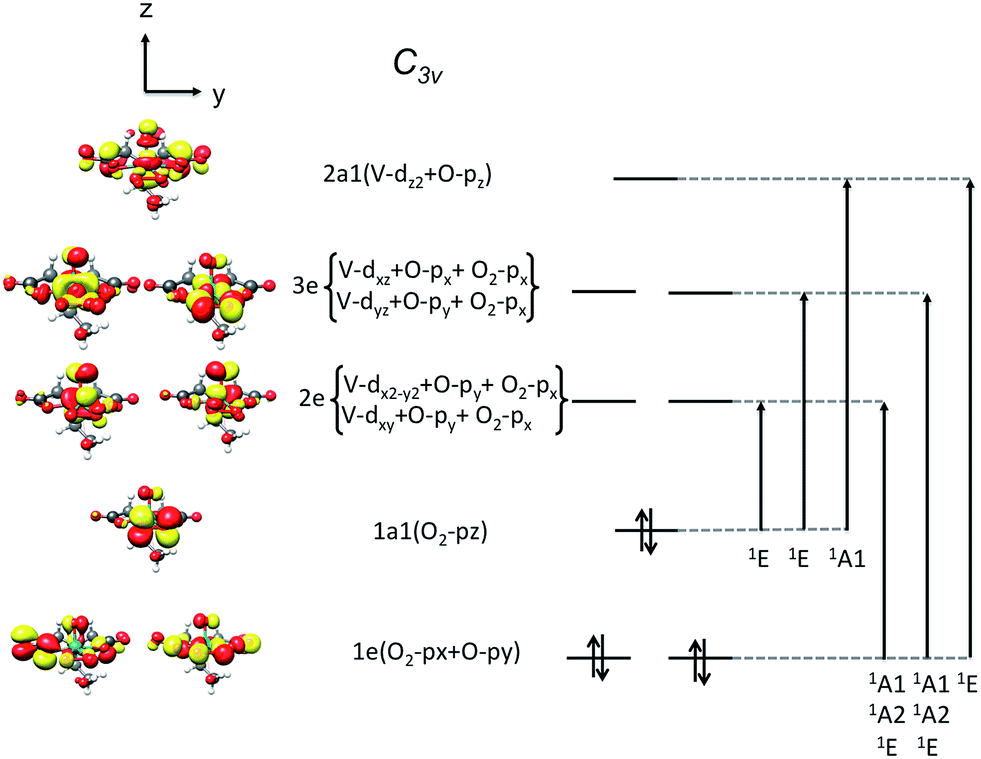 | ||
| Fig. 7 The MO splitting diagram of the local V–OO2 (C3v) core. In addition, the adapted 2p–3d transitions in the one electron particle/hole approximation are visualized assuming ideal C3v ligand field splitting. | ||
rRaman spectroscopy
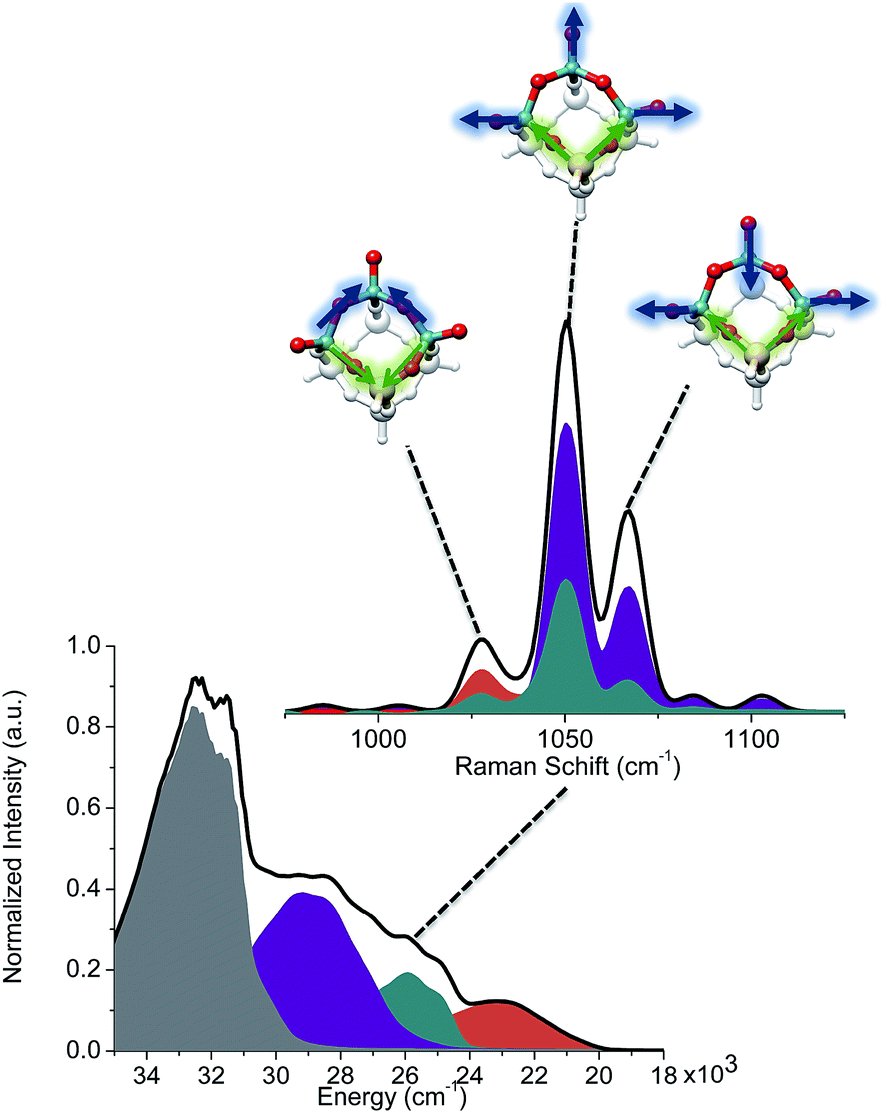
By setting the excitation frequency to pre-resonance with the absorption band at 26000 cm−1, e.g. an excitation frequency of 450 nm, the rRaman bands of K[VO(O2)Hheida] presented in Fig. 3 are calculated. We notice that certain deficiencies in the calculated energies of the band positions and relative intensities with respect to experiment are observed, most likely due to the fact that the IMDHO model does not account for terms of second or higher order between excited and ground vibrational Hamiltonians.21,22 Despite the fact that the agreement between theory and experiment is only a semiquantitative agreement for some of the rRaman bands, the IMDHO approach still enables a conclusive assignment of the experimental Raman bands. It should be noted that at this region of excitation energies, the observed absorption band is solely dominated by the [VO(O2)Hheida]− species. Following the discussion above, this band corresponds to LMCT states arising solely from the V–OO2 functional group of the [VO(O2)Hheida]− complex. Due to the excellent agreement between theory and experiment the assignment of the rRaman spectral features is straightforward. The signals located at 970 and 922 cm−1 are assigned to the stretching vibrations of the V–O (vanadyl–oxo) and the O–O (peroxo) groups, respectively. In addition, the signals centered at 569 and 556 cm−1 are dominated by symmetric and antisymmetric V–O (peroxo) stretching vibrations. Finally, the low intensity signals located at 509 and 565 cm−1 are dominated by hydroxyl stretching vibrations.
Similarly, the rRaman23,25,30 spectra were evaluated for low lying excited states of all the model structures representing VOx/SBA-15 in the range between 300–500 nm (20000–35000 cm−1). The corresponding spectra are presented in Fig. S4 and S5.† This strategy was followed for all model structures and will be illustrated below for the V3Si5H5O15 structure. The calculated absorption spectrum is characterized by three low-lying groups of bands located at 22500 (orange), 25000 (cyan) and 27000 cm−1 (purple) depicted in Fig. 8 (bottom-left, higher lying states are drawn in gray). These bands originate from either single-electron excitations within the V![[double bond, length as m-dash]](https://www.rsc.org/images/entities/char_e001.gif) O and V–O–V fragments (orange) and the VO and Si–O–V structural motifs (cyan and purple). Based on those calculated excitation energies the corresponding rRaman spectra can be calculated (Fig. 8, top-right).
O and V–O–V fragments (orange) and the VO and Si–O–V structural motifs (cyan and purple). Based on those calculated excitation energies the corresponding rRaman spectra can be calculated (Fig. 8, top-right).
 | ||
| Fig. 8 Bottom-left: Calculated absorption spectra accounting for the band shape of the dominating states for V3Si5H5O15. The states are grouped according to the character of the dominating single-electron excitations involving either VO and V–O–V sequences (orange), or VO and Si–O–V sequences (cyan and purple). Top-right: Calculated Raman spectra. The spectra are calculated at an absorption energy of 26000 cm−1. Orange, cyan and purple bands indicate active vibrational modes pointed with arrows. | ||
The calculated rRaman spectra reproduce the observed signals around 1000 cm−1 and they are in very good agreement with previous studies.25,26,30 Inspection of Fig. S4 and S5† reveals that, although the presence of monomeric umbrella type structures cannot be excluded, they certainly do not dominate the intensity of the signal around 1000 cm−1, this conclusion follows from the absence of the characteristic OO and Si–O–V signals expected at <1000 cm−1 that are key features for this type of structure. Based on these data it appears that the structures which contain vanadyl VO bonds and bridging V–O–V units are always in better agreement with experiment for the signals located around 1000 cm−1. At this stage of analysis, the Raman technique alone is not conclusive with respect to the dominant structural feature. Nevertheless, we note that the calculations for the trimeric structure presented in Fig. 8 provide a very good agreement with experiment. Analysis of the predominant vibrational modes indicates that the signal at around 1000 cm−1 is dominated by combinations of V–O–V and V–O–Si (1025 cm−1) as well as VO and V–O–Si (1050, 1075 cm−1) stretching vibrations (Fig. 8, top-right). More information can be obtained by deconvoluting the calculated rRaman signals in terms of the dominating excited state. As can be seen in Fig. 8 (bottom-left) the group of states are heavily overlapping as each absorption band contains tails that overlap with the other two. The signal at 1025 cm−1 is mainly dominated by states involving VO and V–O–V (orange), as well as the VO and Si–O–V structural motifs (cyan). On the other hand, the signals at 1050 and 1075 cm−1 are primarily dominated by states involving the VO and Si–O–V fragments (cyan and purple). Furthermore, as is seen in Fig. 9 the experimental features at 1025 cm−1 are better reproduced by the trimeric V3Si5H5O15, rather than the monomeric VSi7H7O13 due to the dominating V–O–V vibrations.
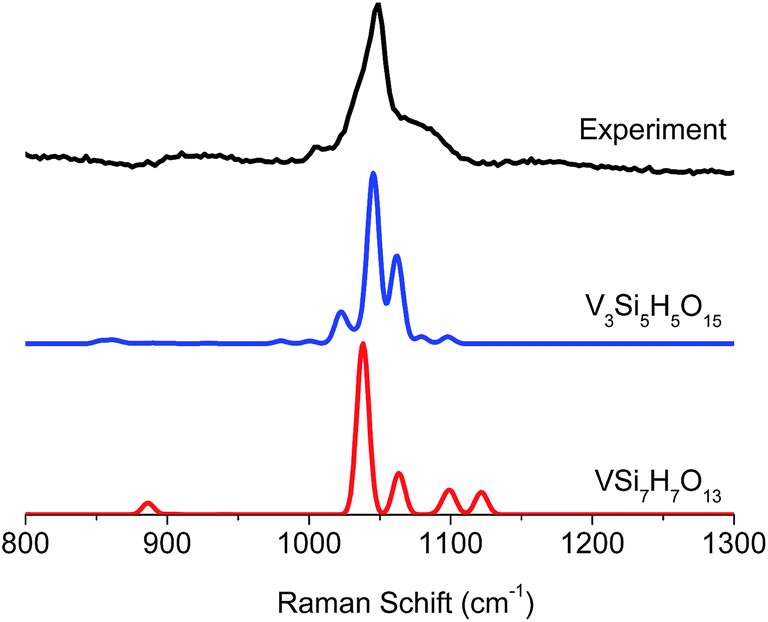 | ||
| Fig. 9 Comparison between experimental (black) and calculated VSi7H7O13 (red) and V3Si5H5O15 (blue) rRaman spectra. | ||
X-ray spectroscopy
In an effort to obtain further insight into the predominant species, the V L-edge and O K-edge spectra of all models for both the molecular and the heterogeneous catalytic systems were calculated on the DFT/ROCIS level. It has been discussed recently24 that the shape of the O K-edge spectrum of K[VO(O2)Hheida], can be explained by considering the TD-DFT calculation molecular admixtures of [VO(O2)Hheida]− and the oxygen deficient [VO(O)Hheida]− ions according to the relation:24| α*[VO(O2)Hheida] + (1 − α)*[VO(O)Hheida] | (1) |
Moreover, a quantitative measure of the sample heterogeneity can be obtained when relation (1) is combined with the DFT-ROCIS calculated V L-edge and O K-edge spectra. The corresponding spectra for α-values ranging between 1 and 0 are presented in Fig. 10.
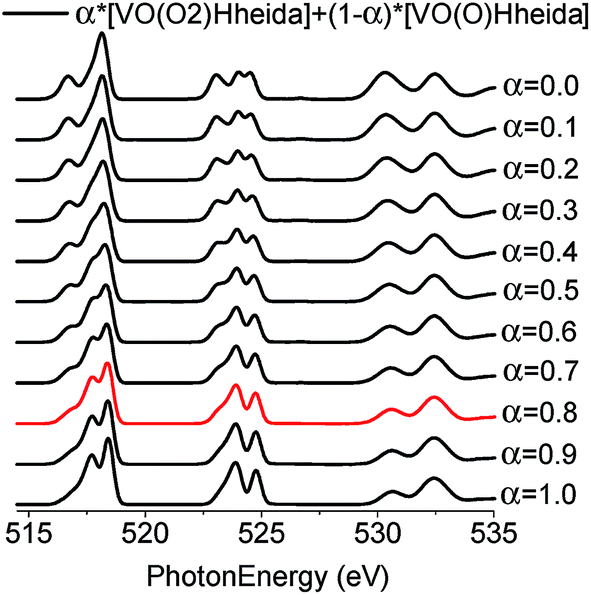 | ||
| Fig. 10 B3LYP/ROCIS calculated spectra for admixtures of [VO(O2)Hheida]− and the oxygen deficient [VO(O)Hheida]− ions according to the relation (1) for α values ranging between 1 and 0. The red spectrum at α = 0.8 indicates the best agreement between theory and experiment. | ||
Subsequently, these spectra were used to simultaneously fit the V L3-edge and O K-edge spectra parts, according to a fitting procedure, described in the ESI.† The best agreement between theory and experiment is observed for α = 0.8 (highlighted red in Fig. 10), indicating a 20% admixture of the oxygen deficient species. Additional information can be obtained by analyzing the relativistic many particle states in terms of contributions arising from the oxo, the peroxo and the ligand oxygen functional groups, as well as the most important single electron excitations. This has been proven to be useful in describing bonding features for both molecular complexes17 and solids.20 As can be seen in Fig. 4 (middle) all three groups strongly participate in the intensity mechanism of both V L-edge and O K-edge spectra, due to the 20% admixture of the [VO(O)Hheida]− species, as well as the strongly anisotropic environment around the VO6 vanadium centers. In particular, oxo, peroxo and ligand oxygen atoms dominate the main experimental features of the O K-edge spectrum located at 529 and 534 eV in accordance with a previous analysis.24 Moreover, both bands are dominated by combinations of σ- and π-single electron excitations 2p → 3dz2, 2p → 3dx2−y2/xy, and 2p → 3dxz/yz. Furthermore, a similar analysis of the corresponding V L3-edge reflects the π-character of the signals located at 515 and 518 eV, as well as the σ-character of the signal positioned at 519 eV and the mixed σ- and π-character of the shoulder centered at 516 eV.
In following, the same protocol is applied to the more challenging case of silica supported vanadia catalysts. The resulting V L-edge spectra are shown in Fig. S6 and S7† for 2% and 8% V loadings respectively. By inspection of Fig. S6 and S7,† it becomes evident that the A and B-domain types of structures containing V–O–V bridges (V2Si6H6O14, V2Si12H12O23, V3Si5H5O15 and V4Si4H4O16), provide the best agreement for both vanadium loadings, in terms of relative intensities and intensity distribution, especially for the L3 resonances located at 516, 517.5 and 519 eV. In addition, the V3Si5H5O15 calculated spectrum reproduces equally well both the 2% and the 8% vanadium loading spectra, reflecting the limited oligomerization at these levels of vanadium loading. Evidently by averaging over the above four structures (Fig. S8†) the average spectrum has a closer resemblance with the V2O5 spectrum. On the other hand, the ‘open’ trimeric structure V3Si11H15O37 does not show relevant agreement, indicating the preference of VOx to form more strain configurations. This is in accordance with the recent observation for silica supported molybdena catalysts that showing that such a strain effect has been directly associated with an increase in reactivity.38 Collectively, by combining the results from the three individual spectroscopic experiments: rRaman, V L-edge and O K-edge (Fig. 9, 11 and S9†) it is the trimeric structure V3Si5H5O15 that provides consistently the best possible agreement. Furthermore, it should be emphasized that the V3Si5H5O15 structure provides in addition very good agreement for the relative intensities of the V L-edge and O K-edge spectra (Fig. 11). This is important as in contrast to the situation with V2O5, these two edge spectra do not provide complementary information about the V–O bonds since there are additional Si–O bonds that lead to recognizable features in the spectrum. Hence, it appears that this trimeric structure provides the best balance between vanadyl bonds VO and bridging units V–O–V, Si–O–V and Si–O–Si which is of paramount importance for correct spectral predictions.
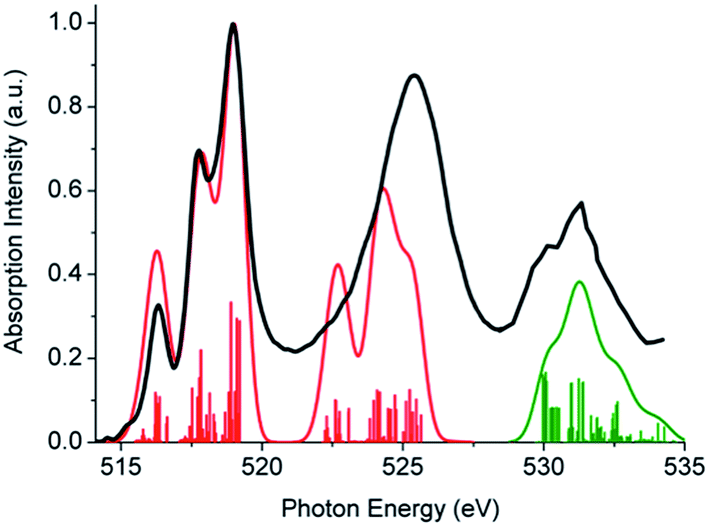 | ||
| Fig. 11 DFT/ROCIS (B3LYP/def2-TZVP), V L-edge (red solid line) and O K-edge (green solid line) calculated spectra for V3Si5H5O15. The black thick line represents the background-subtracted experimental powder spectrum. Red and green stick lines correspond to SOC-corrected states. All calculated spectra were energy shifted. A constant line shape broadening of 0.8 eV was applied. | ||
Degree of oligimerization
As a final step, the effect of the oligomerization on the calculated spectra was investigated. Following the same protocol as for the molecular catalyst, the analysis was accomplished by a simultaneous fit of the weighted superposition of all calculated spectra to the V L3-edge experimental spectrum (V loading of 2%). It should be highlighted that the V L3-spectrum serves as a good candidate for this analysis as it is composed of three clearly visible signals. By contrast, the respective Raman and O K-edge spectra were not used in the fitting due to the relatively broad nature of the spectral features. These spectra were used however, in the second step of the analysis in order to validate the fitting results. Initially, the fit was performed over the whole dataset. It was found however that better fits could be obtained by considering only the monomeric (VSi7H7O13, VSi7H9O13 and VSi7H11O13), dimeric (V2Si6H6O14 and V2Si12H12O23), trimeric (V3Si5H5O15) and tetrameric (V4Si4H4O16) model structures. The results of the fitting are visualized in Fig. 12, while the corresponding weighted O K-edge and resonance Raman spectra together with the respective V L-edge spectra are shown in Fig. 13. | ||
| Fig. 12 Fit results of the weighted superposition of all calculated spectra to the V L3-edge experimental spectrum. Cases (A), (B), (C) represent local minima of the fit function corresponding to the best R2 values achievable by starting the fit from a pure dimer (A), trimer (B), tetramer (C) or monomer (D) structure. | ||
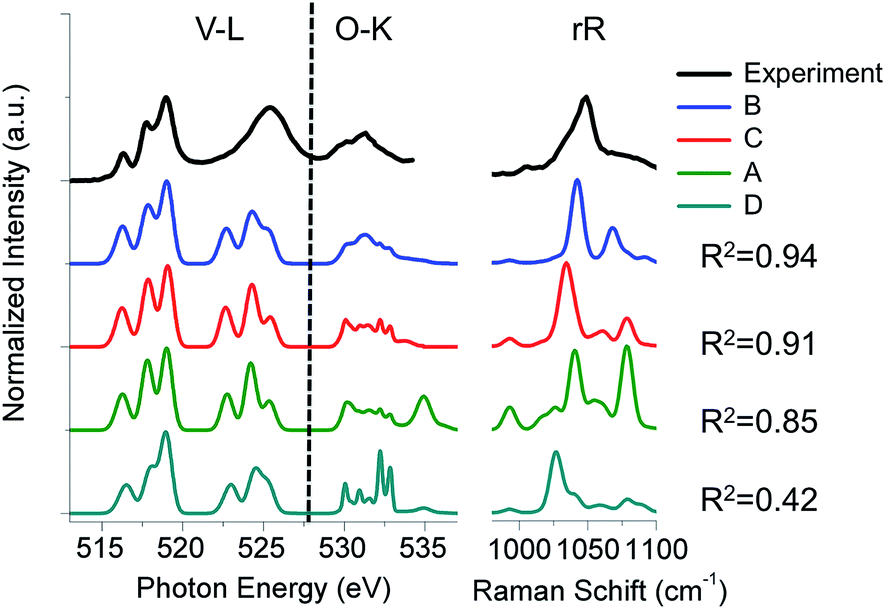 | ||
| Fig. 13 Experimental (black) versus calculated weighted V L-edge, O K-edge and resonance Raman spectra. Weighting schemes, (A): 10% monomeric, 65% dimeric and 25% tetrameric (green), (B): 5% monomeric, 5% dimeric, 80% trimeric and 10% tetrameric (blue), (C): 20% monomeric and 80% tetrameric (red) and (D): 70% monomeric, 10% dimeric, 5% trimeric and 15% tetrameric (cyan). The corresponding R2 values are provided at the right-hand side. | ||
The B weighting scheme involving 5% monomeric, 5% dimeric, 80% trimeric and 10% tetrameric structures provides the best agreement with all the three spectra, V L-edge, O K-edge and rRaman (R2 = 0.94). The respective weighting schemes D, A and C provide significantly worse agreement (R2 = 0.42, 0.85 and 0.91, respectively). Thus, the combined analysis of three different spectroscopic methods demonstrates that under limited vanadium loading conditions, trimeric structures are dominant. This is in agreement with recent computational studies that address the reactivity of these systems.39
Conclusions
In conclusion, a systematic computational protocol based on advanced theoretical spectroscopy was applied in order to extract the structural information of active catalytic centers in both homogenous and heterogeneous catalysis. Establishing detailed structure–spectra relationships requires the simultaneous interpretation of the complete spectroscopic response of the catalytic material. To the best of our knowledge, this work represents the first study of this kind. The approach was validated to perform equally well with both homogeneous and heterogeneous catalytic cases. In particular the simultaneous analysis of the available experimental absorption, rRaman as well as V L-edge and O K-edge XAS spectra provided detailed insights into the geometric and electronic structural origin of the observed spectral features. In the case of the K[VO(O2)Hheida] catalyst, the combined analysis revealed that the low-lying absorption LMCT band, as well as the rRaman profile of this excited chromophore, are dominated by the actual [VO(O2)Hheida]− complex. On the other hand the respective XAS spectra contain a 20% admixture of the oxygen deficient [VO(O)Hheida]− species. The same protocol was applied to interpret the spectroscopic response of the heterogeneous silica-supported vanadium oxide VOx/SBA-15 catalyst. It was shown that under limited vanadium loadings molecular species with predominant trimeric structures provide the best agreement between theory and experiment for all the available spectra. Although a identification of a catalytic center in a heterogeneous catalyst is a much more complicated task, having a tool with predictive power forms an excellent basis for the design of dedicated spectroscopic experiments. Further experimental and theoretical studies based on multiwavelength rRaman and X-ray measurements, as well as high-level theory, are currently underway in order to determine the reaction mechanism of these catalysts.Acknowledgements
The authors gratefully acknowledge financial support from the Max Planck Society. The Helmholtz-Zentrum Berlin (HZB) staff are acknowledged for continuously supporting the synchrotron based near ambient pressure spectroscopy experiments of the Fritz Haber Institute at BESSY II. We thank Dr Philipp Gruene, Dr Till Wolfram, and Daniel Brennecke for preparation of the supported vanadium catalysts and Dr Olaf Timpe, Dr Johannes Noack, and Anne Kärgel for preparation of the molecular complex. Raman spectroscopy was performed by Dr Philipp Gruene, Dr Oliver Korup, and Dr Johannes Noack. UV-vis spectra were taken by Dr Genka Tzolova-Müller. X-ray absorption spectra were recorded by Dr Michael Hävecker and Dr Till Wolfram. The reviewers of the manuscript are gratefully acknowledged for their constructive comments.Notes and references
- R. Schloegl, Nat. Mater., 2008, 7, 772–774 CrossRef CAS PubMed.
- T. W. Hansen, J. B. Wagner, P. L. Hansen, S. Dahl, H. Topsøe and C. J. H. Jacobsen, Science, 2001, 294, 1508–1510 CrossRef CAS PubMed.
- J. K. Norskov, T. Bligaard, J. Rossmeisl and C. H. Christensen, Nat. Chem., 2009, 1, 37–46 CrossRef CAS PubMed.
- T. Bligaard, J. K. Nørskov, S. Dahl, J. Matthiesen, C. H. Christensen and J. Sehested, J. Catal., 2004, 224, 206–217 CrossRef CAS.
- A. A. Balandin, in Advances in Catalysis, ed. H. P. D. D. Eley and B. W. Paul, Academic Press, 1969, vol. 19, pp. 1–210 Search PubMed.
- T. Petrenko, S. DeBeer George, N. Aliaga-Alcalde, E. Bill, B. Mienert, Y. Xiao, Y. Guo, W. Sturhahn, S. P. Cramer, K. Wieghardt and F. Neese, J. Am. Chem. Soc., 2007, 129, 11053–11060 CrossRef CAS PubMed.
- J. F. Berry, E. Bill, E. Bothe, S. D. George, B. Mienert, F. Neese and K. Wieghardt, Science, 2006, 312, 1937–1941 CrossRef CAS PubMed.
- J. C. Schöneboom, F. Neese and W. Thiel, J. Am. Chem. Soc., 2005, 127, 5840–5853 CrossRef PubMed.
- S. Ye, C.-Y. Geng, S. Shaik and F. Neese, Phys. Chem. Chem. Phys., 2013, 15, 8017–8030 RSC.
- S. Ye and F. Neese, Proc. Natl. Acad. Sci. U. S. A., 2011, 108, 1228–1233 CrossRef CAS PubMed.
- K. M. Lancaster, M. Roemelt, P. Ettenhuber, Y. Hu, M. W. Ribbe, F. Neese, U. Bergmann and S. DeBeer, Science, 2011, 334, 974–977 CrossRef CAS PubMed.
- D. A. Pantazis, W. Ames, N. Cox, W. Lubitz and F. Neese, Angew. Chem., Int. Ed., 2012, 51, 9935–9940 CrossRef CAS PubMed.
- N. Cox, M. Retegan, F. Neese, D. A. Pantazis, A. Boussac and W. Lubitz, Science, 2014, 345, 804–808 CrossRef CAS PubMed.
- J. E. Molinari and I. E. Wachs, J. Am. Chem. Soc., 2010, 132, 12559–12561 CrossRef CAS PubMed.
- C. Hess, ChemPhysChem, 2009, 10, 319–326 CrossRef CAS PubMed.
- D. Maganas, M. Roemelt, M. Havecker, A. Trunschke, A. Knop-Gericke, R. Schlogl and F. Neese, PCCP Phys. Chem. Chem. Phys., 2013, 15, 7260–7276 RSC.
- D. Maganas, M. Roemelt, T. Weyhermuller, R. Blume, M. Havecker, A. Knop-Gericke, S. DeBeer, R. Schlogl and F. Neese, PCCP Phys. Chem. Chem. Phys., 2014, 16, 264–276 RSC.
- M. Roemelt, D. Maganas, S. DeBeer and F. Neese, J. Chem. Phys., 2013, 138, 204101 CrossRef PubMed.
- M. Roemelt and F. Neese, J. Phys. Chem. A, 2013, 117, 3069–3083 CrossRef CAS PubMed.
- D. Maganas, S. DeBeer and F. Neese, Inorg. Chem., 2014, 53, 6374–6385 CrossRef CAS PubMed.
- T. Petrenko and F. Neese, J. Chem. Phys., 2012, 137, 234107 CrossRef PubMed.
- T. Petrenko and F. Neese, J. Chem. Phys., 2007, 127, 164112 CrossRef PubMed.
- P. Gruene, T. Wolfram, K. Pelzer, R. Schlogl and A. Trunschke, Catal. Today, 2010, 157, 137–142 CrossRef CAS.
- L. L. Sun, K. E. Hermann, J. Noack, O. Timpe, D. Teschner, M. Hävecker, A. Trunschke and R. Schlögl, J. Phys. Chem. C, 2014, 118, 24611–24622 CAS.
- A. E. Stiegman, J. Phys. Chem. C, 2011, 115, 10917–10924 CAS.
- Z. Wu, S. Dai and S. H. Overbury, J. Phys. Chem. C, 2009, 114, 412–422 Search PubMed.
- D. E. Keller, T. Visser, F. Soulimani, D. C. Koningsberger and B. M. Weckhuysen, Vib. Spectrosc., 2007, 43, 140–151 CrossRef CAS.
- N. Magg, B. Immaraporn, J. B. Giorgi, T. Schroeder, M. Bäumer, J. Döbler, Z. Wu, E. Kondratenko, M. Cherian, M. Baerns, P. C. Stair, J. Sauer and H.-J. Freund, J. Catal., 2004, 226, 88–100 CrossRef CAS.
- C. Moisii, M. D. Curran, L. J. van de Burgt and A. E. Stiegman, J. Mater. Chem., 2005, 15, 3519–3524 RSC.
- C. Moisii, L. J. van de Burgt and A. E. Stiegman, Chem. Mater., 2008, 20, 3927–3935 CrossRef CAS.
- J. P. Thielemann, T. Ressler, A. Walter, G. Tzolova-Mueller and C. Hess, Appl. Catal., A, 2011, 399, 28–34 CrossRef CAS.
- J. N. J. van Lingen, O. L. J. Gijzeman, B. M. Weckhuysen and J. H. van Lenthe, J. Catal., 2006, 239, 34–41 CrossRef CAS.
- J. Döbler, M. Pritzsche and J. Sauer, J. Phys. Chem. C, 2009, 113, 12454–12464 Search PubMed.
- D. Maganas, M. Roemelt, M. Havecker, A. Trunschke, A. Knop-Gericke, R. Schlogl and F. Neese, Phys. Chem. Chem. Phys., 2013, 15, 7260–7276 RSC.
- D. Maganas, M. Roemelt, T. Weyhermuller, R. Blume, M. Havecker, A. Knop-Gericke, S. DeBeer, R. Schlogl and F. Neese, Phys. Chem. Chem. Phys., 2014, 16, 264–276 RSC.
- M. Cavalleri, K. Hermann, A. Knop-Gericke, M. Haevecker, R. Herbert, C. Hess, A. Oestereich, J. Doebler and R. Schloegl, J. Catal., 2009, 262, 215–223 CrossRef CAS.
- M. Baron, H. Abbott, O. Bondarchuk, D. Stacchiola, A. Uhl, S. Shaikhutdinov, H.-J. Freund, C. Popa, M. V. Ganduglia-Pirovano and J. Sauer, Angew. Chem., Int. Ed., 2009, 48, 8006–8009 CrossRef CAS PubMed.
- K. Amakawa, L. Sun, C. Guo, M. Haevecker, P. Kube, I. E. Wachs, S. Lwin, A. I. Frenkel, A. Patlolla, K. Hermann, R. Schloegl and A. Trunschke, Angew. Chem., Int. Ed., 2013, 52, 13553–13557 CrossRef CAS PubMed.
- X. Rozanska, R. Fortrie and J. Sauer, J. Am. Chem. Soc., 2014, 136, 7751–7761 CrossRef CAS PubMed.
Footnote |
| † Electronic supplementary information (ESI) available: Experimental and fitting procedure, computational details, electronic structure, Fig. S1–S9, Table S1, and bibliography. See DOI: 10.1039/c5fd00193e |
| This journal is © The Royal Society of Chemistry 2016 |