 Open Access Article
Creative Commons Attribution 3.0 Unported Licence
Methanol formation from CO2 catalyzed by Fe3S4{111}: formate versus hydrocarboxyl pathways†
A.
Roldan
and
N. H.
de Leeuw
*
School of Chemistry, Cardiff University, Main Building, Park Place, CF10 3AT, Cardiff, UK. E-mail: roldanmartineza@cardiff.ac.uk; deLeeuwN@cardiff.ac.uk
First published on 30th November 2015
Abstract
Carbon capture and utilisation is one of the most promising techniques to minimize the impact of the increasing amount of carbon dioxide in the atmosphere. Recently, the mineral greigite was shown to be capable of catalysing CO2 conversion, leading to useful small organic molecules. Here, we have carried out a systematic study of the adsorption and selective reduction of CO2 on the Fe3S4{111} surface. We have considered both formate and hydrocarboxyl key intermediates, leading to different reaction pathways via Eley–Rideal and Langmuir–Hinshelwood mechanisms, and we have built a kinetic model considering the wide range of intermediates in the reaction network. Our results show that the mechanism to produce formic acid takes place via formate intermediate mostly on FeA sites, while methanol is formed via hydrocarboxyl intermediates on FeB sites. From the kinetic model, we have derived a reaction constant comparison and determined the limiting step rates. The overall process takes place under very mild conditions, requiring only a small energy input that might come from a chemiosmotic potential.
Introduction
Our present dependence on fossil fuels means that, as our demand for energy inevitably increases, so do emissions of greenhouse gases, most notably carbon dioxide (CO2). To avoid the obvious consequence of severe climate change,1 the concentration of such greenhouse gases in the atmosphere must be stabilized.2–5 Integrated carbon capture and subsequent sequestration is generally recognized as the most promising option to tackle CO2 gases in the short to medium term. A long-term solution is its reduction and conversion to suitable compounds: CO2 is a source of carbon and may be used as a feedstock for conversion to useful chemicals.6 Reductive reactions involving CO2 are a grand challenge because they require energy to generate reduced forms of CO2, such as formate or CO.7 In particular, production of CO is considered an important objective in the context of production of renewable carbon feedstock chemicals.8 The main challenge in CO2 reduction is increasing the energy efficiency of the activation process of the molecule, which is hindered primarily by high CO2 reduction over-potentials,9 which is also suggested to be the rate limiting step in the conversion process. In most cases, mild temperatures but high CO2 pressures (>10 bar) and long reaction times are required.10,11 Nevertheless, experiments on iron sulfide have shown that electroreduction under room conditions and small overpotentials is achievable.12Reactions of interest for CO2 conversion are classified into two types: reductive and non-reductive reactions, both requiring the activation of the C![[double bond, length as m-dash]](https://www.rsc.org/images/entities/char_e001.gif) O double bond, which is accompanied by charge transfer to the lowest unoccupied molecular orbital.13 Solid state catalysts may act as a redox center, transferring electrons from its valence band to the molecular orbital while decreasing the O–C–O bond angle.9,14 In this process, two problems are encountered: (i) the large thermodynamic stability of the molecule15 and (ii) the appreciable kinetic energy barrier to activate CO2.16 Several possible reaction pathways have been proposed to transform CO2 into one-carbon organic molecules, such as CH4 or CH3OH. These involve the reverse water gas-shift (rev-WGS) reaction, yielding CO followed by the subsequent hydrogenation via formyl intermediate (HCO) to methanol17 or to a variety of long chain hydrocarbons via the Fischer–Tropsch process.18 This reaction mechanism on Cu showed that, under ambient conditions, the reaction takes place through carboxyl intermediate.19 Other possible pathways have shown formate intermediate (HCOO) with subsequent O–CO bond scission, yielding similar products.11,12 Recent studies have claimed that CH3OH is produced by the subsequent hydrogenation of HCOOH to H3CO via C–O bond scission,20 although formic acid might dissociate back to formate with a low energy barrier.17 It has also been proposed that the hydrogenation of CO2 towards CH3OH takes place through dihydroxycarbene (COHOH), hydroxymethylidyne (COH) and hydroxymethylene (HCOH) intermediates.20
O double bond, which is accompanied by charge transfer to the lowest unoccupied molecular orbital.13 Solid state catalysts may act as a redox center, transferring electrons from its valence band to the molecular orbital while decreasing the O–C–O bond angle.9,14 In this process, two problems are encountered: (i) the large thermodynamic stability of the molecule15 and (ii) the appreciable kinetic energy barrier to activate CO2.16 Several possible reaction pathways have been proposed to transform CO2 into one-carbon organic molecules, such as CH4 or CH3OH. These involve the reverse water gas-shift (rev-WGS) reaction, yielding CO followed by the subsequent hydrogenation via formyl intermediate (HCO) to methanol17 or to a variety of long chain hydrocarbons via the Fischer–Tropsch process.18 This reaction mechanism on Cu showed that, under ambient conditions, the reaction takes place through carboxyl intermediate.19 Other possible pathways have shown formate intermediate (HCOO) with subsequent O–CO bond scission, yielding similar products.11,12 Recent studies have claimed that CH3OH is produced by the subsequent hydrogenation of HCOOH to H3CO via C–O bond scission,20 although formic acid might dissociate back to formate with a low energy barrier.17 It has also been proposed that the hydrogenation of CO2 towards CH3OH takes place through dihydroxycarbene (COHOH), hydroxymethylidyne (COH) and hydroxymethylene (HCOH) intermediates.20
Based on such mechanistic information, we have analyzed, in detail, the CO2 interaction and conversion on greigite (Fe3S4) surfaces. This magnetite (Fe3O4) isomorphic mineral is formed as an intermediate in the solid-state transformation of mackinawite into pyrite, playing a crucial role in the pyrite formation pathway.21–26 Fe3S4 has been widely identified in marine soils and sedimentary rocks of up to a few million years old.27,28 Greigite has also been associated as a catalyst in a number of key biochemical reactions associated with the “iron–sulfur world” hypothesis for the origin of life.12,29–37 Inspired by the CO2 conversion in this hypothesis and recent experimental results, we have explored the entire reaction network on the Fe3S4{111} surface, mapping out the complete energy profile, and implemented it into a comprehensive kinetic model under particular initial conditions. This model is based on unrestricted elementary reaction steps derived rigorously from density functional theory (DFT) calculations, which have been shown to be instrumental in unravelling multiple aspects of heterogeneous catalysis.17,20,38,39
Computational details
Electronic structure calculations
Periodic plane-wave DFT calculations were carried out to study the CO2 adsorption and its reactivity with adsorbed hydrogen on the greigite surface Fe3S4{111}. All calculations were performed using the VASP software.40,41 Ion–electron interactions were represented by the projector-augmented wave (PAW) method42 and the generalized gradient approximation (GGA) with the Perdew–Wang 91 functional43 within the spin interpolation formula of Vosko et al.44 We also considered non-spherical contributions from the gradient corrections to the PAW spheres. All the calculations include the long-range dispersion correction approach by Grimme,45 which is an improvement on pure DFT when considering large polarizable atoms.46–51 We have used the global scaling factor parameter optimized for PBE (s6 = 0.75). The Kohn–Sham valence states were expanded in a plane-waves basis set with a cut-off of 600 eV for the kinetic energy.52 This high value for the cut-off energy ensured that no Pulay stresses occurred within the cell during relaxations.The initial magnetic moment was described by high spin distributions in both types of Fe, octahedral and tetrahedral, with antiparallel orientation as reported previously.53,54 For an accurate treatment of the electron correlation in the localized d-Fe orbital, we have used the U approximation55,56 (Ueff = 1 eV),57–59 which improves the description of localized states in this type of system where standard LDA and GGA functionals fail.60 The choice of the U parameter is rather empirical, a feature that also appears when using computationally expensive hybrid functionals since the amount of Fock exchange is system-dependent.60–63 Calculations were described by a Monkhorst–Pack grid of 5 × 5 × 1 K-points, which ensures electronic and ionic convergence.64 The geometry of all stationary points was found with the conjugate-gradient algorithm and was considered converged when the force on each ion dropped below 0.03 eV Å−1. The energy threshold defining self-consistency of the electron density was set to 10−5 eV. In order to improve the convergence of the Brillouin-zone integrations, the partial occupancies were determined using the tetrahedron method with Blöch corrections smearing, with a set width for all calculations of 0.02 eV. All total energies have been extrapolated to KBT = 0 eV.
Computational model
The greigite unit cell consists of eight Fe3S4 subunits with a cubic lattice parameter of ∼9.8 Å,65,66 which is close to the calculated parameter resulting from the cell optimization (9.671 Å). The inverse thio-spinel arrangement is reflected by the formula AB2S4, where there are two possible locations for the Fe ions: the tetrahedral sites (A), filled by Fe3+ ions, and the octahedral sites (B), where both Fe3+ and Fe2+ ions co-exist.24,25,58,67–70 In agreement with experiments, the electronic structure shows a high-spin configuration for both Fe sites in antiparallel alignments, resulting in a ferromagnetic material.24,25,59,67,68,70–72 The orbital spin-splitting in the valence region results in localized outermost 3d-electrons and in ordered magnetism.69,73,74 Good agreement with experimental evidence has been obtained by using the same computational details as listed above.53,54We prepared the Fe3S4{111} surface as a slab model by cutting the bulk structure with the METADISE code,75 which considers periodicity in the plane direction and provides atomic layer stacking, resulting in non-dipolar reconstructions.76 The slab contains 56 atoms (24 Fe and 32 S) per unit cell, where the atoms are positioned in four layers of two Fe3S4 units each, exposing an area of 81.0 Å2 and a thickness of sufficient size to relax the two uppermost layers (four Fe3S4 units) until energy convergence, keeping the bulk structure frozen at the bottom. We added a vacuum width of 12 Å between periodic slabs, big enough to avoid the interaction between images. Isolated molecules were placed in the center of a 15 × 16 × 17 Å3 cell and optimized with the same criteria.
Every intermediate is linked to the next minimum along the reaction mechanism by a saddle point in the pathway of minimum energy across the potential surface. These saddle points are the reaction transition states (TS), which determine the kinetics of the process. We have determined the TS by means of either the dimer method77,78 or Climbing Image Nudge Elastic Band (CI-NEB),79,80 depending on how far the starting structure is from the products. For instance, CI-NEB was used when in the initial structure hydrogen is further than 2.5 Å from the hydrogenated centre. The identified TS were further confirmed by a vibrational frequency calculation, in which only one imaginary frequency is obtained, corresponding to the reaction coordinate. The dimer image is relaxed to both local minima, leading to the initial state and the final state.
All binding energies (EB) are given with respect to the naked slab and the reactants in the gas phase, see eqn (1). In the discussion of the DFT results, we have referred to energy values where the zero point energy (ZPE) correction is neglected unless noted otherwise.
 | (1) |
Kinetic model
We have presented an extensive kinetic model81–83 for the reduction of CO2 on Fe3S4{111} surfaces on the basis of 140 elementary steps, with the migration of the CO intermediate between the two different active sites, FeA and FeB. No assumptions regarding the mechanism or the rate-limiting step are made, all the processes are bi-directional, and all model parameters are rigorously derived from DFT calculations, which we have compared with experimental data collected under realistic conditions, see Fig. S1 in ESI.† In the frame of transition state theory,84,85 this kinetic model may poorly describe the surface kinetics when local ordering is important and diffusion of adsorbents as H ad-atoms is slow. In these cases, computationally expensive approximations can be used, for instance kinetic Monte Carlo (kMC) is capable of accounting for the correct local structure.86 Unfortunately, such an analysis remains completely impractical for reaction networks as complicated as the one described here. Lateral adsorbate–adsorbate interactions can also influence the stability of intermediates.87 Although we have included in the reaction network the effect of H ad-atoms near the catalytic center and the diffusion of CO2 and CO molecules among Fe-sites, we have nevertheless considered the total surface H coverage (θH) to be low under typical conditions, and we have also included the H2 evolution reaction as a function of θH. The maximum surface coverage was restricted to 1 ML, and multilayer adsorption was not considered. We have considered three different adsorption sites, a surface sulfur for the H ad-atom adsorption (eight per unit cell) and the metal centers, FeA or FeB (one site per cell).Results and discussion
In order to develop a comprehensive model, firstly we have systematically studied the adsorption–desorption processes for the different reactants, followed by their co-adsorption and reaction leading to an extensive reaction network. Secondly, we have implemented these results in a micro-kinetics model to obtain a description of the process dynamics. Given the large amount of data, we have not described all the results in detail; the interested reader can find more relevant data in the ESI.† Finally, we have discussed the overall reaction trends and their implications in the CO2 conversion process.Density functional theory results
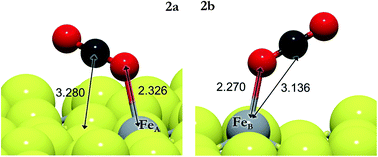
Greigite (Fe3S4) is an inverse spinel-structured material whose particles in hydrothermal synthesis expose {001} and {111} surfaces.88 We have focused our attention on the Fe3S4{111} surface as this surface has shown conversion of carbonate species.37 The Fe3S4{111} surface contains eight S atoms and three Fe atoms at the top layer of a unit cell, two from a tetrahedral bulk position (FeA) and one from an octahedral bulk position (FeB).| System | Site | E B (eV) | d O–C (Å) | ∠O–C–O (°) | ν C–O (cm−1) | q (e−) |
|---|---|---|---|---|---|---|
| CO2 | FeA | −0.02 | 1.176 | 178.3 | 2359 | 0.0 |
| CO2 | FeB | −0.19 | 1.175 | 179.4 | 2363 | 0.0 |
| CO2 | vS | −0.20 | 1.175 | 179.4 | 2366 | 0.0 |
| CO#2 | FeA | 0.40 | 1.233 | 138.1 | 1879 | 0.4 |
| CO#2 | FeB | 0.19 | 1.207 | 157.4 | 2103 | 0.2 |
| CO#2 + 2H | FeA | −0.33 | 1.250 | 131.9 | 1700 | 0.8 |
| CO#2 + 2H | FeB | −0.31 | 1.213 | 153.9 | 2050 | 0.8 |
The positive EB values of the activated CO2 with respect to the energy reference indicate the preference of the molecule to desorb without modification before being activated. However, the presence of co-adsorbed hydrogens stabilizes CO#2 and its transition state, as shown by the reaction energies in Table 2. The lack of H ad-atoms on the surface makes the activation of CO2 thermodynamically unfavourable and high pressures are required to increase the CO2 activity. On the other hand, the presence of electron-donating species, i.e. H ad-atoms, enhances the CO2 activation by decreasing the energy barrier, especially on electron deficient centers such as FeB.
| Label | Reaction | Site | E A (eV) | E R (eV) | ΔE (eV) |
|---|---|---|---|---|---|
| 2a | CO*2 → CO#2 | FeA | 0.43 | 0.39 | 0.36 |
| 2b | CO*2 → CO#2 | FeB | 0.41 | 0.38 | 0.20 |
| 2c | CO*2 + 2H* → CO#2 + 2H* | FeA | 0.62 | 0.06 | −0.33 |
| 2d | CO*2 + 2H* → CO#2 + 2H* | FeB | 0.36 | 0.32 | −0.30 |
| Label | Mechanism | Reaction | Site | E A (eV) | E R (eV) | ΔE (eV) |
|---|---|---|---|---|---|---|
| 3a | LH | CO#2 + 2H* → HCOO* + H* | FeA | 1.21 | −0.28 | −0.60 |
| 3b | CO#2 + 2H* → HCOO* + H* | FeB | 1.15 | −1.25 | −1.56 | |
| 3c | CO#2 + 2H* → COOH* + H* | FeA | 0.10 | 0.02 | −0.31 | |
| 3d | CO#2 + 2H* → COOH* + H* | FeB | 0.71 | −0.16 | −0.46 | |
| 3e | ER | CO2 + 2H* → HCOO* + H* | FeA | 0.94 | 0.03 | −0.60 |
| 3f | CO2 + 2H* → HCOO* + H* | FeB | 1.86 | −0.92 | −1.56 | |
| 3g | CO2 + 2H* → COOH* + H* | FeA | 0.84 | −0.17 | −0.81 | |
| 3h | CO2 + 2H* → COOH* + H* | FeB | 1.28 | 0.19 | 0.65 |
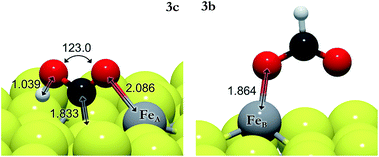
We have also investigated the Eley–Rideal (ER) mechanism, describing the interaction between gas phase CO2 molecules and pre-adsorbed H on Fe3S4{111}. We have brought the molecule from a vacuum to the Fe center, exposing independently carbon or oxygen to the H ad-atom, which produces formate or hydrocarboxyl intermediates on the surface. The reaction energies are summarized in Table 3 (3e–3h). HCOO is derived from reaction 3e on FeA, which is the most suitable pathway for the formation of formic acid after surmounting a barrier of 0.3 eV above the energy reference. The generation of HCOO on FeB has an energy barrier of over 1 eV. Optimized HCOO binds to both FeA and FeB with an Fe–O distance of ∼1.8 Å, see Fig. 2. The formate intermediate was also identified experimentally on metallic Cu upon exposure to CO2 and H2 gases (ref. 89 and references therein).
The barrier energies for COOH formation via the ER mechanism are 0.1 (3g) and 0.6 eV (3h) lower than those for 3e and 3f on FeA and FeB, respectively. The formation of COOH as an intermediate is not surprising as it has been identified as the key reaction intermediate in the water gas shift reaction.19 Hydrocarboxyl has two distinguishable configurations depending on the direction of the hydroxyl group: trans-COOH and cis-COOH. The energy difference makes the trans-configuration the most stable by 0.4 eV.
Considering both mechanisms, i.e. LH and ER, the most favorable paths leading to HCOO intermediates are 3evia ER and 3bvia LH on FeA and FeB, respectively. In the transition state structure for the 3e process, almost linear CO2 hovers close to the H ad-atom at a distance (C–H) of 1.526 Å and the molecule starts bending with an angle of 145°. The activation energy for the process 3b is 1.15 eV above that of the reactants and the C–H distance (1.692 Å) indicates an early transition state. The lowest activation energy for the formation of COOH is reaction 3c, although the energy required for the adsorption of the reactants and products on FeA is higher than that for the ER reaction 3g. The early saddle point for the hydrogenation of CO#2via3c places the H at 1.300 Å from the oxygen on FeA, while on FeB, the CO2 in the 3d transition state lies at a distance of 1.374 Å from the H. Upon COOH formation, the HO–C bond becomes weaker and elongates by 0.1 Å compared with CO2. We have further investigated the COOH dissociation to CO and OH, and found that it is thermodynamically and kinetically likely (EA = 0.60 eV; ER = −0.11 eV), proceeding to the formation of H2O + CO.
The small difference between the energy barriers (2c and 3e < 0.05 eV) to HCOO and COOH intermediates indicates the low selectivity of the process on FeA, while a difference of 0.44 eV between the activation barriers of 3b and 3d indicates the selectivity for COOH intermediates on FeB. However, external conditions and the presence of dopants and promoters may influence the stability of intermediates, increasing the energy difference and therefore the selectivity.
| Label | Reaction | Site | E A (eV) | E R (eV) | ΔE (eV) |
|---|---|---|---|---|---|
| 4a | HCOO* + H* → HCOO1H* | FeA | 0.08 | −0.45 | −1.05 |
| 4b | HCOO* + H* → HCOO1H* | FeB | 0.56 | 0.28 | −1.28 |
| 4c | HCOO* + H* → HCOO2H* | FeA | 1.28 | 0.19 | −0.42 |
| 4d | HCOO* + H* → HCOO2H* | FeB | 2.12 | 0.71 | −0.84 |
| 4e | HCOO* + H* → H2CO + O* | FeA | 1.83 | 1.51 | 1.74 |
| 4f | HCOO* + H* → H2COO* | FeB | 2.12 | 1.30 | −0.26 |
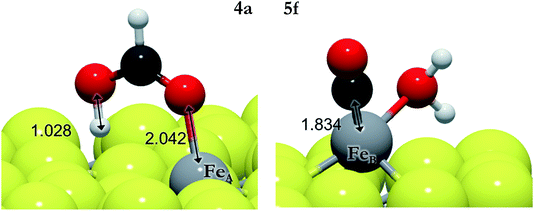
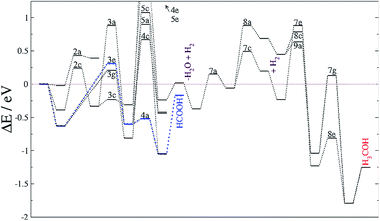
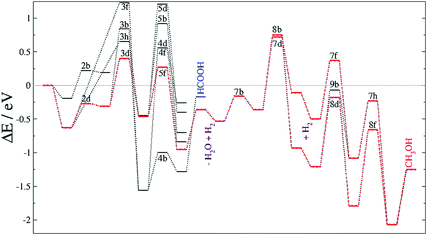
We have explored the energy profile for HCOOH formation, see Fig. 3, and found that, from HCOO, the transition states leading to hydrogenation of the uncoordinated oxygen (4a,b) are more favourable than those leading to hydrogenation of the oxygen coordinated to Fe (4c,d). We have also noticed that the process is thermodynamically and kinetically more likely on FeB than on FeA. Between the two sites, pathway 4a is more feasible, leaving the HCOOH molecule adsorbed on FeA with a binding energy of −0.86 eV. The formation of HCOOH is considerably more likely than the formation of formaldehyde (4e and 4f), although this species has been identified on other catalysts as a potential intermediate in methanol production from CO2.17,90 Once HCOO is hydrogenated to form formaldehyde, its precursor (H2COO) remains adsorbed on FeB, but on FeA, the C–O bond is completely broken and H2CO is released from the surface, leaving an O ad-atom strongly adsorbed on FeA, thereby poisoning the active site. Formaldehyde is also a product of CO hydrogenation as described below.
Similarly to the formate intermediate, further hydrogenation of COOH leads to thermodynamically favorable HCOOH, but the activation energy (EA > 1.2 eV) makes the reaction kinetically implausible (reactions 5a and 5b). As summarized in Table 5, dihydroxycarbene (HOCOH) is an alternative hydrogenation route as experimentally proposed in the methanol synthesis on oxide catalysts,91 but its formation is highly inaccessible from a kinetic point of view (5c and 5d). Nevertheless, we have considered HOCOH formation and dissociation to COH* + OH*, as suggested on Cu{111}.17 However, on Fe3S4{111}, the reaction pathway is inhibited not only by the activation energy forming HOCOH but also by the unlikely scission of HO–C, which has ER > 0.8 eV and EA > 1.4 eV on both Fe sites. Under certain conditions, HOCOH may be observable experimentally but it is not part of the main reaction pathway on greigite. The hydrogenation of the OH group on the COOH intermediate takes place mostly on FeB and leads to the formation of co-adsorbed H2O and CO (reactions 5e and 5f). While the process is slightly endothermic on FeA with a large energy barrier above the reference of 1.6 eV, on FeB it is energetically favourable, see Fig. 3. The co-adsorbed H2O stabilizes the system by 0.58 eV and, compared with HCOOH formation via reaction 3e, its energy barrier is higher by less than 0.05 eV.
| Label | Reaction | Site | E A (eV) | E R (eV) | ΔE (eV) |
|---|---|---|---|---|---|
| 5a | COOH* + H* → HCOOH* | FeA | 1.21 | −0.74 | −1.05 |
| 5b | COOH* + H* → HCOOH* | FeB | 1.38 | −0.24 | −0.70 |
| 5c | COOH* + H* → HOCOH* | FeA | 1.39 | −0.13 | −0.44 |
| 5d | COOH* + H* → HOCOH* | FeB | 1.67 | 0.07 | −0.40 |
| 5e | COOH* + H* → CO* + H2O | FeA | 1.84 | 0.07 | −0.24 |
| 5f | COOH* + H* → CO* + H2O* | FeB | 0.73 | −0.49 | −0.95 |
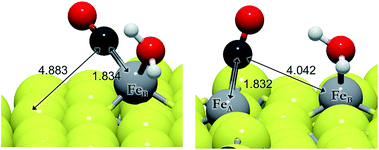
We have evaluated the movement of CO between both FeB and FeA from 5f and 5e, respectively, and also considered the presence of co-adsorbed H2O (on FeB) or hydrogen ad-atoms, see Table 6. Before and after H2O desorption from FeB, the migration of CO to FeA is endothermic and kinetically impractical (EA > 1.5 eV), see Fig. 4. We have found that once water desorbs, the CO molecule shrinks the FeB–C bond by 0.08 Å and lies perpendicular to the surface at 1.754 Å. The intramolecular bond is 1.161 Å, which, together with a shift in its stretching frequency of 103 cm−1 with respect to the isolated molecule (d(C–O) = 1.142 Å, ν(C–O) = 2129 cm−1), indicates a weak C–O bond. The presence of co-adsorbed hydrogens decreases the energy barrier by up to 0.82 eV, making the process more likely, although (A)CO is 0.16 eV less stable than (B)CO. The effect of the hydrogens is similar to the CO2 activation process, which is related to the availability of charge density. The stabilization of the CO adsorption on FeA by the H ad-atoms is observable in the Fe–C distance differences – the FeA–C bond is 0.18 Å larger than the FeB–C bond compared to 0.12 Å in the presence of hydrogens – and the asymmetric stretching frequencies vary by 23 and 11 cm−1, respectively, without and with H ad-atoms. We have carried out the hydrogenation of CO on both sites, FeA and FeB, independently.
| Label | Reaction | E A (eV) | E R (eV) | ΔE (eV) |
|---|---|---|---|---|
| 6a | (B)CO* + (B)H2O* → (A)CO* + (B)H2O* | 1.57 | 0.46 | −0.49 |
| 6b | (B)CO* → (A)CO* | 1.84 | 0.39 | 0.02 |
| 6c | (B)CO* + 2H* → (A)CO* + 2H* | 0.82 | 0.16 | −0.37 |
| Label | Reaction | Site | E A (eV) | E R (eV) | ΔE (eV) |
|---|---|---|---|---|---|
| 7a | CO* + 2H* → HCO* + H* | FeA | 0.52 | 0.31 | −0.06 |
| 7b | CO* + 2H* → HCO* + H* | FeB | 0.37 | 0.17 | −0.36 |
| 7c | HCO* + H* → HCOH* | FeA | 0.55 | 0.26 | 0.20 |
| 7d | HCO* + H* → HCOH* | FeB | 1.09 | 0.26 | −0.11 |
| 7e | HCOH* + 2H* → H2COH* + H* | FeA | 1.11 | −0.81 | −1.04 |
| 7f | HCOH* + 2H* → H2COH* + H* | FeB | 0.86 | −0.58 | −1.08 |
| 7g | H2COH* + H* → H3COH* | FeA | 1.17 | −0.75 | −1.79 |
| 7h | H2COH* + H* → H3COH* | FeB | 0.85 | −0.99 | −2.07 |
| Label | Reaction | Site | E A (eV) | E R (eV) | ΔE (eV) |
|---|---|---|---|---|---|
| 8a | HCO* + H* → H2CO* | FeA | 0.94 | 0.75 | 0.69 |
| 8b | HCO* + H* → H2CO* | FeB | 1.11 | −0.57 | −0.93 |
| 8c | H2CO* + 2H* → H3CO* + H* | FeA | 0.34 | −1.68 | −1.23 |
| 8d | H2CO* + 2H* → H3CO* + H* | FeB | 1.04 | −0.58 | −1.79 |
| 8e | H3CO* + H* → H3COH* | FeA | 0.42 | −0.98 | −1.79 |
| 8f | H3CO* + H* → H3COH* | FeB | 1.14 | −0.28 | −2.07 |
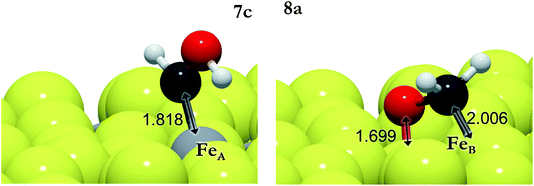
The carbon monoxide hydrogenation step is slightly unfavorable thermodynamically, ER(FeB) < 0.2 eV, although the overall energy is lower than the reference energy (ΔE), indicating that it is a viable process. On FeA, the reaction 7a is endothermic by 0.3 eV whereas it is also kinetically controlled as the transition state lies above the energy reference. The transition states for the formation of HCOH (7c,d) and H2CO (8a,b) also lie above the reference energy on both FeA and FeB, see Fig. 5. These processes, thus, require energy from external sources, such as a natural chemiosmotic or applied potential to surmount the energy barrier. The over-potential needed for the formation of HCOH on FeA (7c) is the smallest one (0.5 eV), leading to a downhill conversion towards CH3OH. The HCOH intermediate has also been detected during CO reduction on transition metal surfaces.92 The presence of co-adsorbed hydrogens stabilises HCOH, whereas the production becomes thermodynamically unfavourable in pathway 8. The formation of HCOH (7c) has an energy barrier 0.4 eV lower than that for the production of H2CO (8a), indicating selectivity of this process on FeA. On the FeB adsorption site, the EA values are bigger than those for FeA because the reactants start from a more stable position (by 0.30 eV), although the transition states for 7d and 8b are 0.1 and 0.2 eV more favourable than their counterparts on FeA.
Although CO reduction is likely to take place following process 7c, the hydrogenation of HCOH (7e) has a slightly higher energy barrier than the 8c process, by 0.1 eV, leading to competing processes. The reduction of H2CO via the 9a process is 0.2 eV lower than that via7e, allowing the hydrogenation of the oxy group and lying −1.04 eV below the energy reference (Table 9). However, the 7f, 8d and 9b processes on FeB require less energy to surmount their transition states, leading to intermediates stabilised by up to 1.8 eV below the reference. Once methanol is formed through either the 7 or 8 pathway, it binds to FeA or FeB with an adsorption energy of −0.54 and −0.82 eV, respectively. Overall, the CH3OH formation is more feasible on FeB where only 7d and 8b are limiting steps.
| Label | Reaction | Site | E A (eV) | E R (eV) | ΔE (eV) |
|---|---|---|---|---|---|
| 9a | H2CO* + 2H* → H2COH* + H* | FeA | 0.18 | −1.49 | −1.04 |
| 9b | H2CO* + 2H* → H2COH* + H* | FeB | 1.14 | 0.13 | −1.08 |
The formate adsorbed on FeA, the product of reaction 3e, is followed by a fast process producing HCOOH, which remains adsorbed, suggesting the possibility for secondary reactions, e.g. C–C formation or combining with NH2 to give formamide.12 This agrees with previous experiments, which observed large amounts of formate on metal surfaces upon exposure to CO2 and H2 gases.89,93 Thus, the rate-limiting step for HCOOH formation is the first CO2 hydrogenation with a TS energy 0.3 eV above the reference.
Recently identified as a key intermediate in the water gas shift reaction,19,94 we have identified hydrocarboxyl as the first intermediate in the CO formation prior to methanol yield. The reverse water gas shift reaction takes place when oxygen from the CO2 molecule reacts with H to produce CO and H2O, i.e. processes 3d and 5f. This pathway on FeB led to carbon monoxide bonded to FeB with an adsorption energy of −1.1 eV, which is stabilized by the presence of H ad-atoms (by −0.17 eV). Although the formation of HCO is thermodynamically feasible, its hydrogenation has an energy barrier of at least 0.75 eV, processes (7 and 8), which are driven by very stable intermediates. The reduction of HCO is, hence, the rate-limiting step for CH3OH formation from CO2 on Fe3S4{111}. Once the limiting step is surmounted, the methoxy route (8) is the most favourable despite the fact that pathway 7 is also downhill energetically. Methoxy intermediates are very stable and remain on the surface for longer, which may lead to interactions with other molecules or intermediates, leading to e.g. longer chain hydrocarbons.12
Kinetic model results
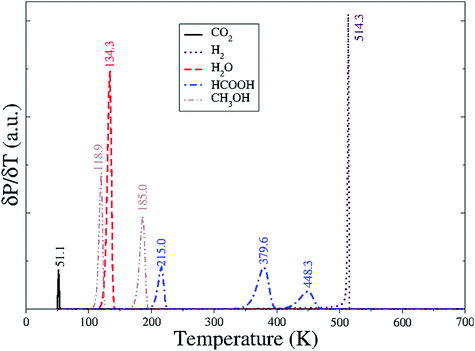
We have applied a kinetic model, including the adsorption–desorption of the molecules and all the steps described above, in a consistent reaction network. We have characterized the desorption of CO2, H2O, H2, HCOOH and CH3OH individually and modelled the temperature programmed desorption (TPD) starting with full coverage and raising the temperature by 1 K s−1. Molecules like CO2, HCOOH and CH3OH that have different adsorption sites, i.e. FeA and FeB, were equally distributed among them. For example, there are two configurations of HCOOH on FeA and two on FeB, and we set each configuration at an initial coverage of 0.25 ML. We have also considered secondary reactions like the exchange between CO2 adsorption sites and the dissociation–association of the water molecule. The formation of H2 is considered as a function of the H-coverage, for which we have investigated the associative desorption with different coverages, i.e. 0.25, 0.5, 0.75 and 1 ML, over the eight sulfur sites of an Fe3S4{111} cell unit. The overlap of these individual TPDs led to Fig. 8.Physisorbed CO2 desorbs from the surface with a minimal thermal energy, in agreement with the weak interaction with either FeB or FeA. Separately, H ad-atoms remain scattered on the surface until the temperature reaches 500 K, when they recombine and evolve as H2 giving a sharp peak, which is linked to a fast process. Water molecules desorb from FeB relatively easily at 135 K with a narrow signal; note that it is a single molecule per unit cell. Formic acid is desorbed in three signals instead of the four expected from the different adsorbed conformations due to the overlapping of two signals around 378 K, from reactions 4a and 4d. Methanol TPD also presents multiple signals, at 119 K and at 185 K, related to the molecule adsorbed on FeA and FeB, respectively.
We have derived the reaction constants for the forward and the reverse reactions, tabulated in Table S1.† The relationship between these constants (K = K+1/K−1) provides important information with respect to a particular step. For instance, although reaction 3f has a high energy barrier compared with other CO2 hydrogenation processes, the driving force of the HCOO formation makes K+1 bigger than K−1 and therefore the equilibrium constant (K) shifts towards formate. We have plotted the logarithm of K for every hydrogenation process in Fig. 9.
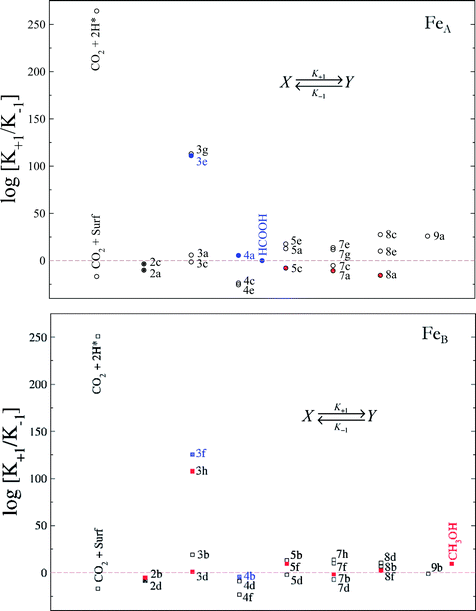 | ||
| Fig. 9 Relationship between the equilibrium constants (log[K+1/K−1]) at a temperature of 300 K for the CO2 reduction towards HCOOH (blue) and CH3OH (red) on FeA (circles) and FeB (squares) sites on the Fe3S4{111} surface. The labels indicate the processes according to Fig. S3.† Formic acid and methanol desorption/adsorption constants are included on FeA and FeB, respectively. The solid symbols show the limiting step for each mechanism. | ||
Although the activation of CO2 on the surface is unlikely (reactions 2a–d), the presence of H ad-atoms enhances its molecular adsorption on either FeA or FeB as the top left values of Fig. 9 indicate. However, the Eley–Rideal mechanism for the formate formation on FeA is preferred and this is followed by a second hydrogenation (4a), leading to formic acid, whose desorption, however, is the slowest step, thereby reducing its production. On FeB, the formation of formic acid is capped by the second hydrogenation (4b) with the reverse process being more favourable, which means that formic acid released from FeA would adsorb on FeB and remain as formate, limiting the site availability. The processes 5c, 7a and 8a on FeA have similar consequences with respect to methanol formation. The methanol formation on FeB may take place via the highly favourable Eley–Rideal mechanism (3h) or through CO2 activation and hydrocarboxyl formation (2b and 3d, respectively). The only slightly reverse step is the hydrogenation of CO (7b), which limits the process via the H2CO intermediate, mechanism 8.
The mechanism showed HCOOH and CH3OH as products of the CO2 conversion with the reaction constants indicating that intermediate species like formate, carbon monoxide and CHxO have a long enough residence time on the surface to allow them to react with other C-species, leading to e.g. acetic and pyruvic acid. Indeed these C2 and C3 products were detected experimentally after exposing Fe3S4 particles to a saturated aqueous solution of CO2 under a mild reduction potential.12
Conclusions
We have carried out an extensive density functional theory study to map the CO2 reduction mechanism network on the mineral surface Fe3S4{111}. Among the multiple reaction pathways explored, we have discerned the most favourable by using arguments based on energy profiles and reaction constants. Our results show distinctive behaviour for the different adsorption sites: FeA and FeB. On FeA, the CO2 conversion occurs through a formate intermediate via Eley–Rideal mechanism, yielding HCOOH. On FeB, the formation of the hydrocarboxyl intermediate is favoured, which dissociates and yields CO on the surface plus a water molecule. Further hydrogenations of CO are limited by the formation of the HCO intermediate; despite being energetically favourable compared with the energy reference, the reaction constant towards HCO is smaller than that of the reverse processes. Following reductions are driven by the stability of their products. Methanol, in contrast to formic acid, desorbs from the surface easily, releasing an active site for further CO2 conversion. Although the production of formic acid or methanol is determined by the adsorption site, CO2 and intermediates are able to move from one site to another, as shown in step 6.Thus, Fe3S4{111} catalyzes the CO2 transformation by hydrogen, yielding mostly formic acid and methanol, where the rate-limiting step is the CO2 activation via Langmuir–Hinshelwood mechanism, and indicating that the production of methanol is through the formation of the HCO intermediate. The selectivity towards particular products increases, e.g. by blocking selectively an Fe site, where capping FeA, for instance, leads to the reduction of CO2 into methanol.
Acknowledgements
We acknowledge the Engineering & Physical Sciences Research Council (grant EP/H046313, EP/K001329 and EP/K016288) for funding. This work made use of the HECToR and ARCHER facilities, the UK's national high-performance computing service, which is provided by UoE HPCx Ltd at the University of Edinburgh, Cray Inc. and NAG Ltd, funded by the Office of Science and Technology through EPSRC's High End Computing Programme and provided via our membership of the HPC Materials Chemistry Consortium (EPSRC grants EP/D504872, EP/F067496 and EP/L000202). The authors also acknowledge the use of the UCL Legion High Performance Computing Facility and the Advanced Research Computing @ Cardiff (ARCCA) at Cardiff University, and associated support services, in the completion of this work. All data created during this research is openly available from the University of Cardiff Research Portal at http://dx.doi.org/10.17035/d.2016.0008385635.References
- M. C. Urban, Science, 2015, 348, 571–573 CrossRef CAS PubMed.
- J. Rogelj, J. Nabel, C. Chen, W. Hare, K. Markmann, M. Meinshausen, M. Schaeffer, K. Macey and N. Hohne, Nature, 2010, 464, 1126–1128 CrossRef CAS PubMed.
- H. Arakawa, M. Aresta, J. N. Armor, M. A. Barteau, E. J. Beckman, A. T. Bell, J. E. Bercaw, C. Creutz, E. Dinjus, D. A. Dixon, K. Domen, D. L. DuBois, J. Eckert, E. Fujita, D. H. Gibson, W. A. Goddard, D. W. Goodman, J. Keller, G. J. Kubas, H. H. Kung, J. E. Lyons, L. E. Manzer, T. J. Marks, K. Morokuma, K. M. Nicholas, R. Periana, L. Que, J. Rostrup-Nielson, W. M. Sachtler, L. D. Schmidt, A. Sen, G. A. Somorjai, P. C. Stair, B. R. Stults and W. Tumas, Chem. Rev., 2001, 101, 953–996 CrossRef CAS PubMed.
- L. Plasseraud, ChemSusChem, 2010, 3, 631–632 CrossRef CAS.
- M. Meinshausen, N. Meinshausen, W. Hare, S. C. B. Raper, K. Frieler, R. Knutti, D. J. Frame and M. R. Allen, Nature, 2009, 458, 1158–1162 CrossRef CAS PubMed.
- M. Aresta and A. Dibenedetto, Dalton Trans., 2007, 2975–2992 RSC.
- S. C. Roy, O. K. Varghese, M. Paulose and C. A. Grimes, ACS Nano, 2010, 4, 1259–1278 CrossRef CAS PubMed.
- G. Centi and S. Perathoner, Catal. Today, 2009, 148, 191–205 CrossRef CAS.
- H. J. Freund and M. W. Roberts, Surf. Sci. Rep., 1996, 25, 225–273 CrossRef.
- M. R. Kember, A. Buchard and C. K. Williams, Chem. Commun., 2011, 47, 141–163 RSC.
- N. S. Spinner, J. A. Vega and W. E. Mustain, Catal. Sci. Technol., 2012, 2, 19–28 CAS.
- A. Roldan, N. Hollingsworth, A. Roffey, H. U. Islam, J. B. Goodall, C. R. Catlow, J. A. Darr, W. Bras, G. Sankar, K. B. Holt, G. Hogarth and N. H. de Leeuw, Chem. Commun., 2015, 51, 7501–7504 RSC.
- H.-J. Freund and M. W. Roberts, Surf. Sci. Rep., 1996, 25, 225–273 CrossRef.
- J. P. Pradiser and C. M. Pradier, Carbon Dioxide Chemistry: Environmental Issues, Woodhead Publishing, 1994 Search PubMed.
- M. Aresta and A. Dibenedetto, Dalton Trans., 2007, 2975–2992 RSC.
- U. Jayarathne, P. Chandrasekaran, H. Jacobsen, J. T. Mague and J. P. Donahue, Dalton Trans., 2010, 39, 9662–9671 RSC.
- Y. F. Zhao, Y. Yang, C. Mims, C. H. F. Peden, J. Li and D. H. Mei, J. Catal., 2011, 281, 199–211 CrossRef CAS.
- T. Riedel, M. Claeys, H. Schulz, G. Schaub, S. S. Nam, K. W. Jun, M. J. Choi, G. Kishan and K. W. Lee, Appl. Catal., A, 1999, 186, 201–213 CrossRef CAS.
- A. A. Gokhale, J. A. Dumesic and M. Mavrikakis, J. Am. Chem. Soc., 2008, 130, 1402–1414 CrossRef CAS PubMed.
- L. C. Grabow and M. Mavrikakis, ACS Catal., 2011, 1, 365–384 CrossRef CAS.
- S. Hunger and L. G. Benning, Geochem. Trans., 2007, 8, 1–20 CrossRef PubMed.
- L. G. Benning, R. T. Wilkin and H. L. Barnes, Chem. Geol., 2000, 167, 25–51 CrossRef CAS.
- R. T. Wilkin and H. L. Barnes, Geochim. Cosmochim. Acta, 1996, 60, 4167–4179 CrossRef CAS.
- M. J. Dekkers, H. F. Passier and M. A. A. Schoonen, Geophys. J. Int., 2000, 141, 809–819 CrossRef.
- M. J. Dekkers and M. A. A. Schoonen, Geophys. J. Int., 1996, 126, 360–368 CrossRef.
- A. R. Lennie, S. A. T. Redfern, P. E. Champness, C. P. Stoddart, P. F. Schofield and D. J. Vaughan, Am. Mineral., 1997, 82, 302–309 CAS.
- U. Frank, N. R. Nowaczyk and J. F. W. Negendank, Geophys. J. Int., 2007, 168, 904–920 CrossRef CAS.
- U. Frank, N. R. Nowaczyk and J. F. W. Negendank, Geophys. J. Int., 2007, 168, 921–934 CrossRef CAS.
- S. Mann, N. H. C. Sparks, R. B. Frankel, D. A. Bazylinski and H. W. Jannasch, Nature, 1990, 343, 258–261 CrossRef CAS.
- M. Posfai, P. R. Buseck, D. A. Bazylinski and R. B. Frankel, Am. Mineral., 1998, 83, 1469–1481 CrossRef CAS.
- M. Posfai, P. R. Buseck, D. A. Bazylinski and R. B. Frankel, Science, 1998, 280, 880–883 CrossRef CAS PubMed.
- W. Martin, J. Baross, D. Kelley and M. J. Russell, Nat. Rev. Microbiol., 2008, 6, 805–814 CAS.
- M. J. Russell and A. J. Hall, Evolution of Early Earth's Atmosphere, Hydrosphere, and Biosphere: Constraints from Ore Deposits, 2006, vol. 198, pp. 1–32 Search PubMed.
- W. Martin and M. J. Russell, Philosophical Transactions of the Royal Society of London Series B-Biological Sciences, 2003, vol. 358, pp. 59–83 Search PubMed.
- C. Huber and G. Wachtershauser, Science, 1997, 276, 245–247 CrossRef CAS PubMed.
- G. Wachtershauser, Prog. Biophys. Mol. Biol., 1992, 58, 85–201 CrossRef CAS PubMed.
- G. Wachtershauser, Microbiol. Rev., 1988, 52, 452–484 CAS.
- C. J. Cramer and D. G. Truhlar, Phys. Chem. Chem. Phys., 2009, 11, 10757–10816 RSC.
- J. K. Norskov, T. Bligaard, J. Rossmeisl and C. H. Christensen, Nat. Chem., 2009, 1, 37–46 CrossRef CAS PubMed.
- G. Kresse and J. Hafner, Phys. Rev. B: Condens. Matter Mater. Phys., 1993, 47, 558 CrossRef CAS.
- G. Kresse and J. Furthmüller, Comput. Mater. Sci., 1996, 6, 15 CrossRef CAS.
- G. Kresse and D. Joubert, Phys. Rev. B: Condens. Matter Mater. Phys., 1999, 59, 1758 CrossRef CAS.
- J. P. Perdew, J. A. Chevary, S. H. Vosko, K. A. Jackson, M. R. Pederson, D. J. Singh and C. Fiolhais, Phys. Rev. B: Condens. Matter Mater. Phys., 1992, 46, 6671 CrossRef CAS.
- S. H. Vosko, L. Wilk and M. Nusair, Can. J. Phys., 1980, 58, 1200–1211 CrossRef CAS.
- S. Grimme, J. Comput. Chem., 2006, 27, 1787–1799 CrossRef CAS PubMed.
- S. Irrera, A. Roldan, G. Portalone and N. H. de Leeuw, J. Phys. Chem. C, 2013, 117, 3949–3957 CAS.
- N. Y. Dzade, A. Roldan and N. H. de Leeuw, J. Chem. Phys., 2013, 139, 124708 CrossRef CAS PubMed.
- S. S. Tafreshi, A. Roldan, N. Y. Dzade and N. H. de Leeuw, Surf. Sci., 2014, 622, 1–8 CrossRef CAS.
- S. Haider, A. Roldan and N. H. de Leeuw, J. Phys. Chem. C, 2014, 118, 1958–1967 CAS.
- N. Dzade, A. Roldan and N. de Leeuw, Minerals, 2014, 4, 89–115 CrossRef CAS.
- F. Zhang, J. D. Gale, B. P. Uberuaga, C. R. Stanek and N. A. Marks, Phys. Rev. B: Condens. Matter Mater. Phys., 2013, 88, 054112–054117 CrossRef.
- N. Mermin, Phys. Rev., 1965, 137, 1441–1443 CrossRef.
- A. Roldan, D. Santos-Carballal and N. H. de Leeuw, J. Chem. Phys., 2013, 138, 204712–204716 CrossRef CAS PubMed.
- D. Santos-Carballal, A. Roldan, R. Grau-Crespo and N. H. de Leeuw, Phys. Rev. B: Condens. Matter Mater. Phys., 2015, 91, 195106 CrossRef.
- V. I. Anisimov, M. A. Korotin, J. Zaanen and O. K. Andersen, Phys. Rev. Lett., 1992, 68, 345–348 CrossRef CAS PubMed.
- S. L. Dudarev, G. A. Botton, S. Y. Savrasov, C. J. Humphreys and A. P. Sutton, Phys. Rev. B: Condens. Matter Mater. Phys., 1998, 57, 1505–1509 CrossRef CAS.
- A. J. Devey, R. Grau-Crespo and N. H. de Leeuw, Phys. Rev. B: Condens. Matter Mater. Phys., 2009, 79, 195126–195133 CrossRef.
- L. Chang, B. D. Rainford, J. R. Stewart, C. Ritter, A. P. Roberts, Y. Tang and Q. W. Chen, J. Geophys. Res.: Solid Earth, 2009, 114, 1–10 Search PubMed.
- L. Chang, A. P. Roberts, Y. Tang, B. D. Rainford, A. R. Muxworthy and Q. Chen, J. Geophys. Res., 2008, 113, 1–16 CrossRef.
- I. D. R. Moreira, F. Illas and R. L. Martin, Phys. Rev. B: Condens. Matter Mater. Phys., 2002, 65, 155102–155116 CrossRef.
- I. Ciofini, F. Illas and C. Adamo, J. Chem. Phys., 2004, 120, 3811–3816 CrossRef CAS PubMed.
- F. Illas and R. L. Martin, J. Chem. Phys., 1998, 108, 2519–2527 CrossRef CAS.
- D. Munoz, N. M. Harrison and F. Illas, Phys. Rev. B: Condens. Matter Mater. Phys., 2004, 69, 085115–085124 CrossRef.
- H. J. Monkhorst and J. D. Pack, Phys. Rev. B: Solid State, 1976, 13, 5188–5192 CrossRef.
- J. M. D. Coey, M. R. Spender and A. H. Morrish, Solid State Commun., 1970, 8, 1605 CrossRef CAS.
- M. R. Spender, J. M. D. Coey and A. H. Morrish, Can. J. Phys., 1972, 50, 2313–2326 CrossRef CAS.
- D. J. Vaughan and J. A. Tossell, Phys. Chem. Miner., 1983, 9, 253–262 CrossRef CAS.
- D. J. Vaughan and J. A. Tossell, Am. Mineral., 1981, 66, 1250–1253 CAS.
- D. J. Vaughan and J. R. Craig, Am. Mineral., 1985, 70, 1036–1043 CAS.
- K. K. Surerus, M. C. Kennedy, H. Beinert and E. Munck, Proc. Natl. Acad. Sci. U. S. A., 1989, 86, 9846–9850 CrossRef CAS.
- D. J. Vaughan and M. S. Ridout, J. Inorg. Nucl. Chem., 1971, 33, 741–746 CrossRef.
- M. Braga, S. K. Lie, C. A. Taft and W. A. Lester, Phys. Rev. B: Condens. Matter Mater. Phys., 1988, 38, 10837–10851 CrossRef CAS.
- D. J. Vaughan and J. A. Tossell, Am. Mineral., 1981, 66, 1250–1253 CAS.
- D. Rickard and G. W. Luther, Chem. Rev., 2007, 107, 514–562 CrossRef CAS PubMed.
- G. W. Watson, E. T. Kelsey, N. H. deLeeuw, D. J. Harris and S. C. Parker, J. Chem. Soc., Faraday Trans., 1996, 92, 433–438 RSC.
- P. W. Tasker, J. Phys. C: Solid State Phys., 1979, 12, 4977–4984 CrossRef CAS.
- G. Henkelman and H. Jonsson, J. Chem. Phys., 1999, 111, 7010–7022 CrossRef CAS.
- A. Heyden, A. T. Bell and F. J. Keil, J. Chem. Phys., 2005, 123, 224101–224115 CrossRef PubMed.
- G. Henkelman and H. Jonsson, J. Chem. Phys., 2000, 113, 9978–9985 CrossRef CAS.
- G. Henkelman, B. P. Uberuaga and H. Jonsson, J. Chem. Phys., 2000, 113, 9901–9904 CrossRef CAS.
- I. Chorkendorff and J. W. Niemantsverdriet, Concepts of Modern Catalysis and Kinetics, Wiley-VCH, Weinheim, 2005 Search PubMed.
- A. Roldan, G. Novell, J. M. Ricart and F. Illas, J. Phys. Chem. C, 2010, 114, 5101–5106 CAS.
- P. Stoltze, Prog. Surf. Sci., 2000, 65, 65–150 CrossRef CAS.
- H. Eyring, J. Chem. Phys., 1935, 3, 107–115 CrossRef CAS.
- M. G. Evans and M. Polanyi, Trans. Faraday Soc., 1935, 31, 0875–0893 RSC.
- H. S. Bengaard, J. K. Nørskov, J. Sehested, B. S. Clausen, L. P. Nielsen, A. M. Molenbroek and J. R. Rostrup-Nielsen, J. Catal., 2002, 209, 365–384 CrossRef CAS.
- L. C. Grabow, B. Hvolbaek and J. K. Norskov, Top. Catal., 2010, 53, 298–310 CrossRef CAS.
- N. Hollingsworth, A. Roffey, H.-U. Islam, M. Mercy, A. Roldan, W. Bras, M. Wolthers, C. R. A. Catlow, G. Sankar, G. Hogarth and N. H. de Leeuw, Chem. Mater., 2014, 26, 6281–6292 CrossRef CAS.
- Y. Yang, C. A. Mims, R. S. Disselkamp, J. H. Kwak, C. H. F. Peden and C. T. Campbell, J. Phys. Chem. C, 2010, 114, 17205–17211 CAS.
- A. A. Peterson, F. Abild-Pedersen, F. Studt, J. Rossmeisl and J. K. Norskov, Energy Environ. Sci., 2010, 3, 1311–1315 CAS.
- L. Z. Gao and C. T. Au, J. Catal., 2000, 189, 1–15 CrossRef CAS.
- P. Ferrin and M. Mavrikakis, J. Am. Chem. Soc., 2009, 131, 14381–14389 CrossRef CAS PubMed.
- E. Vesselli, M. Rizzi, L. de Rogatis, X. L. Ding, A. Baraldi, G. Comelli, L. Savio, L. Vattuone, M. Rocca, P. Fornasiero, A. Baldereschi and M. Peressi, J. Phys. Chem. Lett., 2010, 1, 402–406 CrossRef CAS.
- J. Yoshihara and C. T. Campbell, J. Catal., 1996, 161, 776–782 CrossRef CAS.
Footnote |
| † Electronic supplementary information (ESI) available. See DOI: 10.1039/c5fd00186b |
| This journal is © The Royal Society of Chemistry 2016 |

