 Open Access Article
Creative Commons Attribution 3.0 Unported Licence
New IR imaging modalities for cancer detection and for intra-cell chemical mapping with a sub-diffraction mid-IR s-SNOM
H.
Amrania
a,
L.
Drummond
a,
R. C.
Coombes
b,
S.
Shousha
b,
L.
Woodley-Barker
b,
K.
Weir
a,
W.
Hart
a,
I.
Carter
a and
C. C.
Phillips
*a
aPhysics Dept., Imperial College, London, SW7 2AZ, UK. E-mail: Chris.phillips@imperial.ac.uk; Tel: +44 (0)207 594 7575
bDepartment of Cancer and Surgery, Faculty of Medicine, ICTEM, Room 145, Du Cane Road, London W12 0NN, UK
First published on 30th November 2015
Abstract
We present two new modalities for generating chemical maps. Both are mid-IR based and aimed at the biomedical community, but they differ substantially in their technological readiness. The first, so-called “Digistain”, is a technologically mature “locked down” way of acquiring diffraction-limited chemical images of human cancer biopsy tissue. Although it is less flexible than conventional methods of acquiring IR images, this is an intentional, and key, design feature. It allows it to be used, on a routine basis, by clinical personnel themselves. It is in the process of a full clinical evaluation and the philosophy behind the approach is discussed. The second modality is a very new, probe-based “s-SNOM”, which we are developing in conjunction with a new family of tunable “Quantum Cascade Laser” (QCL) diode lasers. Although in its infancy, this instrument can already deliver ultra-detailed chemical images whose spatial resolutions beat the normal diffraction limit by a factor of ∼1000. This is easily enough to generate chemical maps of the insides of single cells for the first time, and a range of new possible scientific applications are explored.
1. Introduction
The principles of vibrational spectroscopy, (VS), have been established over several decades, and, for much of this time, reliable off-the-shelf systems have been available that are capable of delivering high quality spectroscopic image (SI) datasets for use by the biomedical community. These datasets have potential utility over a wide range of biomedical disciplines that include histopathology, cytology, surgical targeting and drug discovery.1Very recently, technical advances in array detectors and in tuneable “Quantum Cascade laser” (QCL) narrow line sources have opened up new lines of experimentation, and most would agree that the mid-IR part (∼3 μm < λ < ∼10 μm) of the spectrum is experiencing, in technology terms, a renaissance. On the other hand, the reality is that take-up of these technologies by the biomedical scientists themselves, particularly clinicians, is still modest.
This paper starts by examining possible reasons for this, (with the aim of stimulating discussion), to set a context within which IR SI implementations may be evaluated for their genuine biomedical potential. It concludes by using this context to examine two new VS-based imaging technologies that we have developed. They are at roughly opposite ends of the labyrinthine “translational pathway” that, ideally, can take a technology from the physical science research lab into the clinic.
The first example, the so-called “Digistain” imager, is a very simple, stripped-down, SI system that is currently at the clinical validation stage. It arose when, rather than asking the usual scientists/technologists question, i.e. “How can I apply my new research technology in a new and hopefully useful way?” we tried inverting the argument and, instead, asked the question “Can we use our research expertise to develop a system that really could end up being used by clinicians?” Over the course of a 10 year multidisciplinary development programme, we found that this second question demands a far more considered and complex answer than the first. Hopefully we will show how well such a simple incarnation of SI technology can perform in a genuine sharp-edged clinical trial environment.
The second example is a new, probe-based, SI system that is very expensive and, at the moment, very difficult to use. It is formed by marrying an existing high-end commercial s-SNOM (scattering-type Scanning Near-field Optical Microscope) machine to an array of newly available QCL diode lasers. It can deliver SI datasets down to a ∼λ/1000 spatial resolution of ∼10 nm, i.e. sufficient to generate chemical maps inside a single cell for the first time. It came into being in a more traditional way, i.e. by asking the first of the two questions discussed above. Although we believe it has the potential to deliver game-changing imaging performance across the biosciences, it is at a very early stage, and at the moment we can only give a selection of demonstration images that hint at its potential in the biomedical arena.
1.1 Issues affecting the translation of VS technologies into the biomedical arena
There are several issues that came into prominence while we were trying to answer the “Can we use our research expertise, to develop a system that really could end up being used by clinicians?” question, and we choose to list them here. Some may seem obvious, but we generally underestimated their importance, and often we chose to ignore them until it became clear that to do so was no longer tenable. In retrospect, we believe that, if one is genuinely interested in seeing VS technology applied in a biomedical setting, much effort and resource can be saved if one is prepared instead to face these issues as early and as honestly as possible.Because this issue is so central, simplified and well-understood data acquisition and processing protocols become paramount. This is true even if, to technologists, they appear to be technically inferior to more sophisticated approaches. Only the former can be heuristically tested, and then tightly specified, and written into a so-called “Standard Operating Procedure”.
This “SOP” document is critical and it has to be able to “lock-down” the procedures in a way that limits variability to acceptable levels when the measurements are performed with different machines, in different labs, and by different people. A successful trial should not be thought of as validating a technology, but rather it validates a technology paired with a SOP. For VS-based technologies, one of the biggest problems comes with so-called “unsupervised” SI data processing methods, because variations, e.g. in image uniformity or signal-to-noise (SNR) ratio, can have completely unpredictable effects on the data components that the software settles on in the course of its data analysis.18
In clinical settings the degree of data reduction becomes especially extreme. Medical practitioners are already factoring in huge quantities of “soft” information when they, say, reach a diagnosis, or decide on a patient's treatment plan. As a consequence, any new technologies that hope to augment the clinical process will likely have to boil an extremely complex informational dataset down to a simple yes/no decision, or, at most, a number on a scale of 1 to 10. If this is not done, the data is unlikely to be of realistic use to a clinician.
The problem with SI technologies is the huge, (effectively infinite) parameter space. There are so many potential ways to reduce the SI data that a form of data paralysis can take hold. A chicken-and-egg problem can set in when it becomes clear that it will be impossible to explore all the possible ways of reducing the dataset to find the best one.
For clinical applications this problem is compounded by the fact that the details of the SOP have to be completely “locked down”, (and given adequate IP protection), before any clinical trials can be started. Even slight changes to the SOP will be deemed by the clinical profession to invalidate previously acquired trial data that were taken with the previous SOP. The result is that one has to “nail ones colours to the mast” as early as possible.
All these factors, coupled with the fact that resources are always limited in realistic development programmes, mean that the way forward is likely to involve a substantial degree of educated guesswork and/or some very pragmatic decision making. Ideally this will be guided by a knowledge of the physical/chemical/physiological mechanism that is underpinning the discriminating or diagnostic power of the SI dataset. Often though this understanding is either partial or completely absent. In this case, decisions can be just as usefully driven by technological considerations, such as the limitations of available IR sources and detectors.
Moreover, in most cases (e.g., conventional X-ray images, biopsy microscopy, CAT scans, ultrasonic images, MRI etc.), the image data is evaluated almost entirely by eye. The clinician does not, (and does not need to) understand e.g. the contrast mechanisms, or spectroscopic details that generated the image, in order to be able to exploit its clinical value. Even if the images are available in a reliably-calibrated digitized format (and usually they are not), it is unusual for any numerical data to be extracted from them for diagnostic purposes; perhaps the measurement of a physical dimension, or some single-digit index figure.
Taken together, these facts argue strongly for the VS community to concentrate on ways of presenting their spectroscopic information to clinicians in a simple, clear, visual way, probably sweeping all the technical details into the background.
The key point is that the “unmet need” exists entirely independently of the technology. It was probably there even before the technology was developed. It is defined by consensus of the potential users of a technology, and not by our community of technology developers.
If such an “unmet need” can be identified early on it can have a dramatic effect on the trajectory of a technology and save much wasted effort. This may seem so obvious as not to need saying, but the reality is that many, if not most, VS-based technology development programmes, target an “application” that was chosen, sometimes even invented, by the technology developer themselves. Usually this is done without sufficient (or, sometimes, any) discussion with potential end users.
2. The “Digistain” IR imager, for cancer detection and diagnosis
2.1 Background and the “unmet need”
At the moment, 99% of cancers are detected and characterised by excising a small “biopsy” tissue sample from the patient, drying it, slicing it thinly (∼μm), and staining it with two vegetable dyes that the histopathology community settled upon over 100 years ago. Haematoxylin stains the acidic parts of the specimen (i.e. the cell nuclei) blue, and eosin stains the cytoplasmic proteins pink. A trained histopathologist then “grades” this “H + E” specimen by eye, in a standard optical microscope. These “grades” often inform life-critical treatment decisions. Although the grading SOP protocols vary between different cancers, always the judgements are subjective, and often there is poor concordance between histopathology practitioners. Considered worldwide, this constitutes a very significant “unmet need”.2.2 The physical principles behind “Digistain”
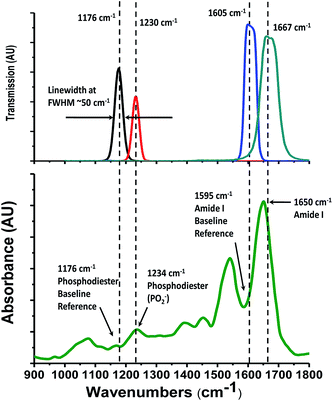
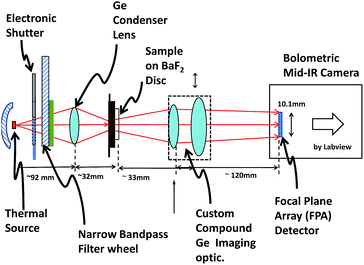
Our Digistain imager uses the physics of mid-IR absorption in the same excised and dried tissue slice as a quantitative way of mapping out the ratio of phosphate moieties, found predominantly in cell-DNA,2 to the proteins in the cell cytoplasm. The chemical concentrations are measured by taking a set of calibrated images in four mid-IR bands2 (Fig. 1). The resulting chemical map is converted into a computer generated false colour image3 and presented to the histopathologist in a way that allows it to be used to augment and inform the process of tissue grading.The idea seems simple, but in execution it presents significant technical challenges. Reproducibility requires that the effects of non-uniformity and non-linearity in the detector array, together with variations arising from non-uniform sample illumination, and fluctuating thermal background signals, all have to be identified and engineered out.4 Also the 4 images, which are taken at widely separated wavelengths, have to be accurately calibrated and registered for the ratioing process to work. Finally the optical throughput and image acquisition has to be refined to the point where adequate SNR images can be obtained with practical acquisition times of only a few minutes.
2.3 Factors affecting likelihood of successful clinical application
The choice of these two particular chemical moieties for Digistain was determined by a mix of the factors outlined in the previous section. In the first place, they give prominent features in the IR spectra that are within reach of a combination of comparatively basic (i.e. uncooled) mid-IR emitters and detectors. This added to their attractiveness as the features of the dataset most worthy of preserving in the face of the “Occam's razor” principle (Section 1.2.2).Secondly, these features provided an image that could be thought of as being an approximate analogue of the existing H + E one. The concentration of the phosphate moiety correlates with the acidic components in the tissue that turn out blue in the H + E images, and the amide moiety correlates with eosinophilic components of the tissue that stain pink. This way we aimed to reduce the SI image data to a form that was “pre-digested” into a format that was best suited for the histopathologists to assimilate and use, in line with the considerations of Section 1.2.3.
Thirdly, we only settled on this subset of the possible SI data after having already undergone a science-driven research programme consisting of several years of technologically complex laser based spectroscopy.5,6 Although this early study itself did little to establish a route to a viable clinical application, it had involved numerous consultations with histopathology professionals. These early consultations allowed us to identify and roughly target an important histopathology “unmet need” (Section 1.2.4), and steered the design principles behind the prototype imager of Fig. 2.
Fourthly, although there are of course many types of cancers it is well known that, in the majority of them, the cell reproduction cycle becomes significantly disrupted as healthy tissue becomes diseased. This is reflected in the fact that histopathologists frequently employ measures of both “pleomorphism” (changes in the relative size and shape of the cell nuclei) and “mitotic activity” (the rate of cell division) as key factors in their tissue grading SOPs. The “Digistain Index” (DI) that our imager measures is proportional to the ratio of concentrations of the phosphate to amide moieties, so we had grounds for hoping that a robust way could be found to correlate this data with tumour grade.7–9 In other words we were using an educated guess (Section 1.2.3) to prejudge the data reduction process that would generate the most useful images, before committing to large-scale clinical trials.
Fifthly, with Digistain we were focussed on an optical measurement, i.e. mid-IR absorption in a smooth-sided tissue slice, which we could reasonably hope to be able to make with good robustness and reproducibility (Section 1.2.1). By taking an appropriately scaled and background corrected ratio3 of the absorption of the moieties (Fig. 3) we could design a new SOP (3) that would be least sensitive to operator-dependent factors. The latter are mostly due to variations in the thickness of the tissue slice, but there is also the issue of fixing protocols, which can vary from site to site.
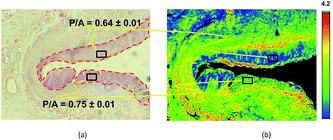 | ||
| Fig. 3 Example of the discriminating power of a Digistain image, in this case of an oesophageal biopsy. Left: Conventional “H + E” stained biopsy section. The regions delineated with red dotted lines are epithelial tissue, and the upper one is healthy (as judged by a trained histopathologist), whereas the lower right one is dysplastic. Right: Corresponding “Digistain” image, taken from an unstained slice of tissue directly adjacent, on the FFPE tissue block, to the one used for the H + E stain. It is a false-colour image constructed from the measured “phosphide-to-amide” ratio, P/A, extracted from the mid-IR images, as described in Fig. 1 and 2. The healthy tissue shows up blue, and the dysplastic tissue green. Averaging this “P/A ratio” (which we call the “Digistain Index”, DI), over the pixels in the two black rectangular areas gives numerical values for the two tissue types that differ at the >33σ level. | ||
Sixthly, the Digistain approach presents the mid-IR spectroscopic information visually, and in a way that can readily be compared with existing H + E slides (Section 1.2.3). There is an important point here; because the H + E slides are the clinician's so-called “gold standard” they will continue to be used in any event. No clinician would risk running against the grain of the profession by attempting to diagnose a condition as serious as cancer using only a revolutionary and untested technology. Often we are asked if Digistain can be adapted for in vivo use and the answer, in the short term at least, is no, at least not without a major engineering programme on broad spectrum mid-IR compliant imaging endoscopes. However, in some ways this can be seen as an advantage rather than a shortcoming. If we had, say, produced a machine that required an extra in vivo endoscopy procedure on top of the established standard biopsy one, it would probably have been much harder to test it (it would have needed separate live patient trials) in order to get it adopted.
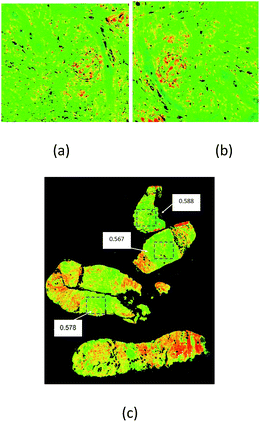
A critical factor in Digistain's favour is that after the H + E biopsies have been examined, the excised tissue samples are chemically preserved in wax (which can easily be dissolved away many years later), and archived, along with the original H + E slide, and a full medical history. There are millions of documented specimens of all types of cancer that one can go back to and study with Digistain. This means it can be tested and validated with logistical and ethical hurdles that are far lower than if one had to secure access to cohorts of new live patients to trial it with. Of course the issues of reliability and reproducibility are just as key here; they require longitudinal trials to establish the degree of chemical stability, specifically, as judged by our new imaging method, afforded by the FFPE method (Fig. 4).
At present we are nearing the end of a clinical trial, involving upwards of 200 breast cancer patients. They were assessed according to the RECIST criteria (a set regulated assessment criteria that all breast cancer diagnostic methods must follow), and the biopsies were fixed using the RCP (Royal College of Pathologists) fixing protocol. To carry weight with the medical profession, these trials have to be performed, by a large team, under strict conditions of anonymity, double-blindness and with suitably experienced and accredited statistical analysis staff. Unfortunately, for this reason, we are not allowed to discuss the results at all until they have been formally released, but we hope to be able to discuss this in more detail at the meeting.
3. A tuneable s-SNOM for intracellular chemical mapping
3.1 Introductory comments
Typical cells are 10s of μm across, and although ∼μm-level diffraction-limited resolution mid-IR imaging is possible (5) SNR limitations mean that it is only practical with sophisticated bench-scale laser sources. These are very challenging to implement, and they still fail to deliver enough resolution to “look inside” a single cell. In principle, Raman methods can deliver sub-micron resolution, but the inefficiency of the Raman signal generation process means that getting useful signals from beams that are focussed so tightly involves power densities that are likely to compromise biological material.The advent of a cell-level chemical analysis capability would have a wide ranging impact across the biosciences. At present, chemical analysis of changes to cell chemistry involve generating a sample of a large number of cells, (say by flow cytometry or cell breeding), breaking them up, and then analysing the mix with any one of a number of chemist's tools, including wet-chemistry assay, IR spectroscopy, mass spectroscopy or labelling methods. Of course, all these “looking at the bits” approaches destroy the cell morphology information, and they necessarily average over any cell-to-cell variation in either chemistry or morphology.
Real cell-level imaging would have a major impact across the biosciences. The cell-to-cell variations within a population could give crucial insights into e.g. how cancer starts, (often with a single rogue cell), and, generally speaking cell-level pathology could be radically transformed. In pharmacology, the question of “How does this drug act?” often boils down to “Where, and for how long, does this drug bind?” and being able to answer the latter, at a cell level, could have major implications for the drug discovery industry.
In this context, ultra-high-resolution imaging offers a unique “concentration advantage” feature. Fortunately, many pharmacologically active compounds have distinctive vibrational spectra, but most are active at mean concentrations in the 1 part in 109 region. Obviously this presents a major sensitivity challenge for VS-based technologies. If the drug binds at a particular site though, the local concentration can be dramatically elevated, and if the SI resolution is increased to the point where only a comparatively small number of molecules can be resolved, this effect can, in principle, lift the signal out of the noise.
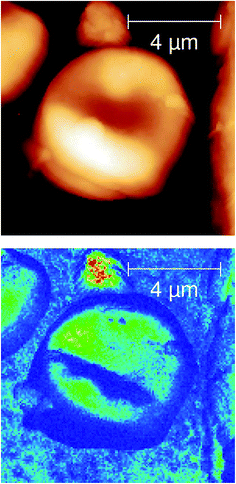
So-called s-SNOMs promise to deliver this information.10 They work by focussing mid-IR radiation onto the point where the probe tip of an atomic force microscope (AFM) touches a sample, and then analysing the degree to which the radiation is backscattered. The sharpness of the AFM tip concentrates the optical fields, via a “lightning rod” effect, into an area roughly commensurate with the AFM tip diameter. They offer spatial resolutions down to ∼10 nm even with λ ∼ 10 μm light, and they work with radiation densities and photon energies that are both low enough to be completely compatible with biological material.
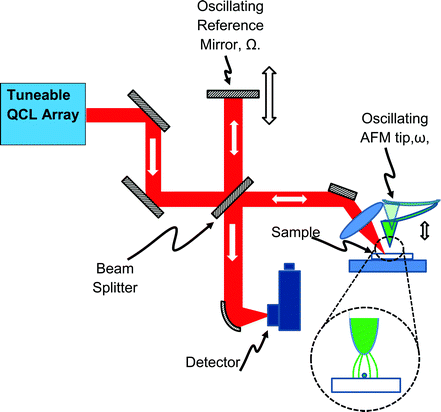
However, the backscattered signal is small, and it requires a sophisticated interferometric signal recovery scheme11 (Fig. 5) to pick it up. In turn this necessitates a coherent IR source. Usually this is a CO2 laser that can only be tuned over a spectral range that is too narrow for useful IR spectroscopy. Until recently the only broad-band alternative source was a complex lab-scale laser system that used non-linear frequency mixing technology,12 or an IR synchrotron,13 but now the situation is rapidly evolving with the advent of commercially available “Quantum Cascade Lasers” (QCLs).
However, each device typically tunes through 2 or 3 μm, so covering the normal mid-IR VS range is expensive because it needs 4 or 5 devices to be engineered into a single system. CW QCL operation is only available in parts of the spectrum, but they generate CW-equivalent powers in the mW range, with very narrow linewidths and close to diffraction-limited beam quality. The commercial QCL systems now offer turn-key operation, coupled to a convenient computer-controlled tuning system that makes them very easy to use.
Against this however, many of the QCL designs use external cavities for tuning the lasers, and these are extremely sensitive to small amounts of light being scattered back from the s-SNOM interferometer. This makes it difficult to get them to work stably enough to use with the s-SNOM. Also, the fact that some wavelengths are only available as pulse trains introduces technical complications to the signal chain15 (as well as for imaging applications more generally) and in practice, when the QCL system switches between different laser devices as it is tuned, the s-SNOM optics usually have to be manually re-aligned.
Depending on the application, the backscattered light is polarised before being detected. In “plasmonic” experiments s-polarised incident light is used, because it can excite plasmonic modes in metal nanostructures without being sensitive to chemically based contrast mechanisms that arise between the different material components (usually a metal and a dielectric) that are used to make the nanostructure. If the detection channel is then p-polarised, (the so-called “cross polarisation scheme”) it selects only the p-polarised field components that arise from the excitation of plasmons in the nano-photonic device, and is largely immune to chemical contrast effects.
One way to understand this is to notice that the incoming s-polarised light excites the resonant in-plane plasmon modes in the sample, without itself significantly interacting with the probe (which is a very poor antenna to anything but light polarised perpendicularly to the surface). For most biomedical experiments, it is the chemical contrast that is of interest, so both incoming and backscattered channels are p-polarised, as this is the polarisation that interacts with the tip and the sample most strongly (Fig. 5 inset). In all cases great care needs to be taken to avoid light backscattered from any of the optical components in the setup from reaching the QCL.
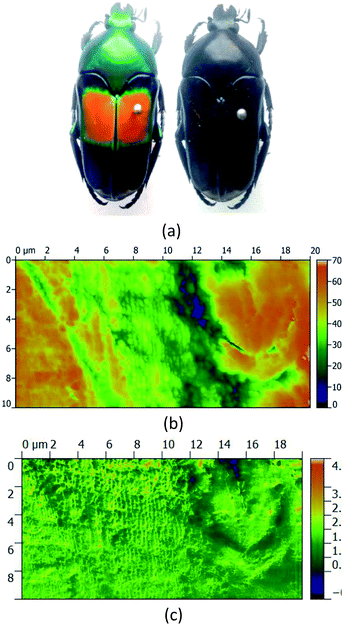
From the field of natural biophotonics, there are a number of iridescent beetle species that have evolved with periodic “photonic crystal” chiral shells, which give them distinctive markings that are visible only in circularly polarised light (Fig. 7). The question arises as to whether the chirality behind this is an accidental “self-organisation” effect arising from the natural chirality of the biomolecules that are forming the periodic structure in the shell, or whether the chirality has been generated by evolutionary forces. Fragments of the shell were polished to yield a smooth surfaced sample with minimal morphological contrast in the AFM image. The s-SNOM image however uses the chemical contrast to reveal the periodic structure of the chitin helices thought to be the origin of the effect.
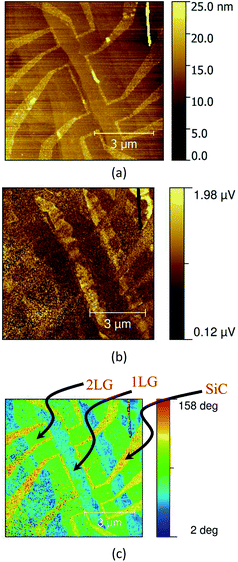
Fig. 8 images a field effect transistor (FET) device fabricated for a graphene sheet grown epitaxially on a SiC substrate.16,17 The AFM morphology image reveals the device structure. The s-SNOM phase image, in this example, approximately corresponds to the absorption in the graphene layer, and reveals regions of differing thickness, and the edge effects responsible for the device operation.
At the time of writing the QCL s-SNOM system is being reengineered to facilitate tuneable, full-spectrum spectroscopic imaging. The aim is to substantially increase the amount of scientific information that can be inferred from these images, and we hope to have new data to present at the meeting itself.
4. Conclusions
We have presented here two new ways of using mid-IR chemical imaging, and in both cases, as befits the topic of this discussion meeting, the focus has been on what they can offer the biomedical community. They are both at very different stages of technical readiness, and they face very different challenges in the future.For Digistain the technical hurdles have been overcome, the clinical potential has essentially already been proven; the challenge now is to validate it using criteria and methods that will engage the support and interest of the clinicians. This is already underway, but we are well aware that it will have to be achieved on a wide enough scale to convince investors to produce them as tools to put in the medics’ hands, because without that, the idea will come to nothing.
For the s-SNOM it is the beginning, and the challenges are still mostly technical. We believe it has a very bright future as a new scientific research tool for a wide range of biomedical problems, but, already, we are on the lookout for that elusive “unmet need”.
Acknowledgements
Financial support from the UK Engineering and Physical Science Research council (grant numbers EP/K503733/1, EP/G031819/1 and EP/K 029398/1) is gratefully acknowledged. The Graphene FET samples were kindly supplied by Olga Kazakova and Vishal Panchal. We thank The Imperial Biomedical Research Centre and The Imperial Experimental Cancer Medicine Centre for technical assistance.Notes and references
- Infrared and Raman Spectroscopic Imaging, ed. R. Salzer and H. W. Siesler, 2009, Wiley-VCH, Weinheim, ISBN 978-3-527-31993-0 Search PubMed.
- H. Amrania, G. Antonacci, C.-H. Chan, L. Drummond, W. R. Otto, Nicholas A. Wright and C. Phillips, Opt. Express, 2012, 20(7), 7290–7299 CrossRef CAS PubMed.
- C. C. Phillips and H. Amrania, Infrared Imaging of Biological Material, G B Patent, filed 29, April 2015, Application number PCT filed GB1507314.1 Search PubMed.
- L. Drummond, PhD thesis, Imperial College London, 2014.
- H. Amrania, A. McCrow and C. Phillips, Rev. Sci. Instrum., 2009, 80, 123702 CrossRef PubMed.
- H. Amrania, A. P. McCrow, M. R. Matthews, S. G. Kazarian, M. K. Kuimova and C. C. Phillips, Chem. Sci., 2011, 2(1), 107 RSC.
- L. M. Merlo, L. S. Wang, J. W. Pepper, P. S. Rabinovitch and C. C. Maley, Adv. Exp. Med. Biol., 2010, 676, 1–13 CrossRef CAS PubMed.
- C. N. Battlehner, P. H. Saldiva, C. R. Carvalho, T. Y. Takagaki, G. S. Montes, R. N. Younes and V. L. Capelozzi, Histopathology, 1993, 22(1), 31–34 CrossRef CAS PubMed.
- S. J. Jang, J. M. Gardner and J. Y. Ro, Adv. Anat. Pathol., 2011, 18(2), 165–172 CrossRef PubMed.
- F. Keilmann and R. Hillenbrand, Philos. Trans. R. Soc. London, Ser. A, 2004, 362, 787 CrossRef CAS PubMed.
- N. Ocelic, A. Huber and R. Hillenbrand, Appl. Phys. Lett., 2006, 89, 101124 CrossRef.
- F. Huth, A. Govyadinov, S. Amarie, W. Nuansing, F. Keilmann and R. Hillenbrand, Nano Lett., 2012, 12(8), 3973–3978 CrossRef CAS PubMed.
- H. A. Bechtel, E. A. Muller, R. L. Olmon, M. C. Martin and M. B. Raschkeb, Proc. Natl. Acad. Sci. U. S. A., 2014, 111(20), 7191–7196 CrossRef CAS PubMed.
- J. Faist, F. Capasso, D. L. Sivco, C. Sirtori, A. L. Hutchinson and A. Y. Cho, Science, 1994, 264, 553–556 CAS.
- E. Yoxall, M. Navarro-C, M. Rahmani, S. A. Maier and C. C. Phillips, Appl. Phys. Lett., 2013, 103, 213110 CrossRef.
- V. Panchal, R. Pearce, R. Yakimova, A. Tzalenchuk and O. Kazakova, Sci. Rep., 2013, 3, 2597 Search PubMed.
- V. Panchal, A. Lartsev, A. Manzin, R. Yakimova, A. Tzalenchuk and O. Kazakova, Sci. Rep., 2014, 4, 5881 CAS.
- K. Atkinson, Mid-IR Biological Imaging, MSc thesis, Imperial College London, 2006 Search PubMed.
| This journal is © The Royal Society of Chemistry 2016 |

