Emerging investigators series: frontier review: occurrence and speciation of chromium in drinking water distribution systems
Michelle
Chebeir
,
Gongde
Chen
and
Haizhou
Liu
*
Department of Chemical and Environmental Engineering, University of California at Riverside, Riverside, CA 92521, USA. E-mail: haizhou@engr.ucr.edu; Fax: +1 (951) 827 5696; Tel: +1 (951) 827 2076
First published on 13th September 2016
Abstract
Chromium can exist as both trivalent Cr(III) and hexavalent Cr(VI) in typical drinking water conditions, with Cr(VI) being of particular concern due to its high toxicity and new regulatory perspectives. This study critically reviewed the occurrence and speciation of chromium in drinking water distribution systems in the U.S., based on a detailed analysis of the up-to-date EPA Unregulated Contaminant Monitoring Rule (UCMR) database. Data show that the nationwide Cr(VI) levels in drinking water ranged from non-detectable to 97 μg L−1 at the entry point to drinking water distribution systems, and between non-detectable and 67 μg L−1 at the maximal residence time of distribution systems. Geographic distributions show that higher drinking water Cr(VI) concentrations were observed in Southwest U.S. and were closely associated with the dependence on groundwater as a drinking water source. While Cr(VI) and total chromium concentrations showed either an increase or a decrease between the entry point and the maximal residence time of drinking water distribution systems, they suggested complex physicochemical processes that can act as both sources and sinks of chromium in distribution systems, including the oxidation of Cr(III)-containing solids by residual disinfectants and the adsorption of Cr(VI) by corrosion scales. Time-dependent data analysis revealed that a considerable fraction of Cr(III) at the entry point to distribution systems was inadvertently converted to Cr(VI) by the time the drinking water reached the maximal residence time of distribution systems, and this conversion was positively correlated with the presence of residual disinfectants. Data analyses suggest that the reactivity of downstream water distribution should be managed to control chromium in tap water.
Water impactIn this study, we present an in-depth analysis of the most recent occurrence data on hexavalent chromium in U.S. drinking water distribution systems, both at the point of entry and the maximal residence time. In particular, we critically analyzed the database from US EPA's Third Round Unregulated Contaminant Monitoring Rule (UCMR3). By investigating the occurrence and speciation of chromium, we have linked together the mechanisms that affect hexavalent chromium transformations in drinking water distribution systems. This study is of interest to scientists, engineers and practitioners concerned with mechanisms that affect chromium release in drinking water and its control. |
1. Introduction
Hexavalent chromium Cr(VI) is an emerging contaminant due to its toxicity and new drinking water regulatory standards.1–3 While chromium can exist in six oxidation states (from 0 to VI), trivalent Cr(III) and hexavalent Cr(VI) are the stable forms in aquatic environments.4,5 Exposures to Cr(VI) through respiratory, oral, and dermal pathways are associated with lung and gastrointestinal cancers as well as skin ulcerations,2,6–9 while Cr(III) is considered a micro-nutrient and aids in the metabolism of glucose and lipids.10,11 Anthropogenic release of Cr(VI) comes from chemical industries and products, including paints, pigments, paper, electroplating and leather tanning.12,13 In addition, chromium is naturally occurring in aquifer minerals and exists as the 21st most abundant element in the earth's crust.14,15 Weathering of Cr(III)-containing minerals leads to naturally-occurring Cr(VI) in groundwater.16–18In drinking water conditions, Cr(VI) exists as the oxyanion CrO42−, whereas Cr(III) has a very low solubility and can exist as various Cr(III) solids.19–21 California has recently set a new drinking water Cr(VI) standard of 10 μg L−1.3 The U.S. EPA has not yet decided whether or not to regulate Cr(VI).22 In addition, California also has a stricter regulation for total chromium than the U.S. EPA, i.e., 50 μg L−1vs. 100 μg L−1.22 A better understanding of the nationwide chromium occurrence and speciation in drinking water will help water utilities to prepare and develop effective control strategies in the future.
The existing regulatory framework mainly addresses chromium occurrence at the point of treatment prior to entering water distribution systems. However, drinking water resides in distribution systems much longer than in treatment facilities (i.e., days vs. hours), and there are many reactive components in distribution systems, including pipeline materials and residual disinfectants. For example, chromium has been widely used in pipe materials (e.g., cast iron and stainless steel) and may leach into drinking water due to corrosion processes.23–32 In addition, as pipes corrode, iron oxide corrosion products adsorb Cr(VI) that is even present at trace levels in treated drinking water.30–36 Thermodynamic considerations suggest that adsorbed Cr(VI) can be reduced to Cr(III) by green rusts and other reducing agents in corrosion products and consequently exists as different Cr(III) minerals in drinking water distribution systems.26,27,37–44 Cr(VI) can accumulate to extremely high levels in the corroded solids over decades. Recent nationwide surveys show that chromium accumulates extensively, reaching concentrations as high as 0.5% in the corrosion scales.33,45–47 These levels far exceed its natural abundance in aquifer sediments, turning corrosion scales in water distribution systems into potential in situ sources of chromium.
There are several reaction pathways from source water to the tap that can impact the occurrence and speciation of Cr species in drinking water (Fig. 1). Cr(VI) concentrations in tap water can vary depending on the type of residual disinfectants and the residence time in the water distribution systems – from the entry point (EP) to the distribution system (i.e., effluents from drinking water treatment plants) to the maximum residence time (MRT) in the distribution system (i.e., exit point at the tap). Recent studies show that Cr(III) can be oxidized by residual disinfectants.48–53 Currently, there is little knowledge on the chemical stability of accumulated chromium in water distribution systems.
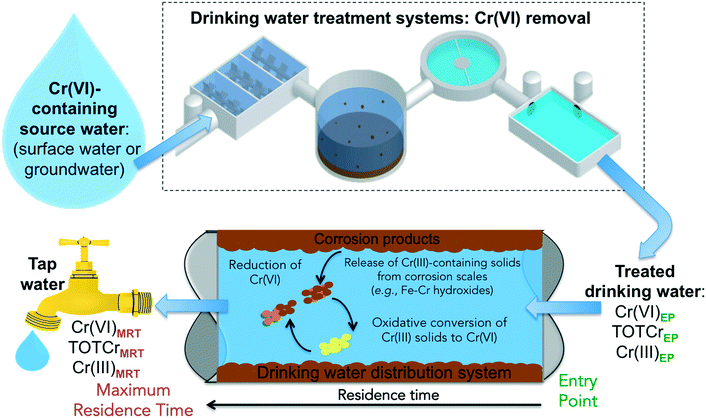 | ||
| Fig. 1 A schematic illustration of pathways that can impact the occurrence and speciation of chromium in drinking water. | ||
Considering the emerging concerns with Cr(VI) on its toxicity and regulatory perspectives, the objective of this frontier review was to critically analyze the state of Cr(VI) in U.S. drinking water and distribution systems, based on the up-to-date US EPA monitoring database, with special focuses on the geographic distributions of Cr(VI) in drinking water and changes of Cr speciation in water distribution systems.
2. Methods and database
To analyze the state of chromium in drinking water of public water systems, field sampling data from the up-to-date US EPA's third round of Unregulated Contaminants Monitoring Rule (UCMR3) monitoring program were individually compiled and analyzed. A total of 38![[thin space (1/6-em)]](https://www.rsc.org/images/entities/char_2009.gif) 000 samples from 3613 public water systems nationwide were reported based on nationwide UCMR3 monitoring activities from 2013 to 2014.22 Detailed data mining was conducted on the basis of the sample geographic region, drinking water source, size of the water utilities, types of residual disinfectants and sampling location within the distribution system. For each sample in the database, total Cr (TOTCr) was measured with EPA method 200.8 with a minimal reporting level of 0.2 μg L−1, Cr(VI) was measured with EPA method 218.7 with a minimal reporting level of 0.03 μg L−1, and Cr(III) was calculated as the difference between TOTCr and Cr(VI).
000 samples from 3613 public water systems nationwide were reported based on nationwide UCMR3 monitoring activities from 2013 to 2014.22 Detailed data mining was conducted on the basis of the sample geographic region, drinking water source, size of the water utilities, types of residual disinfectants and sampling location within the distribution system. For each sample in the database, total Cr (TOTCr) was measured with EPA method 200.8 with a minimal reporting level of 0.2 μg L−1, Cr(VI) was measured with EPA method 218.7 with a minimal reporting level of 0.03 μg L−1, and Cr(III) was calculated as the difference between TOTCr and Cr(VI).
Statistical analysis conducted in this review study was based on the total number of samples and the number of water utilities, respectively. This eliminated potential bias from geographic regions with more samples or more participating water utilities. In particular, the sample-number-based analysis counted each sample in the database as one independent event, regardless of the sample location and time. In comparison, the water-utility-based analysis only counted the fact that Cr levels fell into a particular range. For example, if a water utility reports 20 samples with Cr ranging between 1 and 5 μg L−1 and 10 samples between 5 and 10 μg L−1, all 30 samples will be counted for sample-number-based analysis; however, this utility would only be counted once each for the category of a Cr level at 1–5 and 5–10 μg L−1, respectively. With respect to the analysis of sampling locations within distribution systems, reported data from the same systems (matched by sample and utility codes in the database) were compared to examine the changes of Cr concentration and speciation between the EP and MRT of distribution systems. In the conducted statistical analysis, values below the detection limit of 0.03 μg L−1, non-detectable samples, were assumed to have a concentration of 0 μg L−1. In addition, the impact of residual disinfectants on the fate of Cr in distribution systems was investigated by correlating the type of disinfectants with changes of Cr speciation.
3. Results and discussion
3.1 Cr(VI) occurrence in drinking water
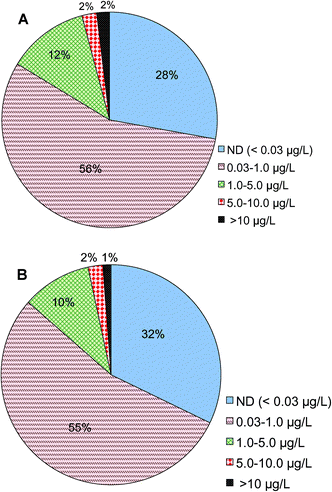
Analysis shows that Cr(VI) is detected in treated drinking water prior to entering drinking water distribution systems nationwide. Of a total of 22![[thin space (1/6-em)]](https://www.rsc.org/images/entities/char_2009.gif) 724 samples reported in this category, 2% of them had Cr(VI) concentrations higher than 10 μg L−1, 14% of the samples were between 1 and 10 μg L−1, 56% were between 0.03 and 1 μg L−1 and 28% were below 0.03 μg L−1, i.e., the minimal reporting limit (Fig. 2A). These results are consistent with a prior observation on the basis of a smaller number of samples nationwide that a large fraction of samples had Cr(VI) concentrations less than 1 μg L−1.54 The monitoring data examined in this study came from 3613 public water systems, of which 3113 are large systems that serve more than 10
724 samples reported in this category, 2% of them had Cr(VI) concentrations higher than 10 μg L−1, 14% of the samples were between 1 and 10 μg L−1, 56% were between 0.03 and 1 μg L−1 and 28% were below 0.03 μg L−1, i.e., the minimal reporting limit (Fig. 2A). These results are consistent with a prior observation on the basis of a smaller number of samples nationwide that a large fraction of samples had Cr(VI) concentrations less than 1 μg L−1.54 The monitoring data examined in this study came from 3613 public water systems, of which 3113 are large systems that serve more than 10![[thin space (1/6-em)]](https://www.rsc.org/images/entities/char_2009.gif) 000 people. On the basis of the numbers of water utilities, 1% of participating utilities reported Cr(VI) levels greater than 10 μg L−1, 12% of utilities were between 1 and 10 μg L−1, 55% were between 0.03 and 1 μg L−1 and 32% were below 0.03 μg L−1 (Fig. 2B).
000 people. On the basis of the numbers of water utilities, 1% of participating utilities reported Cr(VI) levels greater than 10 μg L−1, 12% of utilities were between 1 and 10 μg L−1, 55% were between 0.03 and 1 μg L−1 and 32% were below 0.03 μg L−1 (Fig. 2B).
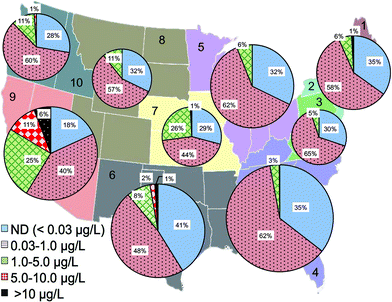
The statistical distribution of Cr(VI) levels in treated drinking water before entering distribution systems was further analyzed based on the reporting water utilities in each US EPA region (Fig. 3). EPA regions 4, 5, 6 and 9 had the largest number of monitoring water systems in the database due to large populations in these regions. Among all regions, EPA regions 6 and 9 have the highest percentage of water utilities with Cr(VI) levels greater than 10 μg L−1 (1.6% and 6.1%, respectively) and Cr(VI) levels between 1 and 10 μg L−1, i.e., 10% and 19%, respectively (Fig. 3). Region 9 was also previously observed as the region with the greatest levels of Cr(VI).54 Region 6 covers the states of Texas, Oklahoma, New Mexico, Louisiana, and Arkansas. Region 9 includes the western states of California, Nevada and Arizona.
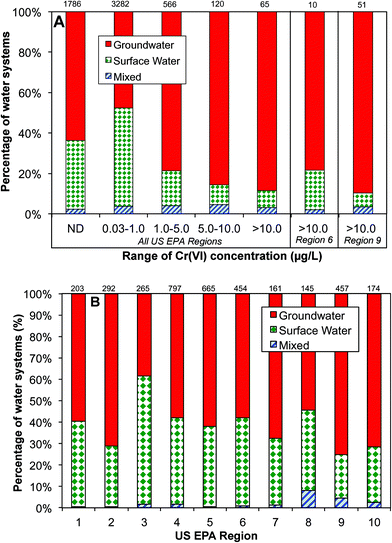
Data analysis shows that the occurrence of Cr(VI) in drinking water prior to distribution system entrances was highly associated with the dependence on groundwater as the drinking water source (Fig. 4A). For example, of all water systems with Cr(VI) levels higher than 10 μg L−1, nearly 90% of them depended on groundwater as the primary drinking water source, whereas for water systems with low Cr(VI) levels between 0.03 and 1 μg L−1, only 48% of them primarily used groundwater. In EPA regions 6 and 9, groundwater is the major water source for systems with Cr(VI) concentrations greater than 10 μg L−1 (Fig. 4A). Previous observations also found that that higher concentrations of Cr(VI) were more likely found in groundwater than in surface water.54
This positive correlation between the occurrence of Cr(VI) in drinking water and its dependence on groundwater source is consistent with the available geochemistry literature on the contribution from naturally-occurring Cr(VI) in aquatic environments. Cr(III)-containing aquifers are widely present in the arid alluvial basins in the Southwestern U.S. that is largely covered by these two EPA regions.18,55–58 For example, elevated Cr(VI) levels up to 300 mg L−1 are observed in California, resulting from the oxidation of Cr(III)-containing minerals by MnO2 in serpentine soils on geological time scales.15–17,56,59–61 With the exception of EPA region 3, more than 50% of participating public water systems in all EPA regions depend on groundwater as the source water, and region 9 has the highest percentage at 75% (Fig. 4B).
Meanwhile, conventional water treatment processes (e.g., coagulation and sand filtration) are not effective in reducing high Cr(VI) levels in source water to a non-detectable level. Although new treatment technologies are proposed (e.g., ion exchange and other reductive approaches), implementation will take years to come. Therefore, the contribution of Cr(VI) from geological weathering of aquifer minerals has a major contribution to its occurrence in treated drinking water, i.e., at the entry point to water distribution systems.
3.2 Cr(VI) occurrence at the maximal residence time of water distribution systems
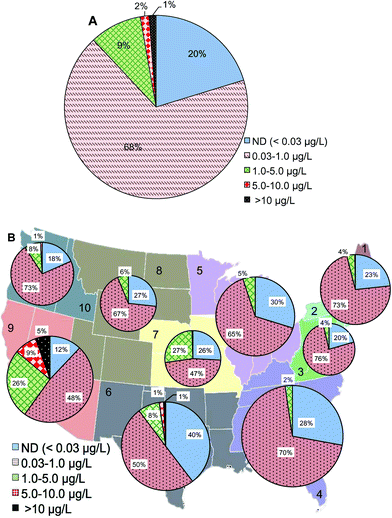
At the maximal residence time of water distribution systems (15![[thin space (1/6-em)]](https://www.rsc.org/images/entities/char_2009.gif) 886 samples from the database), 1% of samples had Cr(VI) concentrations higher than 10 μg L−1, 11% of the samples were between 1 and 10 μg L−1, 68% of samples had Cr(VI) concentrations between 0.03 and 1 μg L−1, and 20% were below 0.03 μg L−1 (Fig. 5A). Compared to Cr(VI) distribution at the entry point of distribution systems (Fig. 2A), the major change was a 12% increase of samples with Cr(VI) concentration ranging between 0.03 and 1 μg L−1 at the maximal residence time which was accompanied by a 1%, 3% and 8% decrease in the >10 μg L−1, 1–5 μg L−1, and ND ranges, respectively. Geographic distributions on the basis of the number of water systems showed that EPA regions 6 and 9 had the highest percentage of water systems with Cr(VI) concentrations higher than 10 μg L−1 at the maximal residence time of distribution systems (Fig. 5B). Compared to Cr(VI) concentrations at the entry point to the distribution systems, region 9 showed an 8% increase of Cr(VI) in the range of 0.03 to 1 μg L−1 at the maximal residence time of distribution system and a 2% decrease in the 5–10 μg L−1 range. Northeast (combined regions 1 and 2) and Northwest (region 10) showed a 15% and 13% increase of Cr(VI) in the range of 0.03 to 1 μg L−1 at the maximal residence time of distribution systems, respectively.
886 samples from the database), 1% of samples had Cr(VI) concentrations higher than 10 μg L−1, 11% of the samples were between 1 and 10 μg L−1, 68% of samples had Cr(VI) concentrations between 0.03 and 1 μg L−1, and 20% were below 0.03 μg L−1 (Fig. 5A). Compared to Cr(VI) distribution at the entry point of distribution systems (Fig. 2A), the major change was a 12% increase of samples with Cr(VI) concentration ranging between 0.03 and 1 μg L−1 at the maximal residence time which was accompanied by a 1%, 3% and 8% decrease in the >10 μg L−1, 1–5 μg L−1, and ND ranges, respectively. Geographic distributions on the basis of the number of water systems showed that EPA regions 6 and 9 had the highest percentage of water systems with Cr(VI) concentrations higher than 10 μg L−1 at the maximal residence time of distribution systems (Fig. 5B). Compared to Cr(VI) concentrations at the entry point to the distribution systems, region 9 showed an 8% increase of Cr(VI) in the range of 0.03 to 1 μg L−1 at the maximal residence time of distribution system and a 2% decrease in the 5–10 μg L−1 range. Northeast (combined regions 1 and 2) and Northwest (region 10) showed a 15% and 13% increase of Cr(VI) in the range of 0.03 to 1 μg L−1 at the maximal residence time of distribution systems, respectively.
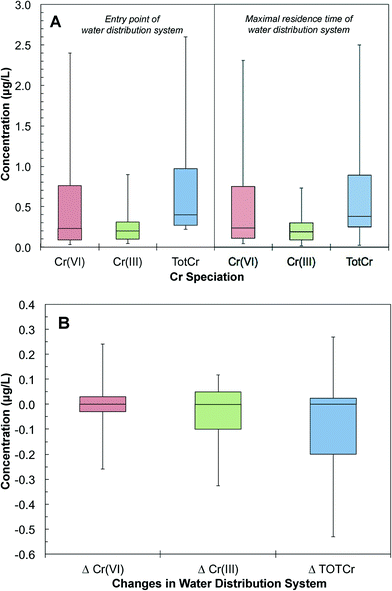
The database was further grouped to pair Cr(VI) measurements at the entry and maximal residence time of the same water distribution systems. These pairs of samples provided snapshots of the changes of Cr speciation and concentration in distribution systems. A total of 4517 pairs of measurements were obtained from 2174 distribution systems. The 25th, 50th and 90th percentile distributions of Cr(VI) concentrations at the entry point of distribution systems were 0.09, 0.76 and 2.40 μg L−1, respectively. The 25th, 50th and 90th percentile distributions of Cr(VI) concentrations at the maximal residence time were 0.11, 0.24 and 2.30 μg L−1, respectively (Fig. 6A). There were also trace levels of Cr(III) at the entry point of the distribution system. The 25th, 50th and 90th percentile distributions of Cr(III) concentrations at the entry point of distribution systems were 0.25, 0.38 and 2.50 μg L−1, respectively (Fig. 6A). Of all distribution systems, 41% showed an increase of Cr(VI) concentration from the entry to the maximal residence time. Based on the 75th and 90th percentile sample distributions, the Cr(VI) concentration increased by 0.04 and 0.21 μg L−1 in distribution systems, respectively (Fig. 6B). Our analysis also showed that 1% of the samples that had increases in Cr(VI) concentration resulted in a Cr(VI) concentration exceeding 10 μg L−1 at the tap water with the maximal residence time in a distribution system.
3.3 Changes of total chromium in water distribution systems
Total chromium (TOTCr) represents both Cr(III) and Cr(VI) species. There are a total of 6577 pairs of samples in the UCMR database that were taken concurrently at the entry and maximal residence time of the same water distribution systems. The 25th, 50th and 90th percentile distributions of TOTCr concentrations at the entry point were 0.27, 0.40 and 2.60 μg L−1. The corresponding concentrations at the maximal residence time were 0.25, 0.38 and 2.50 μg L−1, respectively (Fig. 6A). Overall, TOTCr concentrations between the entry point and maximal residence time can either increase or decrease (Fig. 6B). Increases in TOTCr are likely derived from accumulated Cr leaching from the corrosion scales in distribution systems.27–29 Drinking water chemical conditions affect these release processes. Previous studies have shown that changes in pH and chloride levels can promote corrosion and the release of Cr–Fe complexes from scales.62–65 Decreases of TOTCr can result from the adsorption of Cr(VI) onto iron oxides in corrosion scales such as magnetite, goethite and hematite. Sorption may then be followed by the potential reduction of Cr(VI) to Cr(III) and sequestration of Cr(III) in the distribution system.66,673.4 Changes of Cr speciation in water distribution systems
The database had samples with both TOTCr and Cr(VI) concentrations measured concurrently at the entry and maximal residence time of 4517 water distribution systems. The difference between TOTCr and Cr(VI) concentration represents Cr(III) concentration. The 25th, 50th and 90th percentile distributions of Cr(III) at the entry point were 0.10, 0.20 and 0.90 μg L−1, respectively (Fig. 6A). The presence of Cr(III) at the entry point can come from different sources. For example, highly soluble Cr(VI) can be reductively transformed to particulate Cr(III) before removal in a water treatment plant.68–72 Thus, trace levels of residual Cr(III) can exist.68 Additional Cr(III) can also be introduced with impurities of iron-based coagulants during treatment.72 These can result in a carry-over of residual Cr(III) to the subsequent water distribution system.Once in the distribution system, Cr(III) levels showed either a decrease or an increase from the entry point to the maximal residence time. For example, the 10th and 90th percentiles of samples showed a decrease of 0.33 and an increase of 0.12 μg L−1, respectively (Fig. 6B). A decrease in Cr(III) can result from the oxidation of Cr(III) to Cr(VI). Cr(III) can also adsorb onto iron oxides such as hematite in corrosion scales.73 An increase in Cr(III) can be attributed to the release of Cr-containing particles from corrosion scales in the distribution system.
To further assess the contribution of Cr(III) oxidation to the increase of Cr(VI) concentrations in water distribution systems, the percentage of Cr(III) at the entry point that can be transformed to Cr(VI) in the distribution system was calculated based on the monitoring data. By comparing the change of Cr(VI) concentration in a distribution system with respect to Cr(III) at the entry point, the fraction of Cr(III) that is oxidized to Cr(VI) in a distribution system is calculated using eqn (1):
 | (1) |
[Cr(VI)]EP and [Cr(VI)]MRT are Cr(VI) concentrations at the entry point and the maximal residence time of a distribution system, respectively. [TOTCr]EP is the concentration of total Cr at the entry point. The denominator of eqn (1) represents Cr(III) concentration at the entry point. In some distribution systems the concentration of TOTCr was less than that of Cr(VI) at the entry point, which was likely caused by differences in sensitivities of analytical methods between TOTCr and Cr(VI). These samples were not included in the calculation.
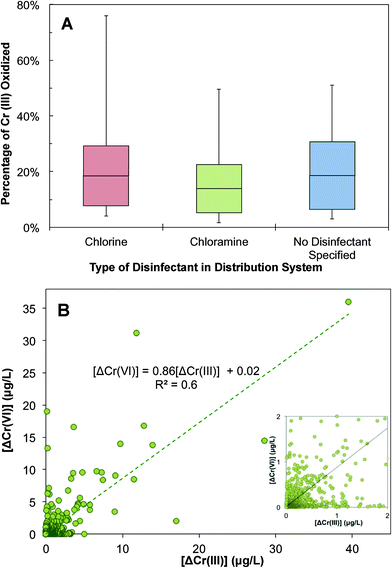
This calculation shows that a considerable fraction of Cr(III) can be oxidized in a distribution system and contributes to changes in Cr speciation and an inadvertent transformation to Cr(VI) (Fig. 7A). Interestingly, the fraction of oxidizable Cr(III) varies with the type of residual disinfectant. Of the disinfectants monitored in the UCMR3 data, the two most commonly used residual disinfectants are free chlorine and chloramine. There is a high likelihood of an increase in Cr(VI) concentration in water distribution systems when free chlorine is used as a residual disinfectant (Fig. 7A). The 50th and 90th percentile oxidizable Cr(III) fractions were approximately 20% and 67%, respectively. A lower likelihood of Cr(VI) increase exists if chloramine is used as the residual disinfectant. With chloramine as the residual disinfectant, 58% of Cr(VI) samples showed an increase in Cr(VI) concentration. The 50th and 90th percentile oxidizable Cr(III) fractions were approximately 12% and 54%, respectively. There was a 15% increase in the maximal oxidizable Cr(III) fraction between chlorine and chloramine (Fig. 7A). This is consistent with the fact that chlorine is a stronger oxidant than chloramine.74 It is important to note that this data analysis was limited by a small number of samples and distribution systems with an identified disinfectant in the UCMR3 database. However, previous observations also showed a positive correlation between the increase of Cr(VI) and TOTCr concentration with the presence of chlorine as the residual disinfectant.48,54 In samples with no disinfectant specified (most likely predominated by the chlorine system), the fraction of oxidizable Cr(III) is very similar to that in the chlorinated system.
The increase in Cr(VI) and decrease in Cr(III) were further analyzed to identify the mechanism of Cr(III) changes in a distribution system (Fig. 7B). There is a positive correlation between the decrease of Cr(III) (i.e., ΔCr(III)EP–MRT) and the increase of Cr(VI) (i.e., ΔCr(VI)MRT–EP) with a R2 value of 0.6. The slope of the correlation is less than 1, suggesting that decreases in Cr(III) were not fully accounted for by increases in Cr(VI). This indicates that while the oxidation of Cr(III) to Cr(VI) can cause decreases in Cr(III), it is not the only mechanism that contributes to Cr(III) decreases in this complex system. Additional decreases in Cr(III) can potentially result from its deposition and sequestration to corrosion scales. In these scenarios, this would result in an overall decrease in TOTCr.
As the water enters the distribution system, the complex physiochemical reactions result in the conversion of Cr(III) to Cr(VI), which eventually leads to an elevated level of Cr(VI) when the drinking water leaves the distribution system with the maximum residence time, i.e., at the tap. This data analysis suggests that water distribution systems can be dynamic reactors that act as potential sources for Cr(VI) release and reoccurrence, most likely via the oxidation of Cr(III) to Cr(VI) by chlorine.
Conclusions
The analysis of the US EPA's UCMR3 database showed that Cr(VI) was detected in treated drinking water across U.S. at varying levels. EPA regions 6 and 9 have the highest percentage of water systems that exhibit Cr(VI) levels greater than 10 μg L−1 (1.6% and 6.1%, respectively), which is strongly associated with groundwater as the drinking water source and indicates the importance of naturally-occurring Cr(VI) from geological weathering. Based on the sampling data in water distribution systems, there is 41% chance that the Cr(VI) concentration increased from the entry to the maximum residence time. This increase of Cr(VI) can be contributed considerably by the oxidation of Cr(III) residuals in water distribution systems, and the fraction of oxidizable Cr(III) increased in the presence of chlorine in comparison with chloramine. Total chromium levels also exhibited changes in water distribution systems, most likely contributed by the release of Cr(III)-containing particles due to corrosion and adsorption of Cr(VI) by corrosion scales.Acknowledgements
This work was supported by grants to H. L. from National Science Foundation (CBET-1619915) and the University of California-Riverside Faculty Initial Complement Research Fund, and to M. C. from the National Science Foundation Graduate Research Fellowship and IGERT Water Sense Fellowship.References
- M. D. Cohen, B. Kargacin, C. B. Klein and M. Costa, Comparison of the cytotoxicity, cellular uptake, and DNA-protein crosslinks induced by potassium chromate in lymphoblast cell lines derived from three different individuals, Crit. Rev. Toxicol., 1993, 23(3), 255–281 CrossRef CAS PubMed.
- K. Salnikow and A. Zhitkovich, Genetic and epigenetic mechanisms in metal carcinogenesis and cocarcinogenesis: nickel, arsenic, and chromium, Chem. Res. Toxicol., 2008, 21(1), 28–44 CrossRef PubMed.
- California Environmental Protection Agency; State Water Resources Board. Hexavalent Chromium in Drinking Water, http://www.waterboards.ca.gov/drinking_water/certlic/drinkingwater/Chromium6.shtml (Accessed on 1/10/2016).
- F. C. Richard and A. C. M. Bourg, Aqueous geochemistry of chromium: a review, Water Res., 1991, 25(7), 807–816 CrossRef CAS.
- C. D. Palmer and P. R. Wittbrodt, Processes affecting the remediation of chromium-contaminated sites, Environ. Health Perspect., 1991, 92, 25–40 CrossRef CAS PubMed.
- R. Welling, J. Beaumont, S. J. Petersen and G. V. Alexeff, Chromium VI and stomach cancer: a meta-analysis of the current epidemiological evidence, Occup. Environ. Med., 2014, 72(2), 151–159 CrossRef PubMed.
- E. Rudolf, M. Cervinka, J. Cerman and L. Schroterova, Hexavalent chromium disrupts the actin cytoskeleton and induces mitochondria-dependent apoptosis in human dermal fibroblasts, Toxicol. In Vitro, 2005, 19(6), 713–723 CrossRef CAS PubMed.
- A. D. Dayan and A. J. Paine, Mechanisms of chromium toxicity, carcinogenicity and allergenicity: Review of the literature from 1985 to 2000, Hum. Exp. Toxicol., 2001, 20, 439–451 CAS.
- X. F. Wang, M. L. Xing, Y. Shen, X. Zhu and L. H. Xu, Oral administration of Cr(VI) induced oxidative stress, DNA damage and apoptotic cell death in mice, Toxicology, 2006, 228, 16–23 CrossRef CAS PubMed.
- S. Zafra-Stone, M. Bagchi, H. G. Preuss and D. Bagchi, The Nutritional Biochemistry of Chromium: Chapter 9 – Benefits of chromium(III) complexes in animal and human health, Elsevier B.V, Oxford, U.K., 2007 Search PubMed.
- J. O. Nriagu and E. Nieboer, Chromium in the Natural and Human Environments, John Wiley & Sons, New York, 1988 Search PubMed.
- M. A. Barakat, New trends in removing heavy metals from industrial wastewater, Arabian J. Chem., 2011, 24, 361–377 CrossRef.
- J. Jacobs and S. M. Testa, Cr(VI) Handbook, CRC Press, Boca Raton, FL, 2005 Search PubMed.
- J. Barnhart, Chromium chemistry and implications for environmental fate and toxicity, J. Soil Contam., 1997, 6(6), 561–568 CrossRef CAS.
- C. Oze, S. Fendorf, D. K. Bird and R. G. Coleman, Chromium geochemistry in serpentinized ultramafic rocks and serpentine soils from the Franciscan complex of California, Am. J. Sci., 2004, 304(1), 67–101 CrossRef CAS.
- J. G. Kim, J. B. Dixon, C. C. Chusei and Y. Deng, Oxidation of chromium(III) to (VI) by manganese oxides, Soil Sci. Soc. Am. J., 2002, 66(1), 306–315 CrossRef CAS.
- E. L. Eary and D. Rai, Kinetics of chromium(III) oxidation to chromium(VI) by reaction with manganese dioxide, Environ. Sci. Technol., 1987, 21, 1187–1193 CrossRef.
- A. R. Gonzalez, K. Ndung'u and A. R. Flegal, Natural occurrence of hexavalent chromium in the Aromas Red Sands Aquifer, California, Environ. Sci. Technol., 2005, 39(15), 5505–5511 CrossRef CAS PubMed.
- A. G. B. Williams and M. Scherer, Kinetics of Cr(VI) reduction by carbonate green rust, Environ. Sci. Technol., 2001, 35(17), 3488–3494 CrossRef CAS PubMed.
- N. Papassiopi, K. Vaxevanidou, C. Christou, E. Karagianni and G. S. E. Antipas, Synthesis, characterization and stability of Cr(III) and Fe(III) hydroxides, J. Hazard. Mater., 2014, 264, 490–497 CrossRef CAS PubMed.
- N. Papassiopi, Z. Gaitanarou and A. Xenidis, Stabilization of chromium in the form of mixed Fe(III)–Cr(III) hydroxides, Fresenius Environ. Bull., 2012, 21(8), 2399–2405 CAS.
- United States Environmental Protection Agency. Unregulated Contaminant Monitoring Rule 3 (UCMR 3), http://water.epa.gov/lawsregs/rulesregs/sdwa/ucmr/ucmr3/index.cfm (Accessed on 8/10/2015).
- K. Chittaladakorn, Cr(VI) generation and stability in drinking water, M.S. Thesis, Virginia Polytechnic Institute and State University, Blacksburg, VA, 2013 Search PubMed.
- K. Chittaladakorn, M. Edwards and L. McNeill, Hexavalent chromium [Cr(VI)] is leached to potable water from stainless steel components, Proceedings of American Water Works Association Annual Conference and Exposition, Denver, CO, 2013 Search PubMed.
- S. Gonzalez, R. Lopez-Roldan and J. L. Cortina, Presence of metals in drinking water distribution networks due to pipe material leaching: a review, Toxicol. Environ. Chem., 2013, 95(6), 870–889 CrossRef CAS.
- S. L. Percival, J. S. Knapp, R. G. J. Edyvean and D. S. Wales, Biofilms, mains water and stainless steel, Water Res., 1998, 32(7), 2187–2201 CrossRef CAS.
- Y. S. Choi, J. J. Shim and J. G. Kim, Effects of Cr, Cu, Ni and Ca on the corrosion behavior of low carbon steel in synthetic tap water, J. Alloys Compd., 2005, 391(1–2), 162–169 CrossRef CAS.
- C. Y. Peng, G. V. Korshin, R. L. Valentine, A. S. Hill, M. J. Friedman and S. H. Reiber, Characterization of elemental and structural composition of corrosion scales and deposits formed in drinking water distribution systems, Water Res., 2010, 44, 4570–4580 CrossRef CAS PubMed.
- C. Y. Peng and G. V. Korshin, Speciation of trace inorganic contaminants in corrosion scales and deposits formed in drinking water distribution systems, Water Res., 2011, 45, 5553–5563 CrossRef CAS PubMed.
- C. Y. Peng, J. F. Ferguson and G. V. Korshin, Effects of chloride, sulfate and natural organic matter (NOM) on the accumulation and release of trace-level inorganic contaminants from corroding iron, Water Res., 2011, 47, 5257–5269 CrossRef PubMed.
- D. Zhang, F. Zhou, K. Xiao, T. Cui, H. Qian and X. Li, Microbially Influenced Corrosion of 304 Stainless Steel and Titanium by P. variotii and A. niger in Humid Atmosphere, J. Mater. Eng. Perform., 2015, 24, 2688–2698 CrossRef CAS.
- A. Mikó, J. W. Erning, H. Schlerkmann and T. Mathiesen, Comparative investigation of stainless steels used in drinking water distribution systems, Electrochim. Acta, 2009, 54, 7507–7513 CrossRef.
- M. R. Schock, R. N. Hyland and M. M. Welch, Occurrence of contaminant accumulation in lead pipe scales from domestic drinking-water distribution systems, Environ. Sci. Technol., 2008, 42(15), 4285–4291 CrossRef CAS PubMed.
- M. Friedman, A. Hill, S. Booth, M. Hallett, L. McNeill, J. McLean, D. Stevens, D. Sorensen, T. Hammer, W. Ken, M. De Haan, K. MacArthur and K. Mitchell, Metals Accumulation and Release Within the Distribution System: Evaluation and Mitigation, Water Research Foundation Project Report, Water Research Foundation, Denver, CO, 2016 Search PubMed.
- C. Y. Peng, G. V. Korshin, R. L. Valentine, A. S. Hill, M. J. Friedman and S. H. Reiber, Characterization of elemental and structural composition of corrosion scales and deposits formed in drinking water distribution systems, Water Res., 2010, 44(15), 4570–4580 CrossRef CAS PubMed.
- D. A. Lytle, T. Sorg, L. Wang and A. Chen, The accumulation of radioactive contaminants in drinking water distribution systems, Water Res., 2014, 50, 396–407 CrossRef CAS PubMed.
- D. L. Sedlak and P. G. Chan, Reduction of hexavalent chromium by ferrous iron, Geochim. Cosmochim. Acta, 1997, 61(11), 2185–2192 CrossRef CAS.
- J. Swietlik, U. Raczyk-Stanislawiak, P. Piszora and J. Nawrocki, Corrosion in drinking water pipes: The importance of green rusts, Water Res., 2012, 46(1), 1–10 CrossRef CAS PubMed.
- A. G. B. Williams and M. M. Scherer, Kinetics of Cr(VI) reduction by carbonate green rust, Water Res., 2001, 35(17), 3488–3494 CAS.
- I. J. Buerge and S. J. Hug, Kinetics and pH dependence of chromium(VI) reduction by Iron(II), Environ. Sci. Technol., 1997, 31(5), 1426–1434 CrossRef CAS.
- B. R. James and R. J. Bartlett, Behavior of chromium in soils. VI. Interaction between oxidation–reduction and organic complexation, J. Environ. Qual., 1983, 12(2), 173–176 CrossRef CAS.
- B. R. James and R. J. Bartlett, Behavior of chromium in soils. V. fate of organically complexed Cr(II) added to soil, J. Environ. Qual., 1983, 12(2), 169–172 CrossRef CAS.
- C. A. Melendres, M. Pankuch, Y. S. Li and R. L. Knight, Surface enhanced Raman spectroelectrochemical studies of the corrosion films on iron and chromium in aqueous solution environments, Electrochim. Acta, 1992, 37(15), 2747–2754 CrossRef CAS.
- G. J. Puzon, A. G. Roberts, D. M. Kramer and L. Xun, Formation of soluble organo-chromium(III) complexes after chromate reduction in the presence of cellular organics, Environ. Sci. Technol., 2005, 39, 2811–2817 CrossRef CAS PubMed.
- E. J. Kim, J. E. Herrera, D. Huggins, J. Braam and S. Koshowski, Effect of pH on the concentration of lead and trace contaminants in drinking water: a combined batch, pipe loop and sentinel home study, Water Res., 2011, 45(9), 2763–2774 CrossRef CAS PubMed.
- A. S. Hill, M. J. Friedman, S. H. Reiber, G. V. Korshin and R. L. Valentine, Behavior of trace inorganic contaminants in drinking water distribution systems, J. - Am. Water Works Assoc., 2010, 102(7), 107–118 CAS.
- C. Y. Peng, A. S. Hill, M. J. Friedman, R. L. Valentine, G. S. Larson, A. M. Y. Romero, S. H. Reiber and G. V. Korshin, Occurrence of trace inorganic contaminants in drinking water distribution systems, J. - Am. Water Works Assoc., 2012, 104(3), E181–E193 Search PubMed.
- M. Chebeir and H. Liu, Kinetics and Mechanisms of Cr(VI) Formation via the Oxidation of Cr(III) Solid Phases by Chlorine in Drinking Water, Environ. Sci. Technol., 2015, 50(2), 701–710 CrossRef PubMed.
- G. Lee and J. G. Hering, Oxidative dissolution of chromium(III) hydroxide at pH 9, 3, and 2 with product inhibition at pH 2, Environ. Sci. Technol., 2005, 39, 4921–4928 CrossRef CAS PubMed.
- D. R. Lindsay, K. J. Farley and R. F. Carbonaro, Oxidation of Cr III to Cr VI during chlorination of drinking water, J. Environ. Monit., 2012, 14, 1789 RSC.
- H. Lai and L. S. McNeill, Chromium redox chemistry in drinking water systems, J. Environ. Eng., 2006, 132, 842–851 CrossRef CAS.
- S. Saputro, K. Yoshimura, K. Takehara, S. Matsuoka and Narsito, Oxidation of chromium(III) by free chlorine in tap water during the chlorination process studied by an improved solid-phase spectrometry, Anal. Sci., 2011, 27, 649 CrossRef CAS PubMed.
- Z. Luo and N. Chatterjee, Kinetics of oxidation of Cr(III)-organic complexes by H2O2, Chem. Speciation Bioavailability, 2010, 22, 25–34 CrossRef CAS.
- M. Frey, C. Seidel and M. Edwards, Occurrence survey of boron and hexavalent chromium, American Water Works Association, 2004 Search PubMed.
- F. N. Robertson, Hexavalent chromium in the ground water in Paradise Valley, Arizona, Ground Water, 1975, 13, 516–527 CrossRef CAS.
- C. Oze, S. Fendorf, D. K. Bird and R. G. Coleman, Genesis of hexavalent chromium from natural sources in soil and groundwater, Int. Geol. Rev., 2004, 46, 97–126 CrossRef.
- J. W. Ball and J. A. Izbicki, Occurrence of hexavalent chromium in ground water in the western Mojave Desert, California, Appl. Geochem., 2004, 19, 1123–1135 CrossRef CAS.
- J. A. Izbicki, J. W. Ball, T. D. Bullen and S. J. Sutley, Chromium, chromium isotopes and selected trace elements, western Mojave Desert, USA, Appl. Geochem., 2008, 23, 1325–1352 CrossRef CAS.
- R. Bartlett and B. James, Behavior of chromium in soils. VI. Interactions between oxidation–reduction and organic complexation, J. Environ. Qual., 1979, 8, 31 CrossRef CAS.
- P. R. Shewry and P. J. Peterson, Distribution of chromium and nickel in plants and soil from serpentine and other sites, J. Ecol., 1976, 64, 195–212 CrossRef CAS.
- R. J. Bartlett and J. M. Kimble, Behavior of chromium in soils: II. Hexavalent forms, J. Environ. Qual., 1976, 5, 383 CrossRef CAS.
- P. Stefanov, D. Stoychev, M. Stoycheva and T. Marinov, XPS and SEM studies of chromium oxide films chemically formed on stainless steel 316L, Mater. Chem. Phys., 2000, 65(2), 212–215 CrossRef CAS.
- J. Lin, M. Ellaway and R. Adrien, Study of corrosion material accumulated on the inner wall of steel water pipe, Corros. Sci., 2001, 43, 2065–2081 CrossRef CAS.
- T. Laitinen, Localized corrosion of stainless steel in chloride, sulfate and thiosulfate containing environments, Corros. Sci., 2000, 42(3), 421–441 CrossRef CAS.
- Y. Cui, S. Liu, K. Smith, K. Yu, H. Hu, W. Jiang and Y. Li, Characterization of corrosion scale formed on stainless steel delivery pipe for reclaimed water treatment, Water Res., 2016, 88, 816–825 CrossRef CAS PubMed.
- O. Ajouyed, C. Hurel, M. Ammari, L. B. Allal and N. Marmier, Sorption of Cr(VI) onto natural iron and aluminum (oxy) hydroxides: effects of pH, ionic strength and initial concentration, J. Hazard. Mater., 2010, 174, 616–622 CrossRef CAS PubMed.
- H. B. Bradl, Adsorption of heavy metal ions on soils and soils constituents, J. Colloid Interface Sci., 2004, 277(1), 1–18 CrossRef CAS PubMed.
- J. E. McLean, L. S. McNeill, M. A. Edwards and J. L. Parks, Hexavalent chromium review, part 1: health effects, regulations and analysis, J. - Am. Water Works Assoc., 2012, 104(6), E348–E357 Search PubMed.
- J. M. Chen and O. J. Hao, Microbial chromium(VI) reduction, Crit. Rev. Environ. Sci. Technol., 1998, 28(3), 219–258 CrossRef CAS.
- N. Blute, K. Porter and B. Kuhnel, Cost estimates for two hexavalent chromium treatment processes, In the Proceedings of American Water Works Association Annual Conference and Exposition, Chicago, IL, 2010 Search PubMed.
- G. Lee and J. G. Hering, Removal of Chromium(VI) from Drinking...Coagulation with Iron(II), J. Water Supply: Res. Technol.--AQUA, 2003, 52(5), 319–331 CAS.
- L. E. Eary and D. Rai, Chromate removal from aqueous wastes by reduction with ferrous ion, Environ. Sci. Technol., 1988, 22(8), 972–980 CrossRef CAS PubMed.
- M. B. Fritzen, A. J. Souza, T. A. G. Silva, L. Souza, R. A. Nome, H. D. Fiedler and F. Nome, Distribution of hexavalent Cr species across the clay mineral surface–water interface, J. Colloid Interface Sci., 2006, 296(2), 465–471 CrossRef CAS PubMed.
- P. J. Vikesland, K. Ozekin and R. L. Valentine, Monochloramine decay in model and distribution system waters, Water Res., 2001, 35, 1766–1776 CrossRef CAS PubMed.
| This journal is © The Royal Society of Chemistry 2016 |

