
Emerging investigators series: untangling the microbial ecosystem and kinetics in a nitrogen removing photosynthetic high density bioreactor†
Jacob R.
Price
 a,
Saeed
Keshani Langroodi
a,
Yemin
Lan
b,
Jonas M.
Becker
c,
Wen K.
Shieh
d,
Gail L.
Rosen
e and
Christopher M.
Sales
*a
a,
Saeed
Keshani Langroodi
a,
Yemin
Lan
b,
Jonas M.
Becker
c,
Wen K.
Shieh
d,
Gail L.
Rosen
e and
Christopher M.
Sales
*a
aCivil, Architectural, and Environmental Engineering, Drexel University, 3141 Chestnut Street, Philadelphia, Pennsylvania 19104, USA. E-mail: chris.sales@drexel.edu; Fax: (215) 895 1363; Tel: (215) 895 2155
bSchool of Biomedical Engineering, Science, and Health Systems, Drexel University, 3141 Chestnut Street, Philadelphia, Pennsylvania 19104, USA
cDepartment of Biomimetics, Hochschule Bremen, Neustadtswall 30, D-28199 Bremen, Germany
dChemical and Biomolecular Engineering, The University of Pennsylvania, 220 S. 33rd Street, Philadelphia, Pennsylvania 19104, USA
eElectrical and Computer Engineering, Drexel University, 3141 Chestnut Street, Philadelphia, Pennsylvania 19104, USA
First published on 20th April 2016
Abstract
An increasing number of water resource recovery facilities are implementing biological processes for nutrient removal and recovery. One challenge with engineering these processes is the kinetic characterization of nutrient dynamics within microbial communities, where metabolite sharing and varying ecological niches and strategies can lead to complex interactions among organisms. We have applied a 3-dimensional (3-D) visualization method to reveal the effects of varying proportions and total loading of inorganic N species (NH4+ and NO3−) on assimilatory and dissimilatory processes by a mixed photosynthetic community within a continuous high density bioreactor (HDBR). This 3-D method enabled the identification of loading conditions that result in maximum specific total N removal rates, which were not easily apparent with 1-dimensional linear regression. Furthermore, microscopic and metagenomic analyses enabled the identification of Chlamydomonas reinhardtii and Parachlorella kessleri as the two dominant algal strains and a member of the Leptolyngbya genus as the dominant cyanobacteria present within the community. Ammonia- and nitrite-oxidizing bacteria (AOB and NOB respectively) were found to comprise a small but significant portion of the bacterial community. Relative and absolute abundance of total bacteria, AOB, NOB, denitrifying bacteria, C. reinhardtii and P. kessleri were obtained from metagenomic and real-time PCR (qPCR) analyses. Within this work, we present evidence that the operational conditions and parameters of a reactor has an effect on each of the investigated components of the microbial community and that those effects ultimately impact the resultant reactor kinetics.
Water impactNatural and engineered biological processes are often influenced by multiple microorganisms. By combining kinetic and molecular analyses this study demonstrates that changes in environmental conditions within a bioreactor can lead to changes in structure and abundance of nitrogen-transforming organisms within a photosynthetic mixed community, which ultimately affect the nature and extent of nutrient removal and dynamics. |
Introduction
Point and non-point nutrient sources have both been connected to the eutrophication of receiving water bodies.1–4 Wastewater effluent receiving water bodies are some of the most anthropogenically impacted aquatic systems. Controlling nutrient loading, from sources such as wastewater treatment plants, entering receiving waters is vital to addressing eutrophication.2,4 While chemical processes such as struvite precipitation exist to remove nitrogen (N) and phosphorus (P), a larger number of different biological processes, such as deammonification using anaerobic ammonium oxidizing bacteria and enhanced biological phosphorus removal using phosphate-accumulating organisms, are being implemented to improve nutrient removal from wastewater.5–7 The application of algae for nutrient removal is another promising biological process,8–15 which offers the additional benefit of producing algal biomass, an emerging resource11,12,16 that can be used for a variety of purposes including the production of biofuel, pigments, and supplementary proteins.17,18One of the major challenges with studying nutrient kinetics within mixed biological systems is the potential for competition, feedback, and metabolite sharing that can develop in regards to N species.19 Three major N pathways exist within mixed photosynthetic microbial communities: integration of N into algal biomass, oxidation of NH4+ to NO3− by nitrifying bacteria, and assimilation of N into bacterial biomass by heterotrophic bacteria.20 All of these interacting ecological processes could impact overall N removal and uptake kinetics within a photosynthetic microbial community,19,21 making it important to understand the effect of operating conditions, such as the proportion and loading of N species, on the microbial ecology of the system.
In aggregate, the performance of algal-bacterial systems is a function of the metabolic processes carried out by each species as well as the interactions between species.18 Similar to the symbiotic interrelation that exists between bacteria and plants,22 algae and bacteria form symbiotic relationships23,24 although the study of these interactions are limited in extent.25,26 Within this phycosphere, bacteria benefit through algae's secretion of extracellular products that enhance bacterial growth and biofilm establishment and stabilization.18,27,28 In turn, bacteria have been observed to produce and excrete vitamins and other growth factors which support and stimulate algal growth.26,29,30 Such placid exchanges between algae and bacteria are not always present, as algae have been demonstrated to produce and excrete antibacterial chemicals31 and compounds that interfere with bacterial quorum sensing,32 while some bacteria are capable of producing algaecides.33
The myriad combinations of symbiotic and antagonistic relationships between algae and bacteria emphasize the importance of investigating both single species metabolism and the extracellular interactions that drive the ecological functions within these microbial communities.18,34,35 To date, many studies have focused on axenic or single-algal species cultures when characterizing the performance of photosynthetic communities in nutrient and inorganic carbon uptake.18 Expanding characterization studies to include multiple algal and bacterial species as well as utilizing tools from molecular biology may greatly advance the progress of algal-biotechnologies.18,34–38
The development of molecular biology tools provides investigators with novel and powerful methods of probing intercellular processes, inter-species interactions, and ecological relationships within microbial communities.39 Real-time PCR has been used extensively to study the nitrifying and denitrifying bacterial communities present within soils,40–42 wastewater treatment plants43–49 and constructed wetlands,50 as well as bench and pilot scale bioreactors.51,52 Metagenomic analysis has previously been applied to that of algal-bacterial cultures within photobioreactors (PBR), Krohn-Molt et al. found that bacterial pathways for organic carbon utilization were highly diverse, and B vitamin production pathways were highly abundant, supporting mutualistic relationships between algae and algal-associated bacterial species.53 However, the Krohn-Molt et al. did not attempt to relate the kinetics or activity of the PBRs to the metagenomics data.
This work describes the kinetic, metabolic, and metagenomic relationships and associations found within a high density bioreactor (HDBR)54–56 which has been adapted to a photobioreactor (PBR) configuration57 to study the nitrogen removal characteristics. We present and demonstrate the utility found in 3-dimensional (3-D) visualizations when interpreting reactor kinetics where numerous metabolites are of interest (e.g., NH4+, NO2−, and NO3−) and multiple species and metabolic pathways consume and produce these metabolites. Similar to graphical-mechanistic approaches to understanding and predicting competitive and predation behavior,58–60 these visualizations enable investigators to reveal feedback and synergistic phenomena in N cycling. Exploratory metagenomic analysis was carried out to describe the taxonomic and functional composition within the HDBR. Real-time PCR was then used to quantitatively link reactor kinetics to microbial community composition.
Methods
HDBR experimental design
A high density bioreactor was seeded with inoculate obtained from a decorative fish pond on the University of Pennsylvania's campus in Philadelphia, Pennsylvania, USA. A synthetic influent, containing no organic carbon, was prepared from mineral salts, as previously described.57 Influent concentrations of NH4+ and NO3− were varied over several influent conditions resulting in a range of specific loading rates into the reactor. The experiment was designed to maintain a distribution of NH4+ and NO3− such that the total N concentration of the feed was below 40 mg N L−1. A description of the reactor, its operation, sample collection, and the analytical analysis thereof is provided in the ESI;† a comprehensive discussion of the HDBR system and its adaption to a PBR configuration appears in Price et al., 2015.57 A combination of light (bright field and differential interference contrast (DIC)) and scanning electron microscopy (SEM) were used in an attempt to identify algal species and understand the structure of flocs formed within the HDBR; these methods are described in the ESI.†Incomplete sample pairs (missing influent or effluent samples) were removed from the data set. Only sample pairs describing pseudo-steady state for each condition were used for analysis. Accordingly, samples obtained within 24 hours of an influent condition change were dropped. Data handling, statistical analysis, and plotting were carried out in R.61 Global outliers were identified using the boxplot() function within R.61–64 The boxplot() function considers any point further than 1.5 times the interquartile range (IQR) from the 1st and 3rd quartiles to be an outlier. Simple linear regression was used to analyze the significance of relationships between influent and effluent N species.61,65,66 Reviewing normal quantile–quantile and residual plots identified other potential outliers.
Specific loading rates of NH4+ and NO3− were calculated as the mass of ammonia- and nitrate-nitrogen input per unit time per unit biomass (mg N h−1 g SS−1) (Table S1†). Specific removal rates of NH4+ and NO3− were calculated as the difference between influent and effluent content for each N species per unit time per unit biomass (mg N h−1 g SS−1). The specific removal rate of total N was calculated as the difference between influent and effluent content of the sum of NH4+, NO2−, and NO3− per unit time per unit biomass (mg N h−1 g SS−1). Dissimilatory denitrification was not expected at the outset of the experiment due to the availability of dissolved oxygen, provided through aeration in the reactor's recycle vessel and production by algae via photosynthetic reactions.57
DNA extraction
Microbial community samples were collected from the reactor at the end of each condition set and immediately stored at −80 °C. Total DNA was extracted from three biological replicates of each sample using a modified version of the Animal Tissue Protocol of the DNeasy Blood & Tissue Kit (Qiagen Inc, Valencia, CA, USA). For each replicate, 200 μL of sample was transferred to PCR-clean 2 mL tubes and centrifuged at 5000 g for 30 minutes and the supernatant was discarded. Biomass was resuspended in 180 μL of lysis buffer and 20 μL of proteinase K and incubated at 56 °C for 12 hours. The remainder of the extraction steps followed the animal tissue protocol described in the kit's manual. To prevent dilution of the DNA concentration, final elution of DNA was carried out via a single elution with 200 μL of DNase/RNase-free water. DNase/RNase-free water was used as an alternative to the Buffer AE in the kit to ensure compatibility with downstream processes. The DNA concentration of the elutant was measured on a Qubit 2.0 using dsDNA high sensitivity assay kits (Life Technologies, Thermo Fisher Scientific, Carlsbad, CA, USA). Table S2† contains a list of the DNA replicates, the extracted DNA concentrations for each replicate, the biomass, biomass zone volume, and biomass density within the reactor at time of collection.Metagenomics sequencing
Total DNA from Condition 3 and Condition 5 were submitted for paired-end sequencing on an Illumina HiSeq 2500 sequencer. Provincial examination of the sequencing results for taxonomic composition and relative abundance was carried out using the Metagenomics RAST Server (MG-RAST).67 Raw reads were uploaded to MG-RAST and were subjected to quality control measures within MG-RAST prior to entering the annotation pipeline. Artificial duplicate sequences produced during sequencing were removed as described by Gomez-Alvarez et al.68 The sequences were then screened to remove any data derived from H. sapiens as described by Langmead et al.69 Low quality sequences were removed with DynamicTrim;70 a minimum Phred score of 15 was selected to be considered a high-quality base call and sequences were trimmed to contain a maximum of 5 low-quality bases. These pipeline settings were the default parameters in the MG-RAST pipeline configuration at the time the metagenomes were uploaded.67,71 Quality control statistics for the MG-RAST pipeline are presented in Table S3.†Absolute and relative quantification of select algae and bacteria
An array of 12 primer pairs were selected with the intention of quantifying the abundance of two algae species and the total, nitrifying, and denitrifying bacterial populations within the reactors (Table S4†). Absolute quantification of total bacteria, Chlamydomonas reinhardtii, and Parachlorella kessleri was performed. Total bacterial 16S rDNA was targeted with the primers 1055f and 1392r.43Chlamydomonas reinhardtii rbcL was targeted with the primers rbcL_cr_F and rbcL_cr_R (this study). Parachlorella kessleri was targeted with the primers rbcL_pk_F and rbcL_pk_R (this study). Abundances of nitrifying and denitrifiying bacteria were determined on a relative quantification basis. AOB were quantified via 16S rDNA using CTO198f A/B, CTO189f C, and CTO654R72 as well as ammonium monooxygenase gene (amoA) using amoA-1F and amoA-2R.73 Forward primers CTO198f A/B and CTO189f C were combined in a 2![[thin space (1/6-em)]](https://www.rsc.org/images/entities/char_2009.gif) :1 ratio prior to carrying out qPCR.45,72 NOB were quantified via three primer pairs: Nitrobacter sp. 16S rDNA with FGPS872 and FGPS1269′,74 the Nitrobacter sp. nitrite oxidioreductase with NxrB 1F and NxrB 1R,75 and Nitrospira sp. 16S rDNA with NSR 1113F and NSR 1264R.76 Denitrifying bacteria were quantified exclusively through functional genes using primers targeting copper containing nitrate reductase gene (nirK) (nirK 1F and nirK 5R77), cytochrome cd1-containing nitrite reductase gene (nirS) (nirS cd3AF and nirs R3cd78), nitric oxide reductase gene (nor) (cnorB-2F and cnorB-6R79), and nitrous oxide reductase gene (nosZ) (nosZ-F80 and nosZ 1162R78).
:1 ratio prior to carrying out qPCR.45,72 NOB were quantified via three primer pairs: Nitrobacter sp. 16S rDNA with FGPS872 and FGPS1269′,74 the Nitrobacter sp. nitrite oxidioreductase with NxrB 1F and NxrB 1R,75 and Nitrospira sp. 16S rDNA with NSR 1113F and NSR 1264R.76 Denitrifying bacteria were quantified exclusively through functional genes using primers targeting copper containing nitrate reductase gene (nirK) (nirK 1F and nirK 5R77), cytochrome cd1-containing nitrite reductase gene (nirS) (nirS cd3AF and nirs R3cd78), nitric oxide reductase gene (nor) (cnorB-2F and cnorB-6R79), and nitrous oxide reductase gene (nosZ) (nosZ-F80 and nosZ 1162R78).
The development of species-specific primers was necessary to quantify the abundance of algal species. To facilitate this goal, metagenomic reads were aligned to reference target genomes. To account for microalgae, every complete genome within Viridiplantae, which encompasses both Chlorophyta and Streptophyta, was acquired from GenBank. To address cyanobacteria, every complete genome (chromosome) available for organisms falling into Cyanobacteria, Chloroflexi, and Chlorobiaceae was also downloaded. The last two groups, Chloroflexi and Chlorobiaceae, were also collected to ensure that reads belonging to these groups were not incorrectly classified by MG-RAST as being Cyanobacteria. Each group (algae and cyanobacteria) of genomes was pooled into a single reference file. Raw metagenomic reads were mapped onto the pooled reference genomes using Bowtie2;81 within this context, Bowtie2 treats each individual genome as a chromosome and only the primary alignment for each read was reported. The total number of reads aligned to individual algae and cyanobacterial genomes were obtained through SAMtools82 and BEDTools.83 Five genomes representing Chlamydomonas reinhardtii and Parachlorella kessleri overwhelmingly dominated the aligned read count. Similarly, the reads mapped onto cyanobacteria chromosomes were primarily mapped to one genome, Leptolyngbya strain O-77. Real-time PCR primers were designed for each of the microalgae using BLAST84 and Primer BLAST;85 both primer sets target the ribulose bisphospate carboxylase (RuBisCO) large chain gene (rbcL) found in algal chloroplasts.
Real-time PCR (qPCR) was carried out on a Roche LightCycler 480 (Roche Diagnostics Corporation, Indianapolis, IN, USA) using SYBR Green chemistry (Applied Biosystems, Carlsbad, CA, USA). Primers and standard targets for qPCR were synthesized by Eurofins MWG (Huntsville, AL, USA). All qPCR reactions were 20 μL in volume and contained 2 μL of undiluted DNA template, a primer concentration of 0.3 μM and SYBR Green Master Mix. Three technical replicates were analyzed for each of the three biological replicates. At the end of each qPCR run, melting curve data was collected and analyzed to verify amplification product purity.
The thermocycler program used to carry out qPCR for the total bacteria primer set used pre-incubation at 50 °C for 3 min, 95 °C for 10 min, followed by 45 cycles at 95 °C for 30 s, 50 °C for 60 s, and 72 °C for 20 s.43 For the primer sets targeting algal rbcL, the thermocycler program entailed pre-incubation at 50 °C for 2 min, 95° for 10 min, and 40 cycles at 95 °C for 1 min, 56 °C for 1 min, and 72° for 1 min. The remaining 9 nitrogen-centric primer sets used the following thermocycler program: pre-incubation at 50 °C for 2 min, 95 °C for 10 min, and 40 cycles at 95 °C for 1 min, 50 °C for 1 min, and 60 °C for 1 min.45
Serial dilutions of synthetic target genes were used to create standard curves for the absolute quantification of total bacteria and two microalgae species. The target for the total bacterial primer pair was a fragment of 16S rDNA gene for a Nitrospira sp. (GenBank accession number AF420301).43,76 The target for the Chlamydomonas reinhardtii and Parachlorella kessleri primer pairs were based on fragments of representative rbcL gene sequences for each species (GenBank accession numbers FJ423446 (ref. 86) and FJ968741,87 respectively). The sequences of the standard targets are provided in the ESI.†
The 2−ΔΔCT method was used to compare the relative abundance of the nitrogen-centric target genes.88 Total bacterial 16S DNA was selected as the reference gene, and Condition 5 was selected as the reference sample. The CT values of the technical replicates were averaged to obtain an aggregate value for each biological replicate. Taking the average of technical replicates allows the computation of 2−ΔΔCT for all 9 permutations of reference and target values. Permutations were used as an alternative to averaging both the technical and biological replicates and avoids artificially masking the variation present in the CT results. The relative abundance values were then averaged and their standard error calculated. 2-Tailed t-tests, with α set to 0.05 (α/2 = 0.025), were carried out to determine if each condition's relative abundance for a given gene was statistically different from Condition 5.
Results and discussion
Light and SEM
The high density of the biomass flocs made dilution necessary to obtain images of their three-dimensional structure. Bright field microscopy revealed several overlapping layers of intertwined filamentous green bacteria (most likely cyanobacteria) and green microalgae entrained within the filamentous mesh. Without further dilution, observation is limited by the amount of light that is transmitted through the sample and the image was generally blurry. However, at higher magnification and while using DIC several classes of photosynthetic organisms can be identified, including little round green things (LRGT) (Fig. S1A†) and filamentous or segmented cyanobacteria, tentatively identified as Leptolyngbya sp. (Fig. S1B†). Less commonly found was Scenedesmus dimorphous (Fig. S1C†) and a relative (Fig. S1D†). Because many microalgae appear morphologically similar, LRGT is used as a catchall phrase intended to cover photosynthetic microorganisms of undetermined species.Scanning electron microscopy validated the observations made during light microscopy that the physical structure of the flocs was highly complex (Fig. 1). Exopolymeric substance (EPS) appeared to form a highly adhesive film that serves to fix a multitude of organisms within the floc including LRGT (Fig. 1A), Trachelomonas sp. (Fig. 1B), and filamentous segmented cyanobacteria (putative Leptolyngbya sp.) (Fig. 1C). The primary structure of the flocs seem to be determined by a net- or mesh-like network of cyanobacteria connected with EPS; some of the cyanobacteria strands exceeded 100 μm in length. LRGTs are entrenched both within and on mats of EPS that stretch between these strands. The Trachelomonas sp. that was observed appears to exclusively grow on the surface of the EPS. The close association between microorganisms within the flock and the microbe-anchoring function of EPS corroborate the conclusions reported by Krohn-Molt et al.53
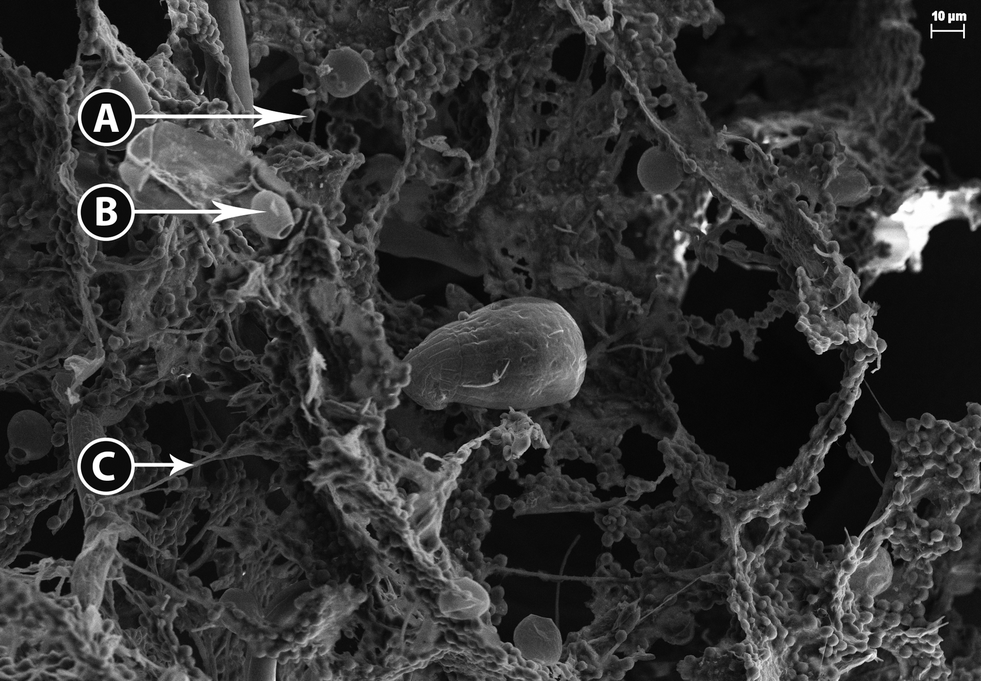 | ||
| Fig. 1 Scanning electron micrograph of algae and bacteria entrained in biomass floc including A) LRGT, putative microalgae, B) Trachelomonas sp., and C) filamentous segmented cyanobacteria, putative Leptolyngbya sp. | ||
Reactor kinetics
While the removal of total N was observed over all loading rates of total N, NH4+, and NO3−, it was not significantly affected by the specific loading rates of total N, NH4+, or NO3− (Fig. S2, Table S5†). Over the range of total N loading rates, the specific removal rates of NH4+ were positive while the specific removal rates of NO3− were generally negative (Fig. S3†). The removal of NH4+ coinciding with the generation of NO3− suggests that nitrification is being carried out, alluding to the presence of AOB and NOB within the HDBR. Removal of NH4+ was significantly effected by the loading rate of NH4+ (n = 38, p = 0.008387), but not by NO3− loading (Fig. S4†). The removal rate of NO3− was found to significantly decrease in response to the NH4+ loading (n = 38, p = 0.006409), implying that nitrifying bacteria increase their activity in response to NH4+ loading (Fig. S4†). The removal rate of NO3− significantly increased in response to the loading rate of NO3− (n = 38 p = 0.009696). This trend is possibly an artifact of lower NH4+ loading rate at those points.While it was possible to derive some inferences from the single-variate regression analysis above, this type of approach presented two problems, the first being that noise within the data results in poor fitting regression results, even when the relationships are statistically significant. The second and more significant problem was that single-variate regression does not account for, and could mask, interactions between predicting variables if they are not independent, (e.g. nitrification in this study). Rather, information from both predictor variables was concurrently considered when describing systems with multiple dependent variables such as nitrogen cycling kinetics. Quantitative analysis using two predictor variables through 2-dimensional regression requires careful model building and development, typically building off empirical or theoretical models. The authors are unaware of quantitative models that integrate both NH4+ and NO3− loading information to simultaneously describe microbial N uptake and transformational processes such as nitrification and denitrification and so have started to describe this system by graphically portraying specific removal rates with respect to the loading rates.
Contour maps and 3-D plots over the full range of NH4+ and NO3− specific loading rates were generated in order to visualize the relationship of how these two predictors affected removal rates and N dynamics within the system (Fig. 2). These graphical techniques enable the interpretation of a response variable over a 2-dimensional sample space (Fig. 3). From these plots, specific removal of total N species is locally maximal at two points, the first is located where NH4+ loading is of intermediate values and NO3− loading is low (approximately 0.1:0.75 NO3−:NH4+), and the second where NH4+ loading is low and NO3− loading is high (approximately 1.5:0.5 NO3−:NH4+) (Fig. 2A and B). NH4+ removal was observed over the entire range of specific loadings with the highest removal occurring at one of the two maximal points (Fig. 2C and D). NO3− removal was observed to be generally negative, indicating NO3− was accumulating within the system (Fig. 2E and F). The exception is at the highest NO3−:NH4+ loading ratios where a sharp peak is located and positive removal occurs (Fig. 2E and F). This peak coincides with the highest total N removal rates observed in Fig. 2A and B. The presence of two maximal points for total N removal in conjunction with those points coinciding with the maximal removal rates of NH4+ and NO3− indicate that not only is total N loading important but the ratio or distribution of nitrogen species also has an impact on total N removal. Increasing NH4+ loading rates generally results in greater accumulation of NO3− within the reactor, corroborating the conjecture that the activity of AOB and NOB increases in response to increasing NH4+ loading from the single-variate analysis.
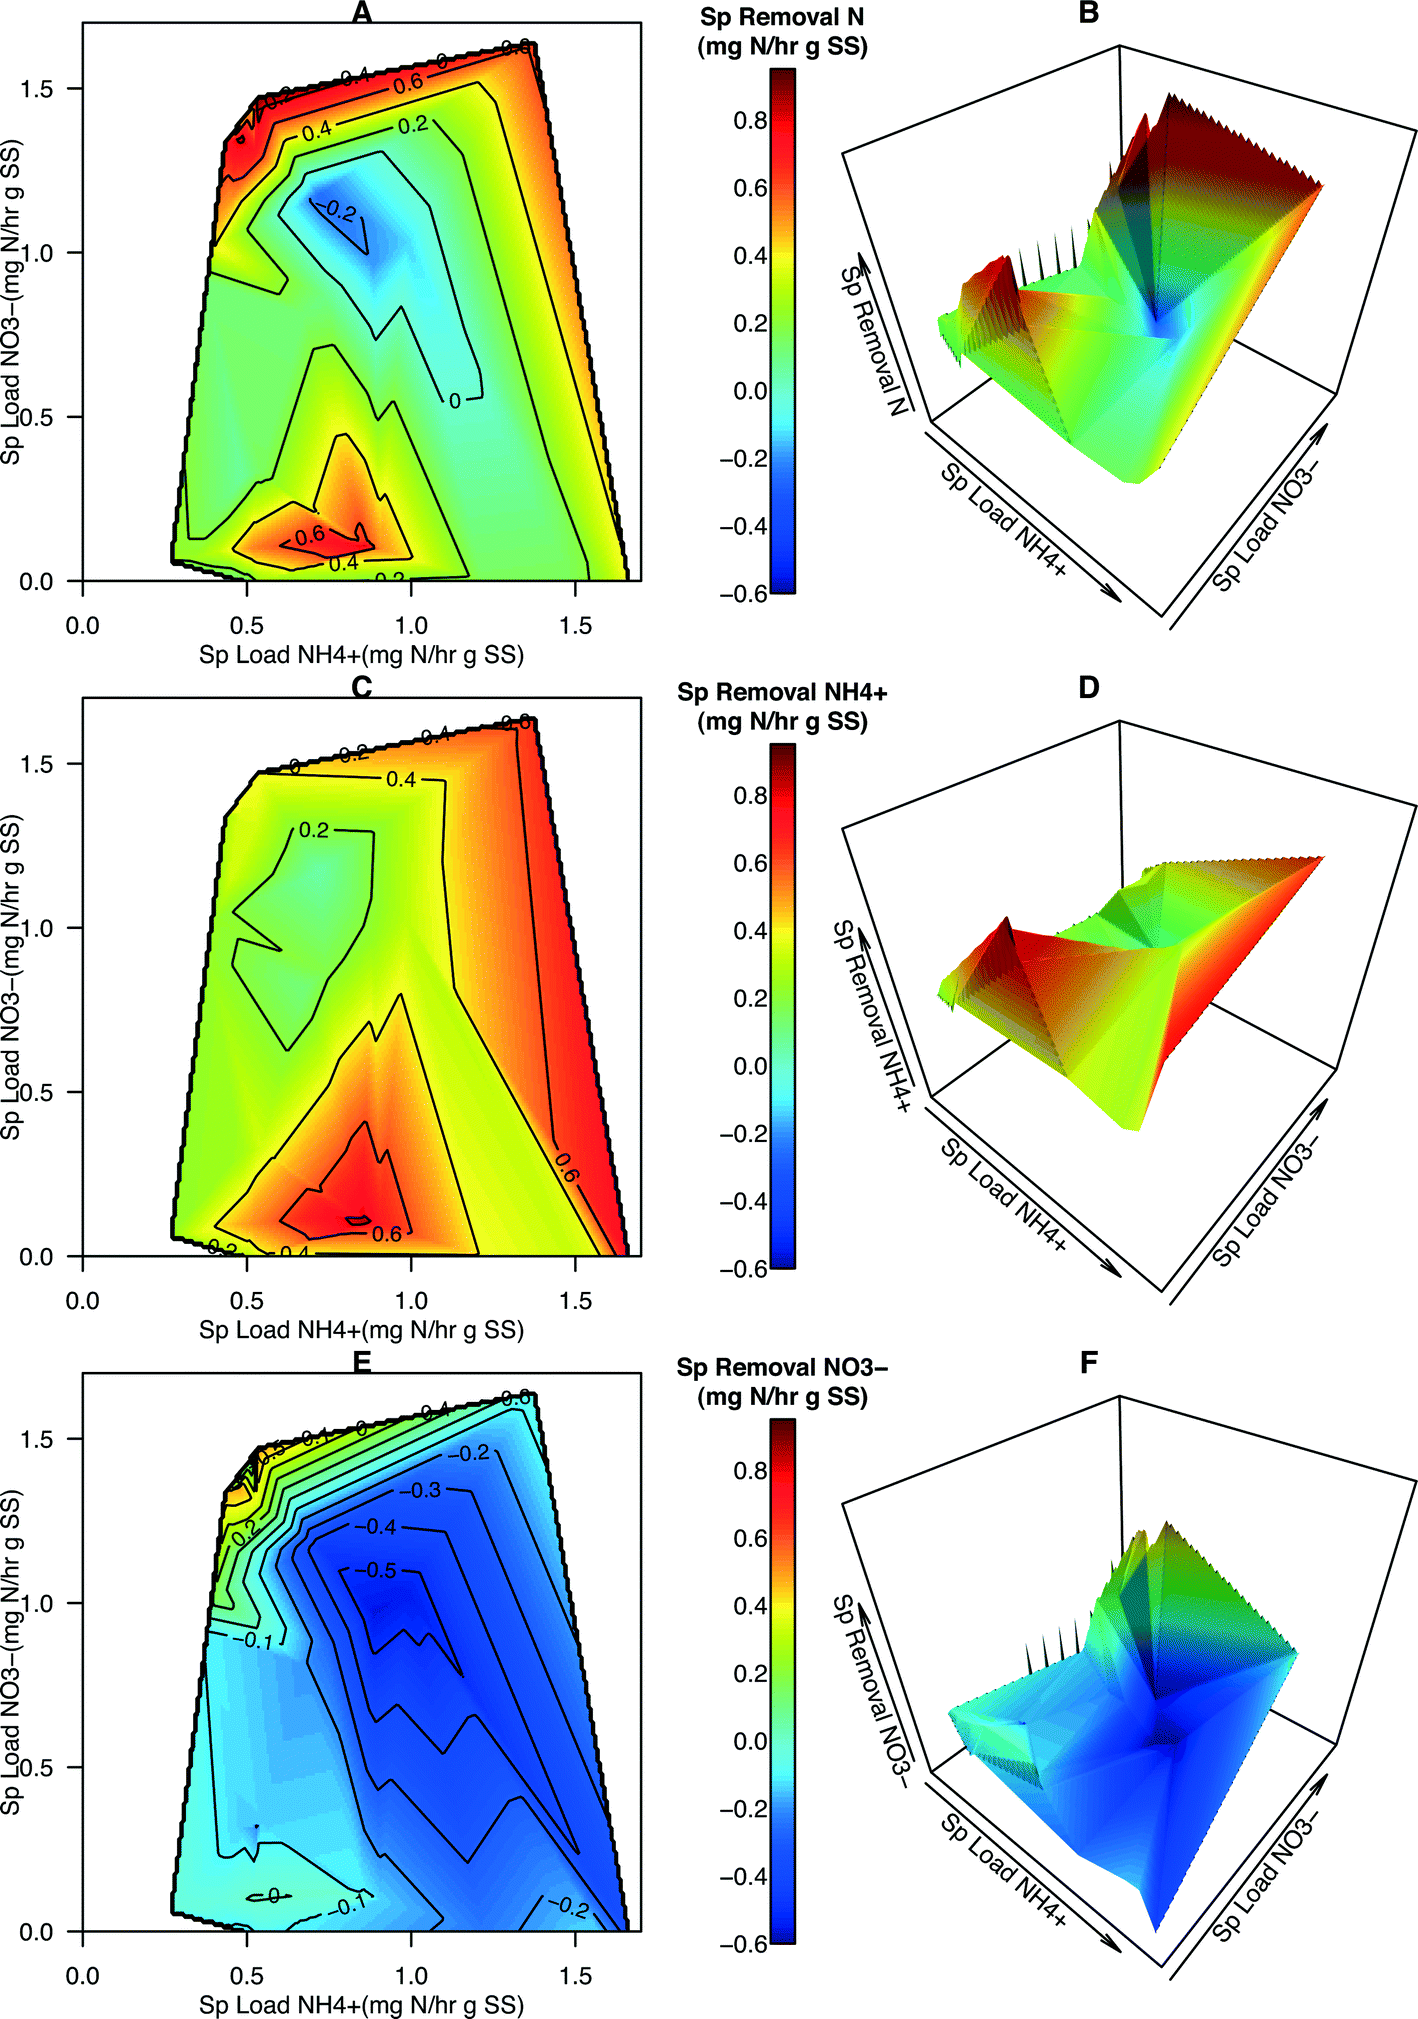 | ||
| Fig. 2 3-D visualization of specific removal rates vs. N species loading rates. Contour maps and 3-D plots portraying the specific removal rates (mg N h−1 g SS−1) of total N (A, B), NH4+ (C, D), and NO3− (E, F) in relation to the specific loading rates of NH4+ and NO3− (mg N h−1 g SS−1). The domain of the 3-d plots (A, C, E) is identical to that of the contour maps (B, D, F) and the color scheme is consistent between all 6 panels to facilitate visual comparison. The use of contour maps or 3-D plots enables the visualization of a response variable over a 2-D sample space. | ||
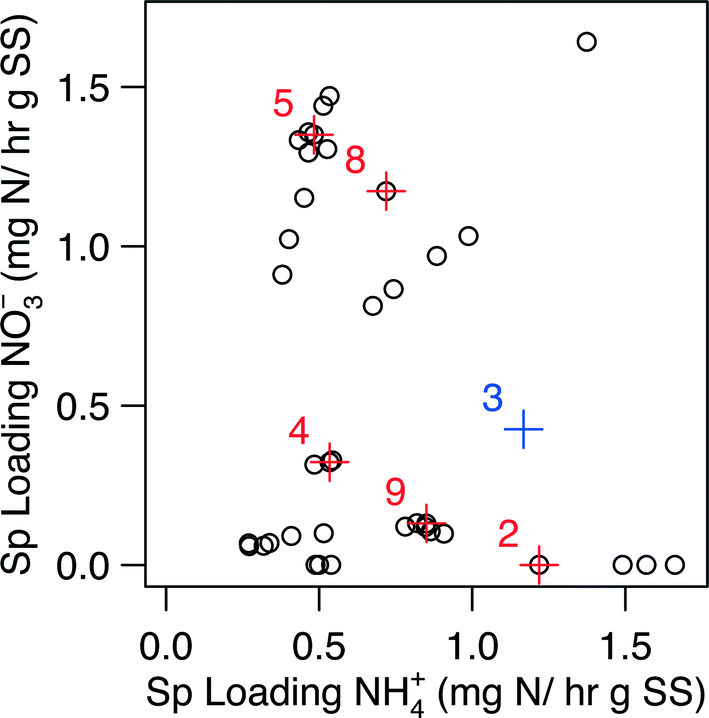 | ||
| Fig. 3 The domain of specific loading rates used for the generation of Fig. 2. Points displayed in red represent points where biomass was collected for metagenomic and qPCR analysis; the influent condition set is designated by the number next to the point. The point for Condition 3 (point in blue) excluded from the kinetic analysis. The biological samples for Condition 3 was, however, still subjected to metagenomic and qPCR analysis. | ||
Contour maps and 3-dimensional plots portraying percent removal (%) of total N, NH4+, and NO3− were generated to provide more information about how specific loading rates affected the effectiveness of N removal in the system (Fig. 4). Several data points had a specific NO3− loading rate of zero (i.e., reactor influent contained zero NO3−N). Given that NO3− is being created in this system, percent removal, positive or negative, cannot be calculated for those points and they were removed from the dataset leading to a slight reduction in the domain used for generating the contour maps and plots (compare Fig. S5† with Fig. 3). The average percent total N removal was 35.5% (range −12.8% to 78.2%). The average percent NH4+–N removal was 68.7% (range −6.4% to 100.0%). The average percent NO3−N removal was −27.7% (range −141.0% to 35.4%). Maximum total N removal occurred at low NO3−:NH4+ ratios (Fig. 4A and B). Over 80% of NH4+ was removed in this region (Fig. 4C and D). As with the removal rates of NO3−, percent removal of NO3− was determined to be maximal at the highest NO3−:NH4+ loading ratios and appears to decrease as NO3− loading decreases and NH4+ loading increases (Fig. 4E and F).
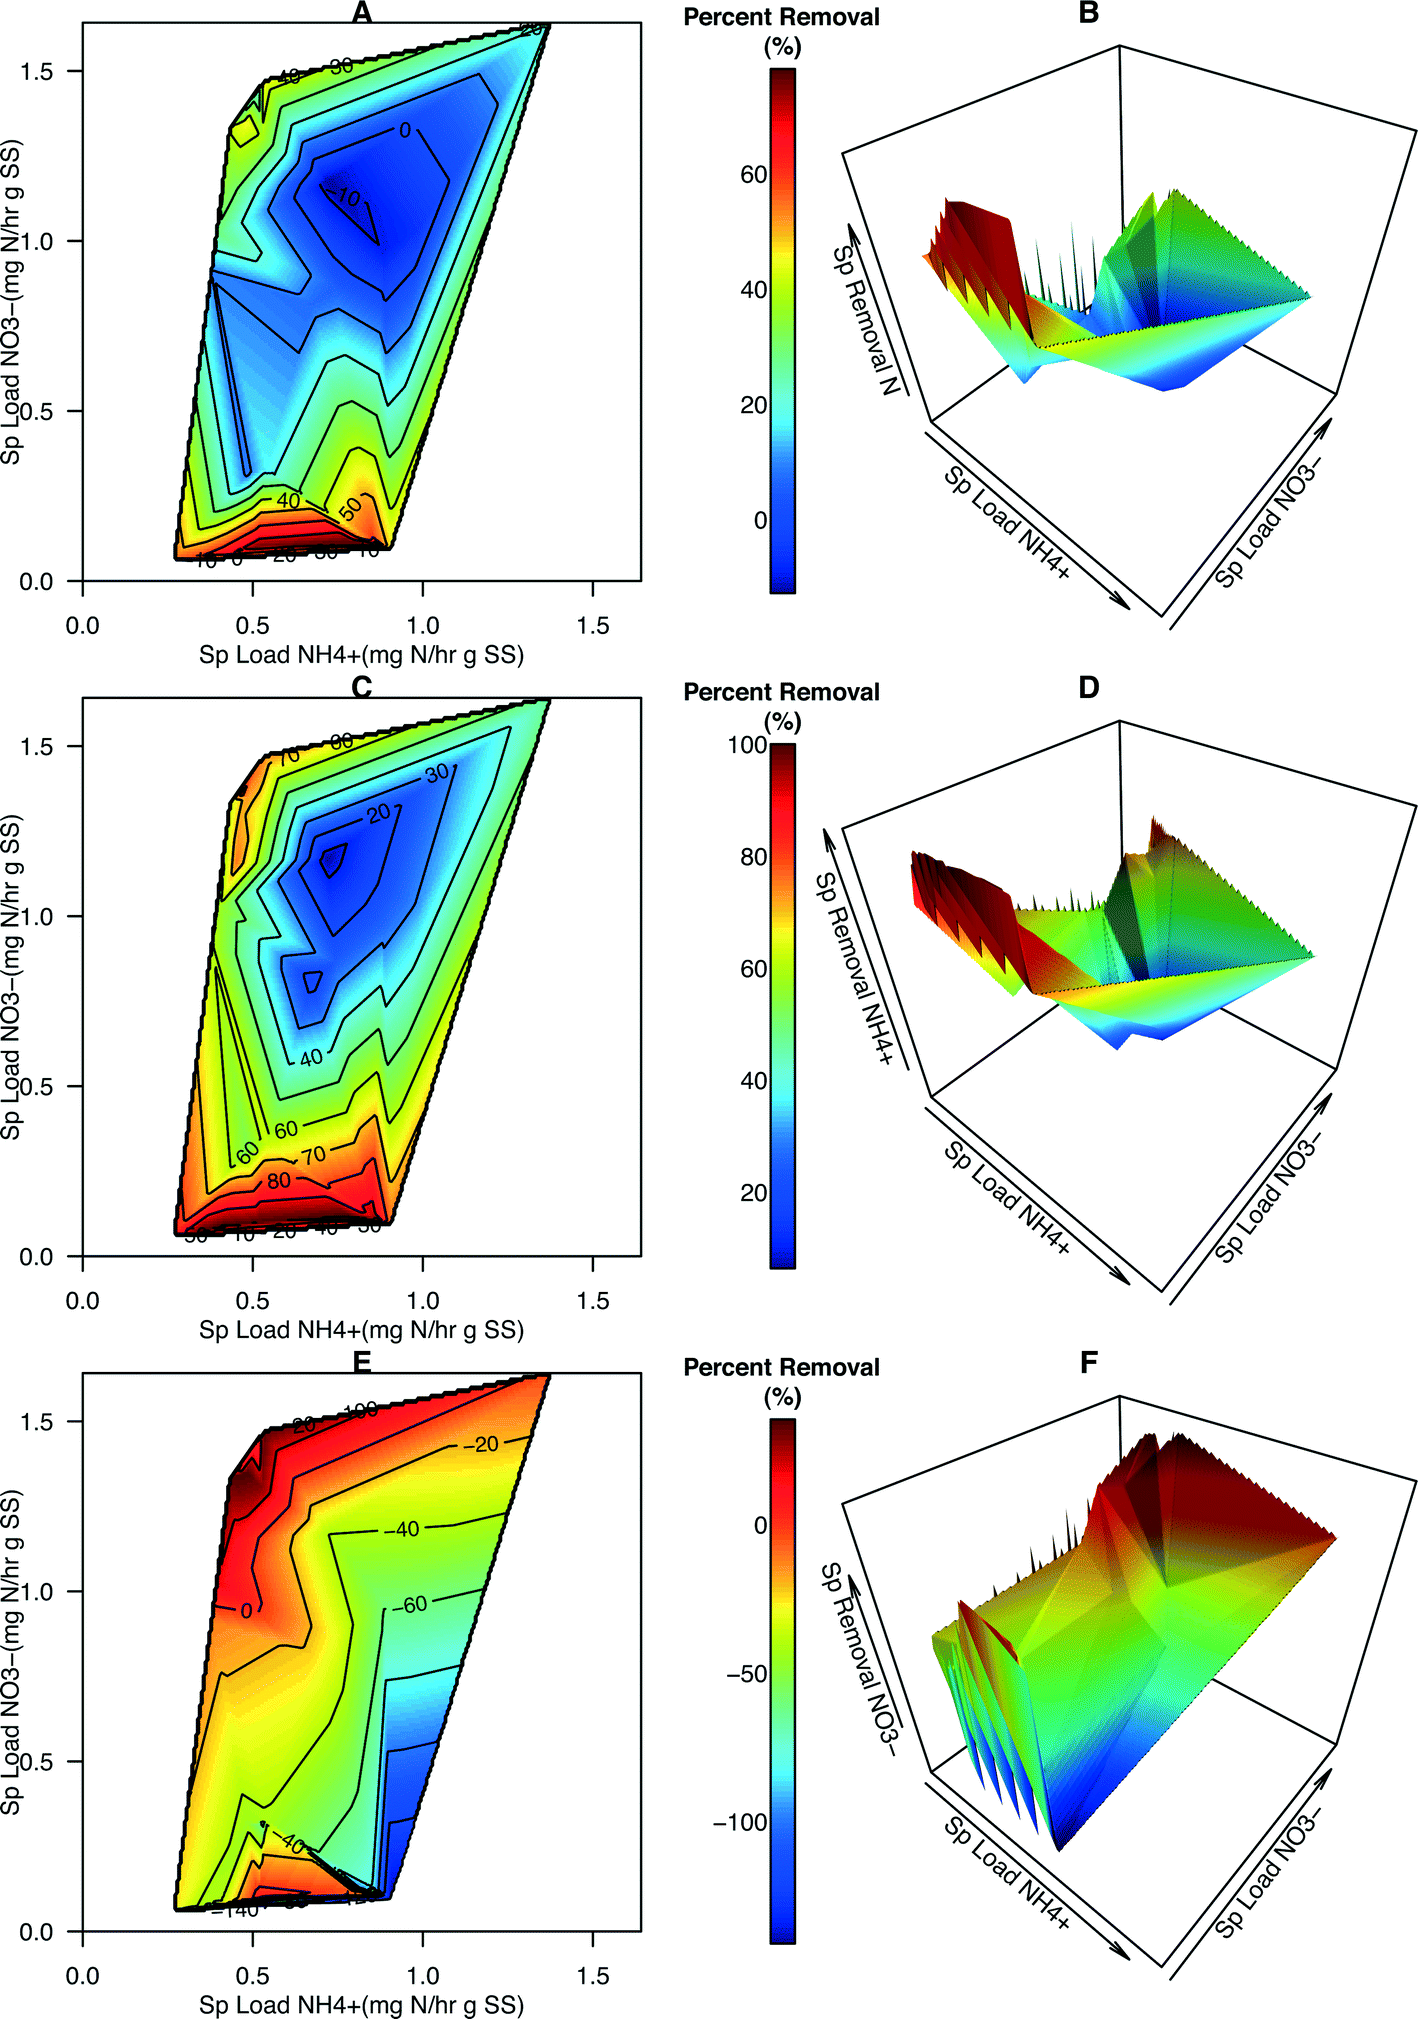 | ||
| Fig. 4 3-D visualization of percent removal of N species vs. N species loading rates. Contour maps and 3-D plots portraying the percent removal (%) of total N (A, B), NH4+ (C, D), and NO3− (E, F) in relation to the specific loading rates of NH4+ and NO3− (mg N h−1 g SS−1). The domain of the 3-d plots (A, C, E) is identical to that of the contour maps (B, D, F). The color scheme and contour lines are consistent within N species plots, but not between plots of different N species (i.e., paired panels (A and B, C and D, E and F) share a color gradient). | ||
Metagenomics and qPCR results
Metagenomic analysis was carried out on Conditions 3 and 5 (C3 and C5, respectively) in an attempt to characterize the microbial community and its functional capabilities. Although C3 did not pass the data validation steps for the kinetic analysis due to a gap in collection of biomass samples during this condition, we estimated its biomass via linearly interpolating between the nearest neighboring biomass observations, which ultimately led to an estimation of the specific loading rates for C3 (Fig. 3). Specifically, C3 was estimated to have a specific loading of 0.43 mg N h−1 g SS− for NO3− and 1.17 mg N h−1 g SS− for NH4+ (i.e., 0.43:1.17 NO3−:NH4+), while C5 had a specific loading of 1.35 mg N h−1 g SS− for NO3− and 0.48 mg N h−1 g SS− for NH4+ (i.e., 1.35:0.48 NO3−:NH4+) (Fig. 3, Table S1†).
Taxonomic annotations, in terms of relative abundance, for phototrophic bacteria, algae, and nitrifying bacteria for C3 and C5 were obtained from the MG-RAST server (Table S6†) which utilizes multiple databases to annotate both ribosomal and proteins.67 Alpha diversity estimates obtained through these annotations ranged from 350 to 395 distinct taxa, indicating that the communities display a surprising amount of diversity. The vast majority of annotated reads in MG-RAST were attributed to bacteria (96.7% for both metagenomes). This may be the result of bias towards bacterial sequences, which overwhelmingly populate existing genome repositories that MG-RAST utilizes. AOB and NOB comprise a small, but substantial portion of the bacterial population with a total of 3.93% and 4.64% of total annotations being attributed to nitrifying bacteria (Table S6†), strongly supporting conclusions drawn from the reactor kinetics regarding the presence and activity of these organisms. NOB belonging to the genus Nitrospina received no annotations, but all other geneses of nitrifying bacteria were found to be present. The genera of Chlamydomonas and Parachlorella were two of the top eukaryotic organisms to be annotated. Organisms belonging to both of these groups fall morphologically within the LRGT classification observed via microscopy. Cyanobacteria belonging to the genus Leptolyngbya were identified in a small portion of reads (Table S6†); the low abundance of Leptolyngbya sp. annotations could likely be the result of source reads being misannotated to other bacterial species.
In order to confirm that C. reinhardtii and P. kessleri were the dominant algae and to discover which cyanobacteria was dominant for C3 and C5, shotgun metagenomics Illumina sequencing reads were mapped onto all available complete, plastid genomes of algae and cyanobacteria, respectively. Using this approach, histograms of reads mapped to each genome by Bowtie2 were found to be highly right-skewed (Fig. S6†), with only a handful of genomes receiving any appreciable quantity of reads. A threshold of 5000 reads for algae and 400 for cyanobacteria, was arbitrarily selected and used to identify the genomes that represent the dominant algae and bacteria in the samples. Sample C3 had five algal genomes and one cyanobacterial genome that exceeded the threshold value while sample C5 contained 2 algae genomes and one cyanobacterial genome. Refer to Table S7† for the accession numbers of these organisms. Using percent of reads as a rough metric for relative abundance, C. reinhardtii and P. kessleri are the dominant algal species in the samples. Similarly, Leptolyngbya strain O-77 was identified as the most dominant cyanobacteria present in the sample. The relative abundance of algae obtained from MG-RAST indicate that C. reinhardtii is roughly 3 times more abundant than P. kessleri in C3 and this relationship inverts in C5 with P. kessleri outnumbering C. reinhardtii almost 3 to 1 (Table S6†). This trend is mirrored in the percent mapped reads results, with C3 having twice the abundance of C. reinhardtii in comparison with P. kessleri and C5 having zero reads annotated to C. reinhardtii (Table S7†). C. reinhardtii is capable of utilizing both NH4+ and NO3− as N sources.89,90 Similarly, P. kessleri can use NH4+,91 NO3−,92 and urea93 as nitrogen sources.
After identifying the dominant algal species in the HDBR in C3 and C5, qPCR was used to absolutely quantify the abundance of total bacteria and the microalgae species C. reinhardtii and P. kessleri across the other conditions (Table 1). Estimates of total bacteria were generally consistent across the conditions with the exception of Condition 9 (C9), which had less than half of the total bacteria present in C5, the second lowest bacterial count condition. C. reinhardtii was found to be less abundant than P. kessleri for all conditions and the abundance of both species decreased between C3 and C5, with C. reinhardtii having the more dramatic reduction in population (Table 1). The distribution between microalgae species within C3 appears to be highly deviant from the other 5 conditions with C. reinhardtii representing almost 30% of the algae population where, in other conditions, its abundance ranged between 1.8% and 8.1%. While the switch in algal species relative abundance between C3 and C5 observed from the metagenomics is not supported by the qPCR results, it does indicate that C. reinhardtii was much more abundant during C3 than the other tested conditions.
| Organism/target | Primer pair | Statistic | Influent condition | |||||
|---|---|---|---|---|---|---|---|---|
| 2 | 3 | 4 | 5 | 8 | 9 | |||
| Total bacteria | 16S | Avg | 7.95 × 10¹⁰ | 9.20 × 10¹⁰ | 8.60 × 10¹⁰ | 6.63 × 10¹⁰ | 1.14 × 10¹¹ | 3.06 × 10¹⁰ |
| 16S rDNA | SE | 1.02 × 10⁹ | 3.72 × 10⁹ | 2.41 × 10⁹ | 1.01 × 10⁹ | 2.08 × 10⁹ | 4.86 × 10⁸ | |
| C. reinhardtii | rbcL_cr | Avg | 4.76 × 10⁹ | 1.78 × 10¹⁰ | 1.33 × 10⁹ | 1.11 × 10⁹ | 6.04 × 10⁸ | 2.65 × 10⁹ |
| rbcL | SE | 1.82 × 10⁸ | 1.02 × 10⁹ | 3.94 × 10⁷ | 7.94 × 10⁶ | 2.55 × 10⁷ | 7.97 × 10⁷ | |
| P. kessleri | rbcl_pk | Avg | 5.72 × 10¹⁰ | 4.89 × 10¹⁰ | 3.29 × 10¹⁰ | 3.26 × 10¹⁰ | 5.05 × 10¹⁰ | 4.35 × 10¹⁰ |
| rbcL | SE | 2.05 × 10⁹ | 2.39 × 10⁹ | 1.20 × 10⁹ | 4.39 × 10⁸ | 6.68 × 10⁸ | 1.43 × 10⁹ | |
| Percent C. reinhardtii [%] | 8.1% | 29.9% | 3.2% | 1.8% | 3.7% | 5.3% | ||
| Percent P. kessleri rbcL [%] | 91.9% | 70.1% | 96.8% | 98.2% | 96.3% | 94.7% | ||
|
C. reinhardtii:P. kessleri [ratio] |
0.083 | 0.364 | 0.040 | 0.034 | 0.012 | 0.061 | ||
qPCR was also applied to investigate the distribution and relative abundance of nitrogen-altering bacteria to better grasp the variation in N species transformation and removal rates over the study's sample space (Fig. 5, Table S8†). The majority of N-transforming organisms and genes are covered by an array of primers assembled by Geets et al.45 C5 was selected as the baseline to compare the relative abundance of N-centric organisms and genes because it represented an extreme or boundary point in the 2-dimensional sampling domain, occurs at the maximal point of N removal, and was one of the conditions subjected to metagenomic analysis. Overall, a high degree of variation between conditions was observed in the relative abundance of total bacteria, algae species, and the N-centric genes that were tested (Fig. 5, Tables 1 and S8†). For all influent conditions, the relative abundance of nirK was not statistically distinct from C5 (Table S8†), most likely due to the variation in the CT values obtained during qPCR, although similar variability was observed for all samples (Table S8†). The relative abundance of nxrB in the sample for C3 was not significantly different from that in C5 (p = 0.497, Table S8†). The relative abundance of NSR within Condition 8 (C8) was determined to not be significantly different from C5 (p = 0.0564, Table S8†). All other combinations of conditions and target loci were found to be significantly different from C5.
 | ||
| Fig. 5 Barplot illustrating the relative abundance of N-centric genes from qPCR analysis. Condition 5 (green bars) was used as the baseline for relative abundance quantification. Error bars represent the standard error of measurements. A summary of the data is provided in tabular format in Table S8.† | ||
Linking kinetics with qPCR quantification of algae and N-centric bacteria
Other studies have demonstrated that a strong relationship exists between bacterial community structure and the function of anaerobic bioreactors94 and have utilized meta-omics data from a groundwater bioremediation process to show how environmental perturbations play a role in deterministic and stochastic changes in microbial communities.95 In this study, the availability of kinetic data of N removal and information on the microbial community structure and abundance of algae an N-centric bacteria provided an opportunity to link changes in environmental conditions due to alteration of operational parameters of the HDBR to changes in microbial community structure and activity to, finally, the performance of the HDBR. An analysis of the topography of specific total N removal rate on the 3D plots revealed three distinct regions of N removal (Fig. 2). The first (region 1) occurs at moderate NO3−:NH4+ loading ratios (0.1:0.75 NO3−:NH4+), specific total N removal is above 0.4 mg N h−1 g SS−1, specific removal of NH4+ is above 0.6 mg N h−1 g SS−1, and specific removal of NO3− ranges from −0.2 to −0.1 mg N h−1 g SS−1. The second optimal specific loading region (region 2) occurs when the specific loading ratio of NO3−:NH4+ is high (1.5:0.5 NO3−:NH4+). The third region of interest (region 3) is the zone of moderate total N removal (0.2 to 0.4 mg N h−1 g SS−1) and very low NO3− removal that occurred during C8 and appears to extend towards the region of maximum NH4+ and minimum NO3− loading.
Within region 1 (Condition 9, C9), the large specific removal of NH4+ demonstrates that nitrifying bacteria are able to convert a large portion of NH4+ to NO3−. The lower rate of NO3− accumulation, as compared to NH4+ removal (presumed to be mainly due to nitrification), indicates that the algae and other organisms present are capable of utilizing NO3−, either from the influent or produced via nitrification, as a nitrogen source for integrating N into biomass. Although NO3− accumulates at this moderate loading condition, NH4+ removal is high enough to achieve positive total N removal in the system.
Within region 2 (C5), specific removal of total N is above 0.6 mg N h−1 g SS−1, specific removal of NH4+ is within the range of 0.2–0.4 mg N h−1 g SS−1, and specific removal of NO3− is above 0.4 mg N h−1 g SS−1. The higher total N removal in region 2, where NO3− dominates the influent, as compared to the moderate loading condition, is due to the higher rates of NO3− removal. As bimolecular oxygen, O2, provided through both aeration in the HDBR's mixing vessel and from photosynthetic reactions, would inhibit denitrification reactions, positive NO3− specific removal in the reactor is hypothesized to be due to higher rates of NO3− assimilation by the photosynthetic community in this region. If it were assumed that the majority of NH4+ loss in both regions is due to nitrification, then in region 1 the loading of NO3− into the system due to nitrification and the influent would be 0.7 mg N h−1 g SS−1 (0.6 mg N h−1 g SS−1 from nitrification and 0.1 mg N h−1 g SS−1 from the influent). According to the rates of total N removal and accumulation of NO3− in region 1, the specific rate of NO3− assimilation by the photosynthetic community would be 0.5–0.6 mg N h−1 g SS−1. By making the same assumption for region 2, the rate of NO3− assimilation would be as high as 2.3 mg N h−1 g SS−1 – a nearly 4-fold increase in the rate of NO3− assimilation by the photosynthetic microbial community as compared to region 1. While the reasons for this large increase need to be investigated further, these higher assimilation rates could be attributed to the nature by which nitrogen assimilation pathways in the algae present are regulated. The levels of NH4+ are relatively low to NO3− concentrations in region 2 as compared to region 1, suggesting that the higher concentrations or ratios of NH4+ in region 1 could be inhibiting the rate of NO3− assimilation by the photosynthetic community.
In comparison with C5 (region 2), C9 (region 1) was found to have less nitrifying bacteria (in 4 of 5 cases), despite having a NH4+ loading roughly twice as large in magnitude; C9 also had more denitrifying bacteria (in 3 of 4 cases). The low abundance of nitrifiers and high abundance of denitrifiers could have been caused by a loss in biomass resulting from a change in influent conditions. In moving from influent Condition 8 to Condition 9, the specific loading rate of NO3− was lowered significantly, while NH4+ was only slightly increased (Fig. 3, Table S1†); the specific loading of total nitrogen was decreased approximately 75%. Over the course of 23 days, biomass within the reactor was observed to drop almost 60%, from 1.52 to 0.90 g total biomass. A significant increase in the suspended solid content of the effluent was observed, from an average of 0.10 g SS L−1 in C8 to an average of 0.25 g SS L−1 in C9 (determined via unpaired two-tailed t-test, p = 3.68 × 10⁻⁴). The increase in effluent suspended solids, the decrease in biomass, and the lowest absolute abundance of total bacteria (Table 1) indicate that cell death was occurring within the reactor during C9. The lysis of dead cells likely resulted in the release of ammonia, organic nitrogen, organic carbon, and other soluble microbial components, which, in effect, increases the NH4+ loading within the reactor (external to the reactor influent). Nitrifying bacteria consequently, may be depleting the dissolved oxygen (DO) content within the reactor fluid faster than its being replenished by photosynthetic action or from aeration within the mixing vessel. A combination of the readily available organic carbon and suppressed DO concentrations would select for heterotrophic microbes who are capable of carrying out denitrification resulting in the elevated denitrifiers abundance that we observe. In carbon-limiting conditions C. reinhardtii is capable of utilizing cellulose as a carbon source, while P. kessleri is not.96 The ability of C. reinhardtii to scavenge cellulose from its environment may partly explain why the abundance of C. reinhardtii was high in C9 when total bacteria abundance fell an order of magnitude and the abundance of P. kessleri decreased by 14% (Table 1).
Another interesting finding from the qPCR analysis (Fig. 5) is the fact that Condition 4 (C4) had a higher abundance of all 9 N-centric genes when compared to C5 even though they had similar specific loading rates of NH4+ (Fig. 3). The higher abundance of nitrifying organisms (primers CTO, amoA, FGPS, NxrB, and NSR) in C4 indicate that NO3− removal should be lower in this condition, which the kinetics results confirm: NO3− removal of C4 was in the range of −0.2 to −0.1 while C5 was in the range of 0.4 to 0.5 (Fig. 2E). Furthermore, the specific removal rate of NH4+ was comparable between C4 and C5 (Fig. 2C). Assuming that the rate of denitrification between C4 and C5, was roughly equal, the surplus of total N removal in C5 (Fig. 2A) illustrates that NO3− is being integrated into cellular material at a much higher rate in C5. This trend becomes even more dramatic when we take the higher abundance of denitrifying genes (nirK, nirS, nor, and nosZ) in C4 into account.
Within region 3 (C8), moderate loading of NH4+ and NO3− was hypothesized to provide an abundance of substrate for nitrifying bacteria but lacks a surplus of NO3− for uptake by algae, limiting total N removal. This region, and its extension towards the region of highest specific total N removal rate, is roughly parallel to a specific total N loading rate of approximately 1.4 mg h−1 g SS−1. In comparison with C5, the higher abundance of NOB (relative abundance FGPS = 2.23, NxrB = 1.66, NSR = 1.17, Table S8†) and nitrate-reductase possessing organisms (relative abundance nirK = 1.70, nirS = 1.41, Table S8†) in C8 accounts for the high accumulation of NO3− in this region (Fig. 2E). When these two groups of organisms are highly abundant and active, N is cycled quickly between NO2− and NO3− to support the electron transport chain of both groups without being integrated into cellular mass or full reduction to N2. The activity of AOB will still carry out ammonia oxidation (Fig. 2C and 3C) and thus the pool of available NOx− species will experience accumulation. The combined actions of AOB, NOB, and nitrate-reducers result in a region of the highest nitrification and least total N removal (Fig. 2A and 4A).
Conclusion
This study entailed the characterization of reactor kinetics and microbial population in response to different N loading conditions. On average, 35.5% of total nitrogen was removed from the reactor influent, but the total removal and removal rates of NH4+, and NO3− varies significantly over the sampled loading conditions. The connected nature between reduced and oxidized N species means that single-variate regression, while straightforward to apply, obscures experimental signal and ignores the covariation and feedback that may be present within the system. Additionally, the presence of many possible transformational paths convolutes the interpretation of kinetic data. In the absence of empirical or theoretical models, 3-D visualization improved our ability to interpret the kinetics of the complex biological system involved in N metabolism in photosynthetic HDBR, especially with added information of the microbial community through molecular methods.The inclusion of methods from the molecular ecology toolbox including metagenomic sequencing and analysis and real-time PCR enabled the identification and enumeration of the major players in N transformation and uptake within the microbial community. AOB and NOB were found to comprise a significant portion of the microbial population that changes in response to NH4+ and NO3− loading. C. reinhardtii, P. kessleri, and Leptolyngbya sp. were identified as the major photosynthetic organisms, and, as with AOB and NOB, their population was observed to be dynamic and responsive to reactor conditions. These results, all together, demonstrate that the performance of bioreactors relies not only on understanding the metabolic functions and capabilities of the organisms within the reactor, but also microbial community interactions and how the community changes in response to reactor conditions. Further, advancements in meta-omics methods, such as metagenomics and metatranscriptomics, to the study of bioreactors will be important to investigating microbial ecological interactions that play a role in the performance of engineered and natural biological processes.97–99
Acknowledgements
The authors would like to acknowledge Thomas J. Thompson at Drexel University for his assistance in copy editing this manuscript, Aspen Walker at the University of Pennsylvania for her assistance in reactor maintenance and sample collection, Rick McCourt and Alison Minerovic at the Academy of Natural Sciences of Drexel University for their assistance with DIC microscopy and provincial organism identification, and Marina Potapova and Nina Desianti at Drexel University for providing resources and assistance with the scanning electron microscope. This work used the Vincent J. Coates Genomics Sequencing Laboratory at UC Berkeley, supported by NIH S10 Instrumentation Grants S10RR029668 and S10RR027303. The authors would like to acknowledge their use of the Drexel University Research Computing Facility. This work was supported under NSF grant number 1245632. The authors thank the editor and anonymous reviewers for their comments and feedback.Notes and references
- G. F. Lee, W. Rast and R. A. Jones, Environ. Sci. Technol., 1978, 12, 900–908 CrossRef.
- V. H. Smith, G. D. Tilman and J. C. Nekola, Environ. Pollut., 1999, 100, 179–196 CrossRef CAS PubMed.
- F. A. Khan and A. A. Ansari, Bot. Rev., 2005, 71, 449–482 CrossRef.
- E. O. Igbinosa and A. I. Okoh, Int. J. Environ. Sci. Technol., 2009, 6, 175–182 CrossRef CAS.
- H. Gao, Y. D. Scherson and G. F. Wells, Environ. Sci.: Processes Impacts, 2014, 16, 1223–1246 CAS.
- Z. Bradford-Hartke, J. Lane, P. Lant and G. Leslie, Environ. Sci. Technol., 2015, 49, 8611–8622 CrossRef CAS PubMed.
- C. M. Sales and P. K. Lee, Curr. Opin. Biotechnol., 2015, 33, 260–267 CrossRef CAS PubMed.
- M. A. Aziz and W. J. Ng, Bioresour. Technol., 1992, 40, 205–208 CrossRef CAS.
- M. E. Martınez, S. Sánchez, J. M. Jiménez, F. El Yousfi and L. Muñoz, Bioresour. Technol., 2000, 73, 263–272 CrossRef.
- J. Park, H. F. Jin, B. R. Lim, K. Y. Park and K. Lee, Bioresour. Technol., 2010, 101, 8649–8657 CrossRef CAS PubMed.
- L. Christenson and R. Sims, Biotechnol. Adv., 2011, 29, 686–702 CrossRef CAS PubMed.
- N. Abdel-Raouf, A. A. Al-Homaidan and I. B. Ibraheem, Saudi J. Biol. Sci., 2012, 19, 257–275 CrossRef CAS PubMed.
- M. K. Ji, R. A. I. Abou-Shanab, J. H. Hwang, T. C. Timmes, H. C. Kim, Y. K. Oh and B. H. Jeon, J. Environ. Eng., 2013, 139, 1198–1205 CrossRef CAS.
- J. B. Park, R. J. Craggs and A. N. Shilton, Water Res., 2013, 47, 4422–4432 CrossRef CAS PubMed.
- E. A. Ramos Tercero, E. Sforza, M. Morandini and A. Bertucco, Appl. Biochem. Biotechnol., 2014, 172, 1470–1485 CrossRef CAS PubMed.
- B. S. M. Sturm, E. Peltier, V. Smith and F. deNoyelles, Environ. Prog. Sustainable Energy, 2012, 31, 10–16 CrossRef CAS.
- L. Brennan and P. Owende, Renewable Sustainable Energy Rev., 2010, 14, 557–577 CrossRef CAS.
- F. M. I. Natrah, P. Bossier, P. Sorgeloos, F. M. Yusoff and T. Defoirdt, Rev. Aquac., 2014, 6, 48–61 CrossRef.
- P. B. Bradley, M. P. Sanderson, M. E. Frischer, J. Brofft, M. G. Booth, L. J. Kerkhof and D. A. Bronk, Estuarine, Coastal Shelf Sci., 2010, 88, 429–441 CrossRef CAS.
- J. M. Ebeling, M. B. Timmons and J. J. Bisogni, Aquaculture, 2006, 257, 346–358 CrossRef.
- B. Veuger, J. J. Middelburg, H. T. S. Boschker, J. Nieuwenhuize, P. van Rijswijk, E. J. Rochelle-Newall and N. Navarro, Estuarine, Coastal Shelf Sci., 2004, 61, 507–515 CrossRef CAS.
- T. Danhorn and C. Fuqua, Annu. Rev. Microbiol., 2007, 61, 401–422 CrossRef CAS PubMed.
- J. J. Cole, Annu. Rev. Ecol. Syst., 1982, 13, 291–314 CrossRef.
- M. Sapp, A. S. Schwaderer, K. H. Wiltshire, H. G. Hoppe, G. Gerdts and A. Wichels, Microb. Ecol., 2007, 53, 683–699 CrossRef PubMed.
- K. Kogure, U. Simidu and N. Taga, J. Exp. Mar. Biol. Ecol., 1979, 36, 201–215 CrossRef.
- L. Verschuere, G. Rombaut, P. Sorgeloos and W. Verstraete, Microbiol. Mol. Biol. Rev., 2000, 64, 655–671 CrossRef CAS PubMed.
- C. E. Riquelme and Y. Ishida, J. Gen. Appl. Microbiol., 1988, 34, 417–423 CrossRef CAS.
- H. W. Paerl and J. L. Pinckney, Microb. Ecol., 1996, 31, 225–247 CrossRef PubMed.
- E. Kazamia, H. Czesnick, T. T. Nguyen, M. T. Croft, E. Sherwood, S. Sasso, S. J. Hodson, M. J. Warren and A. G. Smith, Environ. Microbiol., 2012, 14, 1466–1476 CrossRef CAS PubMed.
- B. Xie, S. Bishop, D. Stessman, D. Wright, M. H. Spalding and L. J. Halverson, ISME J., 2013, 7, 1544–1555 CrossRef CAS PubMed.
- R. Pratt, T. C. Daniels, J. J. Eiler, J. B. Gunnison, W. D. Kumler, J. F. Oneto, L. A. Strait, H. A. Spoehr, G. J. Hardin, H. W. Milner, J. H. Smith and H. H. Strain, Science, 1944, 99, 351–352 CAS.
- M. Teplitski, H. Chen, S. Rajamani, M. Gao, M. Merighi, R. T. Sayre, J. B. Robinson, B. G. Rolfe and W. D. Bauer, Plant Physiol., 2004, 134, 137–146 CrossRef CAS PubMed.
- X. Mayali and F. Azam, J. Eukaryotic Microbiol., 2004, 51, 139–144 CrossRef.
- X. Bai, P. Lant and S. Pratt, Biotechnol. Bioeng., 2015, 112, 688–695 CrossRef CAS PubMed.
- S. R. Medipally, F. M. Yusoff, S. Banerjee and M. Shariff, BioMed Res. Int., 2015, 2015, 519513 Search PubMed.
- M. O. Rivas, P. Vargas and C. E. Riquelme, Microb. Ecol., 2010, 60, 628–635 CrossRef CAS PubMed.
- Y. Tanabe, S. Kato, H. Matsuura and M. M. Watanabe, Procedia Environ. Sci., 2012, 15, 22–26 CrossRef CAS.
- A. Kouzuma and K. Watanabe, Curr. Opin. Biotechnol., 2015, 33C, 125–129 CrossRef PubMed.
- D. R. Johnson, D. E. Helbling, Y. Men and K. Fenner, Environ. Sci.: Water Res. Technol., 2015, 1, 272–278 CAS.
- A. Hermansson and P. E. Lindgren, Appl. Environ. Microbiol., 2001, 67, 972–976 CrossRef CAS PubMed.
- S. Henry, E. Baudoin, J. C. Lopez-Gutierrez, F. Martin-Laurent, A. Brauman and L. Philippot, J. Microbiol. Methods, 2004, 59, 327–335 CrossRef CAS PubMed.
- Y. Okano, K. R. Hristova, C. M. Leutenegger, L. E. Jackson, R. F. Denison, B. Gebreyesus, D. Lebauer and K. M. Scow, Appl. Environ. Microbiol., 2004, 70, 1008–1016 CrossRef CAS PubMed.
- G. Harms, A. C. Layton, H. M. Dionisi, I. R. Gregory, V. M. Garrett, S. A. Hawkins, K. G. Robinson and G. S. Sayler, Environ. Sci. Technol., 2003, 37, 343–351 CrossRef CAS PubMed.
- T. Limpiyakorn, Y. Shinohara, F. Kurisu and O. Yagi, FEMS Microbiol. Ecol., 2005, 54, 205–217 CrossRef CAS PubMed.
- J. Geets, M. de Cooman, L. Wittebolle, K. Heylen, B. Vanparys, P. De Vos, W. Verstraete and N. Boon, Appl. Microbiol. Biotechnol., 2007, 75, 211–221 CrossRef CAS PubMed.
- E. L. Figuerola and L. Erijman, J. Hazard. Mater., 2010, 181, 281–288 CrossRef CAS PubMed.
- Y. M. Kim, H. U. Cho, D. S. Lee, D. Park and J. M. Park, Water Res., 2011, 45, 5785–5795 CrossRef CAS PubMed.
- M. K. Winkler, J. P. Bassin, R. Kleerebezem, D. Y. Sorokin and M. C. van Loosdrecht, Appl. Microbiol. Biotechnol., 2012, 94, 1657–1666 CrossRef CAS PubMed.
- C. Gomez-Silvan, R. Vilchez-Vargas, J. Arevalo, M. A. Gomez, J. Gonzalez-Lopez, D. H. Pieper and B. Rodelas, Bioresour. Technol., 2014, 169, 126–133 CrossRef CAS PubMed.
- E. Q. Zhi, Y. H. Song, L. Duan, H. B. Yu and J. F. Peng, Environ. Earth Sci., 2015, 73, 5085–5094 CrossRef.
- D. W. Graham, C. W. Knapp, E. S. Van Vleck, K. Bloor, T. B. Lane and C. E. Graham, ISME J., 2007, 1, 385–393 CrossRef CAS PubMed.
- M. Bellucci, I. D. Ofiteru, I. M. Head, T. P. Curtis and D. W. Graham, J. Appl. Microbiol., 2013, 115, 621–630 CrossRef CAS PubMed.
- I. Krohn-Molt, B. Wemheuer, M. Alawi, A. Poehlein, S. Gullert, C. Schmeisser, A. Pommerening-Roser, A. Grundhoff, R. Daniel, D. Hanelt and W. R. Streit, Appl. Environ. Microbiol., 2013, 79, 6196–6206 CrossRef CAS PubMed.
- C. M. Sales and W. K. Shieh, Water Res., 2006, 40, 1442–1448 CrossRef CAS PubMed.
- K. Nootong and W. K. Shieh, Bioresour. Technol., 2008, 99, 6292–6298 CrossRef CAS PubMed.
- G. Ramanathan, C. M. Sales and W. K. Shieh, Water Sci. Technol., 2014, 70, 729–735 CrossRef CAS PubMed.
- J. R. Price, W. K. Shieh and C. M. Sales, J. Visualized Exp., 2015, e53443, DOI:10.3791/53443.
- D. Tilman, Am Nat, 1980, 116, 362–393 CrossRef.
- D. Tilman, Ecology, 1981, 62, 802 CrossRef.
- D. Tilman, S. S. Kilham and P. Kilham, Annu. Rev. Ecol. Syst., 1982, 13, 349–372 CrossRef.
- R Core Team, R: A Language and Environment for Statistical Computing, R Foundation for Statistical Computing, Vienna, Austria, 2015, https://www.R-project.org/ Search PubMed.
- J. M. Chambers, W. S. Cleveland, B. Kleiner and P. A. Tukey, Graphical methods for data analysis, Wadsworth & Brooks/Cole, Boston, MA, 1983 Search PubMed.
- R. A. Becker, J. M. Chambers and A. R. Wilks, The new S language: a programming environment for data analysis and graphics, Wadsworth and Brooks/Cole Advanced Books & Software, Monterey, CA, 1988 Search PubMed.
- P. Murrell, R Graphics, Chapman and Hall/CRC, Boca Raton, FL, 2005 Search PubMed.
- G. N. Wilkinson and C. E. Rogers, Applied Statistics, 1973, vol. 22, pp. 392–399 Search PubMed.
- J. M. Chambers, in Statistical Models in S, ed. J. M. Chambers and T. J. Hastie, Wadsworth & Brooks/Cole, Pacific Grove, CA, 1992, ch. 4 Search PubMed.
- F. Meyer, D. Paarmann, M. D'Souza, R. Olson, E. M. Glass, M. Kubal, T. Paczian, A. Rodriguez, R. Stevens, A. Wilke, J. Wilkening and R. A. Edwards, BMC Bioinf., 2008, 9, 386 CrossRef CAS PubMed.
- V. Gomez-Alvarez, T. K. Teal and T. M. Schmidt, ISME J., 2009, 3, 1314–1317 CrossRef PubMed.
- B. Langmead, C. Trapnell, M. Pop and S. L. Salzberg, Genome Biol., 2009, 10, R25 CrossRef PubMed.
- M. P. Cox, D. A. Peterson and P. J. Biggs, BMC Bioinf., 2010, 11, 485 CrossRef PubMed.
- A. Wilke, E. M. Glass, J. Bischof, D. Braithwaite, M. D'Souza, W. Gerlach, T. Harrison, K. Keegan, H. Matthews, T. Paczian, W. Tang, W. L. Trimble, N. Desai and F. Meyer, MG-RAST Manual for version 3.3.6, revision 9, Argonne National Laboratory, University of Chicago, 2014, ftp://ftp.metagenomics.anl.gov/data/manual/mg-rast-manual.pdf Search PubMed.
- G. A. Kowalchuk, J. R. Stephen and D. W. Boer, Appl. Environ. Microbiol., 1997, 63, 1489–1497 CAS.
- J. H. Rotthauwe, K. P. Witzel and W. Liesack, Appl. Environ. Microbiol., 1997, 63, 4704–4712 CAS.
- V. Degrange and R. Bardin, Appl. Environ. Microbiol., 1995, 61, 2093–2098 CAS.
- B. Vanparys, P. Bodelier and P. De Vos, Curr. Microbiol., 2006, 53, 255–257 CrossRef CAS PubMed.
- H. M. Dionisi, A. C. Layton, G. Harms, I. R. Gregory, K. G. Robinson and G. S. Sayler, Appl. Environ. Microbiol., 2002, 68, 245–253 CrossRef CAS PubMed.
- G. Braker, A. Fesefeldt and K. P. Witzel, Appl. Environ. Microbiol., 1998, 64, 3769–3775 CAS.
- I. N. Throback, K. Enwall, A. Jarvis and S. Hallin, FEMS Microbiol. Ecol., 2004, 49, 401–417 CrossRef CAS PubMed.
- G. Braker and J. M. Tiedje, Appl. Environ. Microbiol., 2003, 69, 3476–3483 CrossRef CAS PubMed.
- K. Kloos, A. Mergel, C. Rosch and H. Bothe, Aust. J. Plant Physiol., 2001, 28, 991–998 Search PubMed.
- B. Langmead and S. L. Salzberg, Nat. Methods, 2012, 9, 357–359 CrossRef CAS PubMed.
- H. Li, B. Handsaker, A. Wysoker, T. Fennell, J. Ruan, N. Homer, G. Marth, G. Abecasis, R. Durbin and 1000 Genome Project Data Processing Subgroup, Bioinformatics, 2009, 25, 2078–2079 CrossRef CAS PubMed.
- A. R. Quinlan and I. M. Hall, Bioinformatics, 2010, 26, 841–842 CrossRef CAS PubMed.
- S. F. Altschul, W. Gish, W. Miller, E. W. Myers and D. J. Lipman, J. Mol. Biol., 1990, 215, 403–410 CrossRef CAS PubMed.
- J. Ye, G. Coulouris, I. Zaretskaya, I. Cutcutache, S. Rozen and T. L. Madden, BMC Bioinf., 2012, 13, 134 CrossRef CAS PubMed.
- D. R. Smith and R. W. Lee, BMC Evol. Biol., 2009, 9, 120 CrossRef PubMed.
- M. Turmel, C. Otis and C. Lemieux, Mol. Biol. Evol., 2009, 26, 2317–2331 CrossRef CAS PubMed.
- K. J. Livak and T. D. Schmittgen, Methods, 2001, 25, 402–408 CrossRef CAS PubMed.
- S. Gerin, G. Mathy, A. Blomme, F. Franck and F. E. Sluse, Biochim. Biophys. Acta, 2010, 1797, 994–1003 CrossRef CAS PubMed.
- E. Sanz-Luque, A. Chamizo-Ampudia, A. Llamas, A. Galvan and E. Fernandez, Front. Plant Sci., 2015, 6, 899 Search PubMed.
- B. Fernandes, J. Teixeira, G. Dragone, A. A. Vicente, S. Kawano, K. Bisova, P. Pribyl, V. Zachleder and M. Vitova, Bioresour. Technol., 2013, 144, 268–274 CrossRef CAS PubMed.
- Y. Wang, T. Chen and S. Qin, Biomass Bioenergy, 2012, 47, 402–409 CrossRef CAS.
- X. Li, P. Pribyl, K. Bisova, S. Kawano, V. Cepak, V. Zachleder, M. Cizkova, I. Branyikova and M. Vitova, Biotechnol. Bioeng., 2013, 110, 97–107 CrossRef CAS PubMed.
- J. J. Werner, D. Knights, M. L. Garcia, N. B. Scalfone, S. Smith, K. Yarasheski, T. A. Cummings, A. R. Beers, R. Knight and L. T. Angenent, Proc. Natl. Acad. Sci. U. S. A., 2011, 108, 4158–4163 CrossRef CAS PubMed.
- J. Zhou, Y. Deng, P. Zhang, K. Xue, Y. Liang, J. D. Van Nostrand, Y. Yang, Z. He, L. Wu, D. A. Stahl, T. C. Hazen, J. M. Tiedje and A. P. Arkin, Proc. Natl. Acad. Sci. U. S. A., 2014, 111, E836–845 CrossRef CAS PubMed.
- O. Blifernez-Klassen, V. Klassen, A. Doebbe, K. Kersting, P. Grimm, L. Wobbe and O. Kruse, Nat. Commun., 2012, 3, 1214 CrossRef PubMed.
- C. Simon and R. Daniel, Appl. Environ. Microbiol., 2011, 77, 1153–1161 CrossRef CAS PubMed.
- T. J. Sharpton, Front. Plant Sci., 2014, 5, 209 Search PubMed.
- L. E. Graham, L. W. Wilcox and J. J. Knack, J. Phycol., 2015, 51, 1029–1036 CrossRef PubMed.
Footnote |
| † Electronic supplementary information (ESI) available. See DOI: 10.1039/c6ew00078a |
| This journal is © The Royal Society of Chemistry 2016 |