
Nitrite accumulation in a denitrifying biocathode microbial fuel cell†
Varun
Srinivasan
,
Jacob
Weinrich
and
Caitlyn
Butler
*
Department of Civil and Environmental Engineering, University of Massachusetts-Amherst, 18 Marston Hall, 130 Natural Resources Road, Amherst, MA 01003, USA. E-mail: cbutler@engin.umass.edu; Tel: (413)545 5396
First published on 11th January 2016
Abstract
Microbial fuel cells (MFCs) are a potential treatment technology-energy requirements for treatment can be offset with electricity production, biomass yield can be minimized, and microbial electron donors can be decoupled from acceptors, expanding treatment options. One potential MFC configuration uses an organic-oxidizing anode biofilm and a denitrifying cathode biofilm. However nitrite, a denitrification intermediate with environmental and public health impacts, has been reported to accumulate. In this study, before complete denitrification was achieved in a bench-scale, batch denitrifying cathode, nitrite concentrations reached 66.4 ± 7.5% of the initial nitrogen. Common environmental inhibitors such as insufficient electron donor, dissolved oxygen, insufficient carbon source, and pH, were considered. Improvement in these conditions did not mitigate nitrite accumulation. We present an Activated Sludge Model with an integration of the Nernst–Monod model and Indirect Coupling of Electrons (ASM–NICE) that effectively simulated the observed batch data, including nitrite-accumulation by coupling biocathodic electron transfer to intracellular electron mediators. The simulated half-saturation constants for mediated intracellular transfer of electrons during nitrate and nitrite reduction suggested a greater affinity for nitrate reduction when electrons are not limiting. The results imply that longer hydraulic retention times (HRTs) may be necessary for a denitrifying biocathode to ensure complete denitrification. These findings could play a role in designing full-scale MFC wastewater treatment systems to maximize total nitrogen removal.
Water impactOrganics-oxidizing microbial fuel cells (MFCs) with a denitrifying cathode are a potential wastewater treatment technology that could offset energy requirements and minimize biomass yield. To improve the efficacy of this approach, we investigated the accumulation of nitrite during denitrification and modeled biocathodic denitrification processes using an Activated Sludge Model with an integration of the Nernst–Monod model and Indirect Coupling of Electrons (ASM–NICE). |
Introduction
Microbial fuel cells (MFC) have emerged as a potentially energy-efficient treatment strategy with promising applications in wastewater,1–4in situ environmental remediation5–7 and decentralized treatment systems.8 A particular advantage of MFC application as a treatment strategy is the ability to decouple the electron donor from the electron acceptor in biological reactions, allowing the oxidation of natural or wastewater organics to facilitate the reduction of an oxidized contaminant at the cathode. A variety of oxidized contaminants have been reduced in this way including nitrate, perchlorate, uranium, trichloroethane and dichromate.5,7,9–13 Additionally, the electrons passed across an external load between the anode and cathode can offset energy requirements for treatment.Nitrate is a contaminant of interest for drinking water systems with a minimum contaminant level (MCL) of 10 mg NO3–N L−1 in the United States.14 Nitrate has also been regulated in wastewater effluents through total nitrogen discharge limits in an effort to curb eutrophication of surface waters and other environmental impacts. Biological nitrification–denitrification is one of the most common processes used for total nitrogen removal from wastewater.15 Nitrifying bacteria oxidize ammonia to nitrite and, then, nitrite to nitrate. Biological denitrification reduces nitrate to nitrogen gas. Denitrification is a dissimilatory microbiological process, which many heterotrophic and autotrophic organisms are capable of performing. It is a sequential reaction involving the reduction of nitrate to nitrite by a nitrate reductase enzyme. Nitrite is reduced to nitric oxide by a nitrite reductase enzyme. Nitric oxide is reduced to nitrous oxide by a nitric oxide reductase enzyme after which nitrous oxide is reduced to nitrogen gas by a nitrous oxide reductase.16
Though several studies have reported significant denitrification in microbial fuel cells,10,11,17 some studies have reported accumulation of nitrite of up to 50–55% of the initial total nitrogen during autotrophic denitrification in cathodes18,19 and accumulation of nitrous oxide of up to 70% of the initial total nitrogen added as nitrate.20 Minimizing the accumulation of intermediates is critical to achieving maximum nitrogen removal. Denitrification intermediates have negative health and environmental effects. Nitrite can cause methemoglobinemia in aquatic life, small children and the elderly21,22 and nitrous oxide is a potent greenhouse gas.23
The accumulation of denitrification intermediates can occur due to differing metabolic rates of the denitrification steps. Additionally, several environmental factors could contribute to this accumulation. Denitrification enzyme production is repressed at DO concentrations above 2.5 mg-O2 L−1.16,24 Incomplete denitrification can be due to limiting electron donor concentrations.16 Inhibition of denitrification can occur outside the pH range of 7 to 8 leading to an accumulation of intermediates. pH below 7 can cause direct inhibition through the formation of free nitrous acid which is a protonated form of nitrite.25 A pH above 8 can cause inhibition of general microbiological processes.
Mathematical modeling has played a very critical role in predicting nitrogen removal in wastewater treatment. The modeling of accumulation of intermediates has been achieved by modeling denitrification as a four-step denitrification process, using reaction-specific kinetic rate equations for each step. Broadly, two major models have been proposed in recent years: the “direct-coupling” approach used in Activated Sludge Model for Nitrogen (ASMN)26 and the “indirect-coupling” approach used in the Activated Sludge Model for Indirect Coupling of Electrons (ASM–ICE).27 The ASMN model directly couples the carbon oxidation with each of the nitrogen oxide reduction steps. The ASM–ICE model indirectly couples carbon oxidation and nitrogen oxide reduction using intermediate electron carriers. A comparison of these models in predicting accumulation of nitrogen intermediates was made by Pan et al.,28 concluding that the ASM–ICE model predicts the accumulation of nitrogen oxides better than the ASMN model.
The ASM–ICE model was formulated, assuming a dissolved carbon/electron source and using the dual-substrate limitation kinetics derived from the Monod model. The Monod model works well for dissolved substrates but in a denitrifying biocathode, the biofilm is limited by a solid electron donor. In this case, the ability of the cathode electrode to act as an electron donor is determined by the cathode potential according to the following equation, which has been adapted from a model prepared for a MFC anode by Marcus et al.29
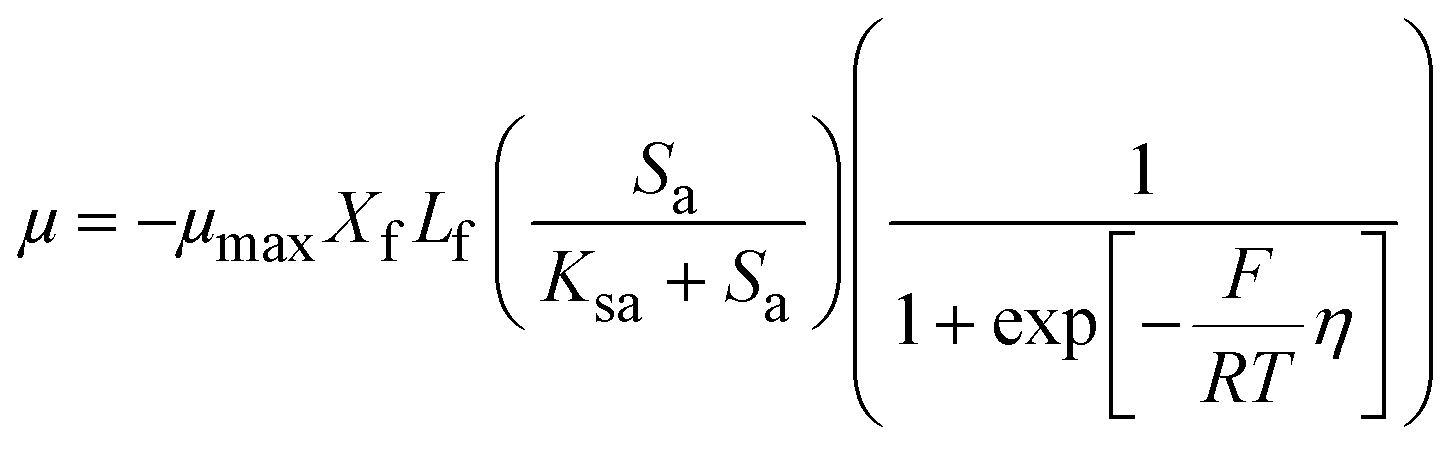 | (1) |
Though complete denitrification has been demonstrated in MFCs using a cathode as an electron donor for autotrophic denitrification, more research is needed to understand the conditions that facilitate incomplete denitrification and the accumulation of intermediates. Additionally, the Monod kinetic parameters, that are crucial to the design of treatment processes, have not been determined for autotrophic denitrification in a MFC cathode. In this study, we investigated the mechanisms behind the accumulation of nitrite by performing experiments under different environmental conditions. We present an ASM with an integration of the Nernst–Monod model and Indirect Coupling of Electrons (ASM–NICE), for the simulation of nitrogen removal in a denitrifying biocathode. We used this model to estimate kinetic parameters for a denitrifying biocathode.
Materials and methods
MFC configuration and operation
Duplicate flat-plate MFCs were constructed from rectangular Plexiglas frames (10 × 10 × 1.2 cm) and filled with graphite granules (porosity = 0.55). The total volume and liquid volume of the electrode compartments were 120 mL and 54 mL respectively. Graphite rods were inserted into the anode and cathode chambers to act as electron collectors. The compartments were separated by a cation exchange membrane (CMI-7000, Membrane International, Glen Rock, NJ) which was activated using a 5% NaCl solution at 40 °C for 24 hours. Ag/AgCl reference electrodes (RE-6, BASi Inc. USA) were used to monitor the cathode potentials.The MFC anodes were inoculated with a combination of anode effluent from a parent MFC (that was constructed and operated similarly to the experimental MFCs) and primary effluent from the Amherst Wastewater Treatment Plant (WWTP), Amherst, MA. The cathodes were inoculated with a combination of cathode effluent from the denitrifying biocathode of the parent MFC, primary effluent from the Amherst WWTP and a pond sediment inoculum from the Campus Pond, University of Massachusetts-Amherst, MA. The reactors were initially operated in batch mode where the effluent of each electrode compartment was returned to the influent to allow the accumulation of biofilms on the anode and cathode. The end of a batch cycle was indicated by the voltage decreasing to less than 0.05 V measured across the anode and cathode. After 50 batch cycles, the anode chamber was switched to a continuous flow mode. The anode was operated in continuous flow to prevent electron donor limiting conditions from the anode. The feed for the anode was supplied at a flow rate of 0.25 mL min−1 (hydraulic retention time = 20.5 hours) resulting in a COD loading rate of 154 mg COD L−1 per day. The anode media during the course of experiments, unless otherwise stated, consisted of (per liter) 1.386 g Na2HPO4, 0.849 g KH2PO4, 0.05 g NH4Cl, 0.05 g MgCl2, and 0.710 g CH3COOK (0.355 g COD). The cathode remained in batch operation during all experiments. In this configuration, a single batch cycle typically lasted three days and was marked by the voltage decreasing to less than 0.05 V measured across the anode and cathode. To promote complete mixing, the cathode feed was recycled at 30 mL min−1 between the cathode and a 1 L external sealed recycle bottle used for collection of gas and liquid samples. The cathode media during the course of experiments, unless otherwise stated, consisted of (per liter) 0.7098 g Na2HPO4, 1.4968 g KH2PO4, 0.05 g MgSO4, and 0.1228 g NaNO3. Additionally, trace minerals were added to each solution, including (per liter): 1 mg CaCl2·2H2O, 1 mg FeSO4·7H2O, 100 μg ZnSO4·7H2O, 30 μg MnCl2·4H2O, 300 μg H3BO3, 200 μg CoCl2·6H2O, 10 μg CuCl2·2H2O, 10 μg NiCl2·6H2O, 30 μg Na2MoO4·2H2O, and 30 μg Na2SeO3. All the feed solutions were sparged with N2 before the start of each batch cycle. The MFCs and feed bottles were covered with aluminium foil to ensure light did not inhibit denitrification or cause phototrophic growth. After the acclimation period and establishing steady state conditions, experiments were performed to obtain data for model fitting for the purpose of estimating denitrification kinetic parameters (Table 1, E2 & E3). Experiments were also performed to determine if environmental parameters such as dissolved oxygen concentration, pH and carbon limitation were responsible for the nitrite accumulation (Table 1, E4–E9).
| Experiment | Media change | Purpose |
|---|---|---|
| E1 | No change | Acclimation of biofilm to reach steady state conditions |
| E2 | No change | Data collection for model calibration |
| E3 | 20 mg NO3−–N L−1 replaced with 30 mg NO2−–N L−1 | Data collection for nitrite kinetic parameters |
| E4 | Acetate concentration in the anode increased from 154 mg-COD L−1 to 770 mg-COD L−1 | Determine if electron donor was limiting |
| E5 | Catholyte constantly sparged with N2 in recycle bottle during cycle | Eliminate potential DO diffusion in cathode |
| E6 | Catholyte amended with 5 mg HCO3−–C L−1 | Determine if inorganic carbon is limiting |
| E7 | 30 mg NO2−–N L−1, starting pH 6.6 | Determine if pH lowers nitrite reduction rate |
| E8 | 30 mg NO2−–N L−1, starting pH 7.0 | Determine if pH lowers nitrite reduction rate |
| E9 | 30 mg NO2−–N L−1, starting pH 7.4 | Determine if pH lowers nitrite reduction rate |
Analyses and calculations
Nitrate, nitrite, acetate, and sulfate were monitored in the influent and effluent of the anode and cathode compartments using a Metrohm 850 Professional Ion Chromatograph (IC) (Metrohm Inc., Switzerland) with a Metrosep A Supp 5-250 3.2 mM Na2CO3, 1.0 mM NaHCO3 eluent was pumped at 2.6 mL min−1, with a 100 mM HNO3 suppressor solution and using a 20 μL sample loop. Ammonium was monitored using a Metrohm 850 Professional IC (Metrohm Inc., Switzerland) with a Metrosep C 2-250 cation column (Metrohm Inc., Switzerland). For cation analysis, an eluent consisting of 0.75 mM dipicolinic acid and 4 mM tartaric acid was pumped at 1 mL min−1, using a 10 μL sample loop. Each sample was filtered through 0.1 μm syringe filters, stored at 4 °C and analyzed within 5 days of sampling.Nitric oxide and nitrous oxide were measured using an Agilent 7890A Gas Chromatograph with a Thermal Conductivity Detector (Agilent, USA) with HP-PLOT Molesieve column (Agilent, USA). The inlet was heated to a temperature of 200 °C, with a total flow of 35.5 mL min−1 and the septum flow at 3 mL min−1. A split inlet was used at a 4![[thin space (1/6-em)]](https://www.rsc.org/images/entities/char_2009.gif) :1 ratio, or at 26 mL min−1. The initial oven temperature at the beginning of each run was 35 °C and held for 5 minutes, then ramped at 25 °C min−1 to 200 °C, where it was held for 4 minutes. The TCD filament was set at 250 °C, with a 20 mL min−1 reference flow, and a 4.5 mL min−1 makeup flow. The makeup gas used was helium. Inorganic carbon was measured using a Shimadzu TOC-VCPH Total Organic Carbon Analyzer (Shimadzu, Japan). pH was measured using a Fisher Science Education pH Meter (Fisher Scientific, USA).
:1 ratio, or at 26 mL min−1. The initial oven temperature at the beginning of each run was 35 °C and held for 5 minutes, then ramped at 25 °C min−1 to 200 °C, where it was held for 4 minutes. The TCD filament was set at 250 °C, with a 20 mL min−1 reference flow, and a 4.5 mL min−1 makeup flow. The makeup gas used was helium. Inorganic carbon was measured using a Shimadzu TOC-VCPH Total Organic Carbon Analyzer (Shimadzu, Japan). pH was measured using a Fisher Science Education pH Meter (Fisher Scientific, USA).
Electrochemical analyses
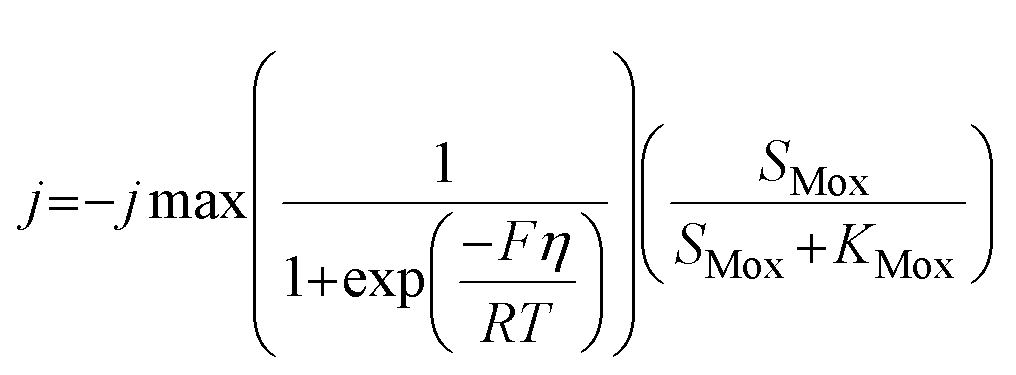
The MFCs were operated with a 100 Ω external resistance. The potential difference across the external resistances was monitored every 10 minutes using a Keithley Model 2700 Multimeter with a 7700 Switching Module (Keithley Instruments Inc., Cleveland, OH, USA). Low scan rate cyclic voltammetry (LSCV) were performed using a Gamry Series G750 Potentiostat/Galvanostat/ZRA (Gamry, USA). The cathode potential was swept from −0.4 V vs. SHE to 0.4 V vs. SHE at 1 mV s−1 and the current density was recorded. jmax and EKc were estimated by fitting the Nernst–Monod equation to the LSCV curve.32Theory and modeling
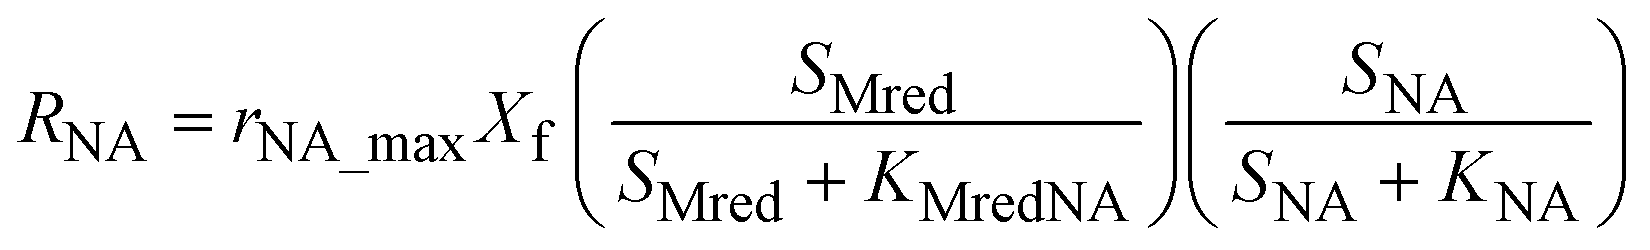
The model presented in this study was obtained through an integration of the Nernst–Monod model29 with the ASM–ICE model.27 The rate equations and the process matrix are presented in Table 2. Briefly, the cathode oxidation and simultaneous reduction of the oxidized intracellular electron carrier (SMox) is represented by R1 which simulates electron transfer from the cathode to the biofilm. Nitrate and nitrite reduction are represented by R2 and R3 respectively. The transfer of electrons from cathode oxidation to the reduction of nitrate and nitrite is accomplished in the model through the reduction of the SMox to SMred, which is mathematically represented through a constant total concentration (Ctot) as R4. The parameters represented in the model are as follows: RNA is the nitrate reduction rate (mmol g-VSS−1 L−1 h−1), RNI is the nitrite reduction rate (mmol g-VSS−1 L−1 h−1), SNA and SNI are the nitrate and nitrite concentrations respectively (mmol L−1), j is the current density (A m−2), η = Ecat − EKC where Ecat is the cathode potential and EKC is the cathodic electron donor potential for the half-maximum rate (V), jmax is the maximum current density (A m−2), SMox and SMred are the concentrations (mmol gVSS−1) of oxidized and the reduced form of the intermediate electron carrier, Ctot is the total concentration of the electron carrier (mmol gVSS−1), KMox is the half saturation constant for SMox (mmol gVSS−1), KMredNA is the SMred affinity constant for nitrate reductase (mmol gVSS−1) and KMredNI is the SMred affinity constant for nitrite reductase (mmol gVSS−1), rNA_max and rNI_max are maximum nitrate and nitrite reduction rates (mmol gVSS−1 h−1) respectively.| Process | S NA | S NI | S Mox | S Mred | Rate expression |
|---|---|---|---|---|---|
| R1 | −0.5 | 0.5 |
|
||
| R2 | −1 | 1 | 1 | −1 |
|
| R3 | −1 | +0.5 | −0.5 |

|
|
| R4 | C tot = SMox + SMred |
All kinetics parameters were estimated by solving the differential rate equations and fitting the modeled data to observed data. The following assumptions were made for the purpose of modeling: the biofilm on the cathode was at steady state i.e. growth of the biofilms equals decay and detachment and for thin biofilms such as those observed in denitrifying cathodes, diffusional limitations are minimal. This assumption was confirmed with biofilm imaging (data not shown). The total electron carrier concentration, Ctot was assumed to be 0.01 mmol gVSS−1 as in Pan et al. (2013).27KMox was assumed to be 1% of the Ctot to ensure that the reduction of SMox was not rate limiting. KNA was assumed to be 3.21 × 10⁻³ mmol L−1.33 The biomass parameter (XfLf) was determined by dividing the amount of volatile suspended solids (VSS) by the projected surface area of the cathode. The amount of VSS was determined by using Standard Methods 2540 D and 2540 E at the end of operation of the MFCs. The projected surface area of the cathode electrode was determined by performing a particle size distribution analysis and determining an average particle size. The assumption was made that the particles were spherical. The d50 or 50% particle size was used as the average particle size. The specific surface area (SSA) was calculated using the following equation
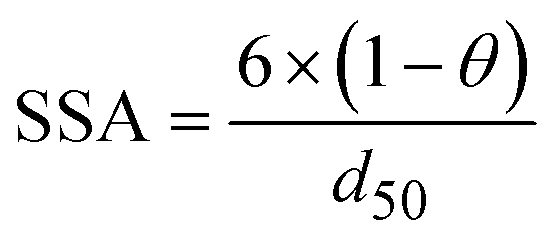 | (2) |
All the modeling was done using R statistical software.34–36 Parametric estimations was done by minimizing the sum of squares of the residuals and using a genetic algorithm, similar to the implementation by Pelletier et al.37
Model calibration and validation
The nitrite parameters (KNI, rNI_max) were estimated by calibrating the model to the data for a representative batch from experiment E3 where nitrite was added to the media instead of nitrate. The rest of the parameters were estimated by calibrating the model to a typical batch data (Fig. 1, replicate batches presented in Fig. S1†) using a genetic algorithm with multi-objective optimization which was implemented using a non-dominated sort method.38 The half-saturation constant for nitrate reduction (KNA) was assumed from literature,33 since nitrate reduction has been extensively studied. The multi-objective optimization was performed using nitrate and nitrite model fits as the two objectives for data from E2. Model validation was performed with two separate batches from experiment E1 from two different reactors to test and demonstrate applicability of the model to other reactors acclimated under the same conditions. | ||
| Fig. 1 A typical batch cycle observation during denitrification. The lines are there only for highlighting trends and are not representative of model simulations. | ||
Results and discussion
Denitrifying biocathode acclimation
During the initial acclimation period (∼50 batch cycles), the denitrification rates gradually increased and became consistent, indicating the establishment of a steady-state biofilm. During a typical batch of the biocathode, the removal of nitrate with simultaneous accumulation of nitrite was observed (Fig. 1A). Subsequent to the removal of nitrate, removal of accumulated nitrite was observed. Peak nitrite accumulation observed was 66.4 ± 7.5% of the initial nitrogen concentration added as nitrate. This is consistent with previously reported nitrite peak accumulation values of 50–55% of initial nitrogen added as nitrate.18,19 The accumulation of nitrite was reproducible in different batches in the duplicate reactors (Fig. S1†). Nitrous oxide also accumulated in the recycle bottle headspace, with a peak accumulation of 1% of the initial nitrogen added as nitrate (Fig. 1A). Previous studies have reported nitrous oxide accumulation of ∼0.025% to 70% of the initial nitrogen added.18,20,39 It should be noted that at the end of each batch cycle denitrification was complete and the average denitrification rate was 5.8 ± 0.4 g-N m–3 d–1. The cathode potential during the various stages of denitrification was also monitored. It decreased from −0.014 ± 0.007 V vs. SHE during nitrate reduction to −0.038 ± 0.004 V vs. SHE during nitrite reduction. Once nitrite was depleted, the cathode potential dropped to −0.254 ± 0.007 V vs. SHE (Fig. 1B).Volumetric power density (W m−3) also followed a similar trend decreasing during the difference stages of the denitrification. Polarization curves were performed at different stages of a single batch cycle. A curve was obtained when nitrate was the primary dissolved form of nitrogen and primary available acceptor (at 5 hours), when nitrite was the primary electron acceptor available (at 45 hours) and when nitrous oxide was the remaining available electron acceptor (at 70 hours) (Fig. 2). The maximum power production during nitrite reduction (0.97 ± 0.21 W m−3-total cathode volume (TCV)) only achieved 64% of the maximum power produced during nitrate reduction (1.51 ± 0.29 W m−3-TCV). Very little power production was observed during nitrous oxide reduction (0.03 ± 0.005 W m−3-TCV). This suggests that the predominant reduction pathway in the cathode can dictate the power production in an MFC and influence the system's ability to achieve treatment goals. The electron equivalents recovered from the cathode during denitrification averaged 94.9 ± 3.9%.
 | ||
| Fig. 2 Polarization curves performed during different stages of denitrification. | ||
Inhibition of nitrite reduction by environmental factors
Inhibition of nitrite reduction can be caused by several factors such as insufficient electron donor, insufficient carbon source, presence of dissolved oxygen and pH.24,25,40 To determine if insufficient electron donor was a limiting factor causing accumulation of nitrite, the acetate feed in the anode was increased from 154 mg-COD L−1 per day to 770 mg-COD L−1 per day (Table 1, E4). Despite the increase in the electron donor loading rate, peak nitrite accumulation of 66.2% of the total nitrogen added was observed.Oxygen inhibition was also considered. Unanticipated oxygen diffusion occurring through the fittings or tubing could have compromised anoxic conditions. In addition to the initial N2 purge, the feed was continuously sparged with nitrogen gas over the course of a batch cycle to maintain anoxic conditions (Table 1, E5). A peak nitrite accumulation of 62.7% of the total nitrogen added was observed, similar to cycles without a nitrogen-purge. Insufficient carbon source was considered as a possible cause of nitrite accumulation, so the cathode media was supplemented with bicarbonate (Table 1, E6). A peak nitrite accumulation of 77.5% of the total nitrogen was measured. Cathode media with pHs of 6.6, 7.0, and 7.4 were fed to the cathode and the nitrite reduction rate was monitored (Table 1, E7–E9). No significant changes were observed. Changing the environmental conditions to overcome potential denitrification inhibition did not change nitrite accumulation in batch cycles of the cathode.
Modeling denitrification
Modeling denitrification can improve our understanding of the microbial processes and yield kinetic parameters, which can be useful in designing denitrifying biocathode MFCs. When it was observed that various environmental factors did not significantly affect the accumulation of nitrite in the cathode, it was hypothesized that the accumulation of nitrite was caused due to intracellular electron competition between the enzymes involved in the different steps of denitrification. The ASM–ICE model has been used previously to simulate accumulation of nitrite in suspended cultures and bioreactors. For a denitrifying biocathode, we integrated the Nernst–Monod model, to simulate electron transfer from the electrode to the denitrifying biofilm, into the ASM–ICE (ASM–NICE). ASM–NICE (Table 2) was used to simulate the accumulation of nitrite in the biocathode using a genetic algorithm for estimation of parameters. A Nernst–Monod current-potential dependency was observed with a mid-point potential (EkC) of −0.13 V. A mid-point potential of −0.18 V has been previously reported for a denitrifying biocathode.31 It has been previously shown, for bioanodes, that a number of factors, including the source of the inoculum, can influence the value of the mid-point potential.41The kinetic parameters were estimated by calibrating the model to two datasets: the typical batch data (Table 1, E2) and nitrite-only data (Table 1, E3). All the estimated parameter values (Table 3) are in the range of reported values in literature.27,28 It should be noted that since this is the first study to report kinetic rate constants using ASM–NICE, a direct comparison could not be made. KMredNA and KMredNI are affinity constants of the nitrate and nitrite reductase enzymes for the reduced mediator, Mred. The lower the value of these constants, the higher the affinity of the enzyme is to the reduced carrier. The value for KMredNI for nitrite reduction is lower than that for KMredNA for nitrate reduction, indicating that nitrite reduction has a higher capability to compete for electrons when the electron donor is limiting. Since current from the anode remained relatively constant and the concentration of nitrate was high during the initial stages of the batch, nitrate reduction consistently preceded nitrite reduction. Model fits from calibration (Fig. 3 and Fig. S2†) for two different experimental scenarios (E2 and E3) show good agreement with observed data. Model validation was performed with duplicate batch data (E1) from duplicate reactors. The results of the model validation (Fig. 4) suggest that the ASM–NICE model for the biocathode is able to simulate the autotrophic denitrification process using the cathode as the electron donor reasonably well (Fig. S3†). By validating the model with data from two separate MFCs, the validity of the model and the estimated kinetic parameters are demonstrated for different reactors acclimated under similar conditions. Denitrification using a biocathode has been widely used since nitrate has a relative metabolic potential close to that of oxygen ( = 0.74 V vs. SHE,
  = 0.9 V vs. SHE). Using nitrate instead of oxygen eliminates oxygen diffusion across to the anode and thus a source of loss in coulombic efficiencies in MFCs.9
| Parameter | Source | Value | Parameter | Source | Value |
|---|---|---|---|---|---|
| a Parameters estimated in this study. b Experimentally measured parameters. c Assumed values based on Pan et al. 2013. d Assumed value from Claus and Kutzner.33 | |||||
| r NA_max (mg-N gVSS−1 h−1) | 1.68 | j max (A m−2) | −0.31 | ||
| K Ni (mg-N L−1) | 0.56 | E Kc (V) | −0.13 | ||
| r NI_max (mg-N gVSS−1 h−1) | 0.45 | C tot (mmol gVSS−1) | 0.01 | ||
| K MredNA (mmol gVSS−1) | 0.012 | K Mox (mmol gVSS−1) | 0.0001 | ||
| K MredNI (mmol gVSS−1) | 0.002 | K NA (mg-N L−1) | 0.0448 | ||
| X f (g-VSS) | 0.641 | ||||
 | ||
| Fig. 3 Measured (points) and predicted (lines) concentrations of nitrate and nitrite using ASM–NICE for the calibration dataset – A) E2 B) E3. | ||
 | ||
| Fig. 4 Measured (points) and predicted (lines) concentrations of nitrate and nitrite using ASM–NICE for the validation dataset (A) reactor 1 (B) reactor 2. | ||
In this study, we calibrated and modeled denitrification in a biocathode using ASM–NICE. Such an integrated model has not been presented before to the best of our knowledge. The modeling suggested that when nitrate is at higher concentrations than nitrite, the reduction of nitrite is retarded by the competition for intracellular electron mediators. This would suggest that, when designing continuous-flow biocathodes for nitrate–nitrogen removal, longer hydraulic retention times (HRTs) could resolve the nitrite accumulation. A preliminary sensitivity analysis of the model to the kinetic parameters (KNI, KMox, KNA, EkC, jmax) revealed that these parameters did not have a significant effect on the accumulation of nitrite (data not shown). However, the model showed significant sensitivity to KMredNI and KMredNA (Fig. S4 and S5†). Briefly, an increase in KMredNI caused the accumulation of nitrite to increase and vice versa. However, reduction of nitrate was not affected. A change in KMredNA affected both nitrate and nitrite reduction since nitrite is formed from the reduction of nitrite. KMredNA and KMredNI are properties of nitrate and nitrite reductase enzymes respectively. The developed model is also able to simulate nitrate and nitrite concentration profiles in a denitrifying biocathode, yielding kinetic parameters (KNI, rNA_max, rNI_max, KMredNA, KMredNI) that can be used for process design.
Conclusions
This study focused on the dynamics of denitrification in a MFC biocathode, with respect to the accumulation of nitrite before complete denitrification was observed. It was also observed that the power production during nitrate–nitrite reduction was higher compared to that during nitrite reduction. Improvement or control of environmental parameters that affect denitrification pathways did not affect the amount of nitrite accumulation. Denitrification in the biocathode was modeled using ASM–NICE to simulate the use of the cathode electrode as the electron donor. Calibration of the model yielded kinetic parameters (KNI, rNA_max, rNI_max, KMredNA, KMredNI), which could be used for prediction of the performance of a biocathode. The model will serve as a platform for future research into biocathodes and optimization of their performance. The use of this new model to simulate denitrifying biocathodes under various experimental conditions could yield important information for translating lab-scale studies to pilot scale and full-scale treatment systems. Furthermore, experimental work is needed to determine the specific microorganisms performing autotrophic denitrification in a biocathode and the influence of EKc on their performance.Acknowledgements
The authors would like to thank Elizabeth Isenstein for her help with the genetic algorithm. We would also like to thank the Edwin Sisson Fellowship, which funded Varun Srinivasan during the course of this work and start-up funding from the University of Massachusetts-Amherst.References
- P. Clauwaert, P. Aelterman, T. H. Pham, L. De Schamphelaire, M. Carballa, K. Rabaey and W. Verstraete, Appl. Microbiol. Biotechnol., 2008, 79, 901–913 CrossRef CAS PubMed.
- A. E. Franks and K. P. Nevin, Energies, 2010, 3, 899–919 CrossRef CAS.
- B. E. Logan, B. Hamelers, R. Rozendal, U. Schröder, J. Keller, S. Freguia, P. Aelterman, W. Verstraete and K. Rabaey, Environ. Sci. Technol., 2006, 40, 5181–5192 CrossRef CAS PubMed.
- B. E. Logan, Appl. Microbiol. Biotechnol., 2010, 85, 1665–1671 CrossRef CAS PubMed.
- K. B. Gregory and D. R. Lovley, Environ. Sci. Technol., 2005, 39, 8943–8947 CrossRef CAS PubMed.
- K. B. Gregory, D. R. Bond and D. R. Lovley, Environ. Microbiol., 2004, 6, 596–604 CrossRef CAS PubMed.
- S. M. Strycharz, T. L. Woodard, J. P. Johnson, K. P. Nevin, R. A. Sanford, F. R. Loffler and D. R. Lovley, Appl. Environ. Microbiol., 2008, 74, 5943–5947 CrossRef CAS PubMed.
- C. J. Castro, J. E. Goodwill, B. Rogers, M. Henderson and C. S. Butler, J. Water, Sanit. Hyg. Dev., 2014, 4, 663–671 CrossRef.
- C. S. Butler and R. Nerenberg, Appl. Microbiol. Biotechnol., 2010, 86, 1399–1408 CrossRef CAS PubMed.
- P. Clauwaert, K. Rabaey, P. Aelterman, L. de Schamphelaire, T. H. Pham, P. Boeckx, N. Boon and W. Verstraete, Environ. Sci. Technol., 2007, 41, 3354–3360 CrossRef CAS PubMed.
- B. Virdis, K. Rabaey, R. A. Rozendal, Z. Yuan and J. Keller, Water Res., 2010, 44, 2970–2980 CrossRef CAS PubMed.
- N. Guerrero-Rangel, J. A. Rodriguez-de la Garza, Y. Garza-Garcia, L. J. Rios-Gonzalez, G. J. Sosa-Santillan, I. M. de la Garza-Rodrguez, S. Y. Martinez-Amador, M. M. Rodriguez-Garza and J. Rodriguez-Martinez, Int. J. Elec. Power Eng., 2010, 4, 27–31 CrossRef.
- S. Pandit, A. Sengupta, S. Kale and D. Das, Bioresour. Technol., 2011, 102, 2736–2744 CrossRef CAS PubMed.
- A. M. Fan and V. E. Steinberg, Regul. Toxicol. Pharmacol., 1996, 23, 35–43 CrossRef CAS PubMed.
- G. Ciudad, O. Rubilar, P. Muñoz, G. Ruiz, R. Chamy, C. Vergara and D. Jeison, Process Biochem., 2005, 40, 1715–1719 CrossRef CAS.
- B. E. Rittmann and P. L. McCarty, Environmental Biotechnology: Principles and Applications, New York: McGraw-Hill, 2001 Search PubMed.
- P. Clauwaert, J. Desloover, C. Shea, R. Nerenberg, N. Boon and W. Verstraete, Biotechnol. Lett., 2009, 31, 1537–1543 CrossRef CAS PubMed.
- J. Desloover, S. Puig, B. Virdis, P. Clauwaert, P. Boeckx, W. Verstraete and N. Boon, Environ. Sci. Technol., 2011, 45, 10557–10566 CrossRef CAS PubMed.
- S. Puig, M. Serra, A. Vilar-Sanz, M. Cabré, L. Bañeras, J. Colprim and M. D. Balaguer, Bioresour. Technol., 2011, 102, 4462–4467 CrossRef CAS PubMed.
- T. Van Doan, T. K. Lee, S. K. Shukla, J. M. Tiedje and J. Park, Water Res., 2013, 47, 7087–7097 CrossRef CAS PubMed.
- W. M. J. Lewis and D. P. Morris, Trans. Am. Fish. Soc., 1986, 115, 183–195 CrossRef CAS.
- C. S. Bruning-Fann and J. B. Kaneene, Vet. Hum. Toxicol., 1993, 35, 521–538 CAS.
- IPCC, J. T. Houghton, Y. Ding, D. J. Griggs, M. Noguer, P. J. van der Linden, X. Dai, K. Maskell and C. A. Johnson, Climate Change 2001: The Scientific Basis, Cambridge University Press, Cambridge, United Kingdom and New York, NY, USA, 2001 Search PubMed.
- H. Körner and W. G. Zumft, Appl. Environ. Microbiol., 1989, 55, 1670–1676 Search PubMed.
- Y. Zhou, A. Oehmen, M. Lim, V. Vadivelu and W. J. Ng, Water Res., 2011, 45, 4672–4682 CrossRef CAS PubMed.
- W. C. Hiatt and C. P. L. Grady, Water Environ. Res., 2008, 80, 2145–2156 CrossRef CAS PubMed.
- Y. Pan, B. J. Ni and Z. Yuan, Environ. Sci. Technol., 2013, 47, 11083–11091 CrossRef CAS PubMed.
- Y. Pan, B.-J. Ni, H. Lu, K. Chandran, D. Richardson and Z. Yuan, Water Res., 2015, 71, 21–31 CrossRef CAS PubMed.
- A. K. Marcus, C. I. Torres and B. E. Rittmann, Biotechnol. Bioeng., 2007, 98, 1171–1182 CrossRef CAS PubMed.
- A. Ter Heijne, O. Schaetzle, S. Gimenez, F. Fabregat-Santiago, J. Bisquert, D. P. B. T. B. Strik, F. Barrière, C. J. N. Buisman and H. V. M. Hamelers, Energy Environ. Sci., 2011, 4, 5035 CAS.
- K. P. Gregoire, S. M. Glaven, J. Hervey, B. Lin and L. M. Tender, J. Electrochem. Soc., 2014, 161, H3049–H3057 CrossRef.
- C. I. Torres, A. K. Marcus, P. Parameswaran and B. E. Rittmann, Environ. Sci. Technol., 2008, 42, 6593–6597 CrossRef CAS PubMed.
- G. Claus and H. J. Kutzner, Appl. Microbiol. Biotechnol., 1985, 22 Search PubMed.
- K. Soetaert, T. Perzoldt and W. R. Setzer, J. Stat. Softw., 2010, 33, 1–25 Search PubMed.
- R Core Team, R: A language and environment for statistical computing, R Foundation for Statistical Computing, Vienna, Austria, 2015 Search PubMed.
- H. Wickham, ggplot2: Elegant graphics for data analysis, Springer, New York, 2009 Search PubMed.
- G. J. Pelletier, S. C. Chapra and H. Tao, Environ. Model. Softw., 2006, 21, 419–425 CrossRef.
- K. Deb, A. Pratap, S. Agarwal and T. Meyarivan, IEEE Trans. Evol. Comput., 2002, 6, 182–197 CrossRef.
- B. Virdis, K. Rabaey, Z. Yuan and J. Keller, Water Res., 2008, 42, 3013–3024 CrossRef CAS PubMed.
- R. Knowles, Microbiol. Rev., 1982, 46, 43–70 CAS.
- J. F. Miceli, P. Parameswaran, D.-W. Kang, R. Krajmalnik-Brown and C. I. Torres, Environ. Sci. Technol., 2012, 46, 10349–10355 CAS.
Footnote |
| † Electronic supplementary information (ESI) available. See DOI: 10.1039/c5ew00260e |
| This journal is © The Royal Society of Chemistry 2016 |