
N-Nitrosamine formation kinetics in wastewater effluents and surface waters†
Jinwei
Zhang
a,
David
Hanigan
b,
Paul
Westerhoff
b and
Pierre
Herckes
*a
aSchool of Molecular Sciences, Arizona State University, Tempe, AZ 85287-1604, USA. E-mail: pierre.herckes@asu.edu; Fax: +1 480 965 2747; Tel: +1 480 965 4497
bSchool of Sustainable Engineering and the Built Environment, Arizona State University, Tempe, AZ 85287-3005, USA
First published on 5th January 2016
Abstract
N-Nitrosodimethylamine (NDMA) is a chloramination disinfection by-product (DBP) with an uncertain regulatory future. While extensive literature exists on NDMA formation potentials (FP) for natural waters and for model compounds considered as NDMA precursors, less data exists on the kinetics of NDMA formation in surface and wastewaters. NDMA formation kinetics experiments were conducted in seven source waters at two monochloramine doses. NDMA formation was modeled by a simple, second-order model, using the measured NDMAmax and monitored monochloramine concentrations at selected reaction times. The model fits NDMA formation well (R2 > 0.88) in all source waters. While the extent of NDMA formation was highly variable, the rate constant (kapp) values from different waters fell in a narrow range (0.01–0.09 M−1 s−1). This suggests that a common precursor or rate limiting step for NDMA formation likely exists despite the differences in matrices. Although further studies are needed to validate the model over a wider range of water conditions such as pH and N![[thin space (1/6-em)]](https://www.rsc.org/images/entities/char_2009.gif) :Cl2 ratios, the model could help water utilities to predict NDMA formation in distribution systems.
:Cl2 ratios, the model could help water utilities to predict NDMA formation in distribution systems.
Water impactN-Nitrosodimethylamine (NDMA) has drawn extensive attention because of its rodent carcinogenicity and occurrence in drinking water. Kinetics information for NDMA formation is lacking for wastewaters and drinking waters. In this work, chloramination of waters from various sources (e.g. surface waters and wastewaters) was performed and a second order model of NDMA formation is proposed to describe NDMA formation kinetics. The proposed model presents a practical way for water utilities to predict NDMA formation in their waters. The results offer new insights on possible NDMA formation mechanisms in real waters. |
Introduction
Occurrence studies and potential carcinogenicity of N-nitrosamines (NAs) in drinking water are leading the United States Environmental Protection Agency (USEPA) and some Canadian Provinces to set health standards and regulatory determinations for individual or groups of NAs. Over the past decades, NAs have emerged as a large scale concern because water utilities have increasingly relied upon chloramines for residual disinfection to meet trihalomethane (THM) and haloacetic acid (HAA) regulations.1 Six NAs were included in Unregulated Contaminant Monitoring Rule 2 (UCMR2), and five of those were then included on the third Contaminant Candidate List (CCL3).2N-Nitrosodimethylamine (NDMA) was the most commonly detected NA in UCMR2 (34% of chloraminated drinking waters) with detections of four other NAs being rare (<1% of samples) and typically occurring in samples with high NDMA concentration.3 NAs, including NDMA, are classified as probable human carcinogens in water at low ng L−1 levels associated with a 10−6 lifetime cancer risk.4 Based on this assessment, California's Office of Environmental Health Hazard Assessment (OEHHA) set a public health goal at 3 ng L−1 for NDMA5 and California's Department of Public Health (CDPH) has set 10 ng L−1 notification for three nitrosamines.6 Because of their potential to cause cancer, the USEPA may soon make a regulatory determination for NAs.A recent review indicates that most studies have found that NDMA formation is more associated with chloramination than with chlorination.1 Systems using chloramines as the primary, rather than secondary, disinfectant have high NDMA Formation Potential (FP) (i.e., >50 ng L−1) in plant effluent,3 indicating the potential for precursor deactivation by strong pre-oxidants such as chlorine. Since nitrosamine formation is a kinetically slow process, plants using chloramine with long hydraulic contact times in plant plus distribution system (e.g., 12–18 h) tend to have more NDMA in the effluent than those using chloramine for short (e.g., 0.5–2 h) contact times.7 NDMA concentrations tend to increase throughout chloraminated distribution systems.7–11
NA formation in drinking water requires an organic nitrogen-based precursor plus an oxidant (e.g., inorganic chloramine, ozone).12,13 Oxidation chemistry, including inorganic reactions with bromide and ammonia,14,15 is important; however, little information is available regarding which organic precursors control the rate and extent of NA formation in drinking water. Mechanistic studies indicate that yields of NDMA from chloramination of most secondary and tertiary model amines are ∼0–2% but can be >80% for certain tertiary amines with β-aryl functional groups.16,17 Wastewater-impaired source waters contain NDMA precursors, suggesting the importance of anthropogenic constituents. Specific precursors have not been characterized outside of a select few18 in wastewater-impaired source waters but could include either tertiary amine-based microconstituents that form NDMA at high yield or quaternary amine-based macroconstituents of consumer products that form NDMA at low yield.
Different NDMA formation pathways during chloramination are briefly illustrated in the ESI† section (Text S1). Despite rich literature on pathways and yields of NDMA formation using model compounds,19–23 less information exists related to the kinetics of NDMA formation in surface and wastewaters. Many studies rely upon NDMA FP measurements which are akin to THM-FP measurements and, while useful, lack information suitable for managing DBP formation in complex hydraulic systems. Simulated distributed system (SDS) test methods for NA's have been developed, but often include a short free chlorine period (before NH3 addition) to mimic common drinking water treatment plant (DWTP) disinfection processes. We believe a focus on NDMA formation kinetics in raw water samples will expand our understanding (i.e. profiling) of NDMA precursors.
The aim of this paper is to investigate NDMA formation kinetics in waters with lower (surface waters) and higher (treated wastewater effluents) levels of NDMA precursors. In experiments conducted with seven different waters, the decay of monochloramine and formation of NDMA were monitored. Experimental data were fit using a second-order reaction model. We observed similar magnitudes of the fitted second order apparent rate constant for NDMA formation across a range of water sources, suggesting the model represented a possible common rate limiting step that exists in most raw waters.
Experimental and analytical methods
Source waters
Kinetic experiments were performed in seven different water matrices, five wastewater effluents, one surface water, and one groundwater. Secondary wastewater effluents were collected at local wastewater treatment plants (WWTP) in the Metro Phoenix and Nogales regions of Arizona. The surface water was collected from central AZ surface water supplies and the groundwater was pumped from a canal in a heavily industrial/agricultural impacted area. All water samples were filtered immediately after sampling (10 μm, CLR 1–10 Pall Corporation, Port Washington, NY) and stored in the dark at 4 °C for less than a week.Reagents
All reagent water was >18.2 MΩ cm and of laboratory grade (Milli-Q Millipore, Billerica, MA). Sodium hypochlorite (5.65–6%), sodium borate, and sodium sulfite were purchased from Fisher Scientific (Fairlawn, NJ). Ammonium chloride and anhydrous sodium sulfate were obtained from Sigma Aldrich (St. Louis, MO). Dichloromethane (DCM) and methanol were purchased from EMD Chemical (Gibbstown, NJ). NDMA was purchased through Sigma-Aldrich (St. Louis, MO). Deuterated NDMA (NDMA-d6) was purchased from Cambridge Isotopes (Andover, MA) and diluted to 100 μg L−1 in Milli-Q water.Chloramination experiments
NDMA formation by chloramination of source waters was conducted in 500 mL sample aliquots using 1 L amber bottles. A borate buffer stock solution was prepared by dissolving sodium borate and boric acid in water. Aliquots were buffered at pH 8.0–8.2 by adding 10 mM borate before chloramination. The preformed monochloramine stock solution was prepared by adding sodium hypochlorite into a borate buffered (10 mM, pH = 8.0 ± 0.1) ammonium chloride solution to produce a N:Cl2 molar ratio of 1.2:1. For samples from each water source, experiments were conducted using two monochloramine doses, a higher dose at 15–20 mg L−1 and a lower dose at 5–7 mg L−1 to simulate FP test and SDS test conditions. After adding monochloramine, samples were allowed to react in the dark at room temperature (23 ± 1 °C). Reaction times ranged from 0 minutes to longer than 720 hours. Residual monochloramine was measured before quenching the residual using 5 mL of 0.5 M ascorbic acid. All samples were spiked with 1 mL of 100 μg L−1 NDMA-d6 and kept in the dark at 4 °C until extraction and analysis.
NDMA analysis
NDMA extraction and concentration procedures used in this work have been described previously.24 Briefly, activated coconut charcoal solid phase extraction (SPE) cartridges (Restek, Bellefonte, PA) were first conditioned with DCM, methanol, and HPLC grade water. Then, 500 mL water samples with isotope (NDMA-d6) were passed through SPE cartridges. After loading, the cartridges were dried using ultra high purity (UHP) nitrogen gas, and 5 mL DCM was used to elute NDMA. After being dried with anhydrous sodium sulfate powder, the extract of NDMA in DCM was concentrated under UHP nitrogen gas to 1 mL.The extracted samples were analyzed using an Agilent 6890N/5973 inert GC/MS operated in positive chemical ionization mode with ammonia as the reagent gas.25 In brief, the chromatographic column used was an Agilent DB-1701P (30 m × 0.250 mm × 0.25 μm) (Santa Clara, CA) and followed a pulsed splitless injection (initial pulse 15 psi for 45 s and then 10 psi) set at 250 °C with a reduced diameter SPME inlet liner (Sigma Aldrich, St. Louis, MO). The helium carrier gas was initially pulsed at 1.9 mL min−1 for 45 s and then reduced to 1.3 mL min−1 for the rest of the run. 4 μL of sample was injected into GC through the inlet, with oven temperature of 40 °C held for 3 min, increased by 4 °C min−1 to 80 °C and increased to 120 °C at 20 °C min−1. The column interface temperature was set at 200 °C. The mass selective detector was set to analyze for mass-to-charge 92 (NDMA + NH4+) and 98 (NDMA-d6 + NH4+). The GC/MS was calibrated using a series of NDMA standards ranging from 1 μg L−1 to 1 mg L−1 and NDMA-d6 (100 μg L−1) as internal standard.
Other analyses
Free chlorine and monochloramine concentrations were measured using N,N-diethyl-p-phenylenediamine (DPD) free chlorine and Monochlor F reagents with a Hach DR5000 spectrophotometer (Hach Company, Loveland, CO). Dissolved organic carbon (DOC) was measured using a Shimadzu Total Organic Carbon (TOC)-VCSH (Shimadzu America Inc., Columbia, MD). UV absorbance was measured using a Shimadzu Multispec-150, and pH was determined with a pH meter (Model PHI410, Beckman Counter Inc., Brea, CA).Results & discussion
NDMA formation kinetics in wastewaters
Fig. 1 shows NDMA formation and monochloramine decay kinetics in a secondary treated wastewater with two different monochloramine doses. The pH values remained unchanged during the reaction. Monochloramine decayed slowly over the course of the experiment (580 hours) with a monochloramine residual remaining throughout the duration of the experiments. NDMA formation reached a maximum level of ∼460 ng L−1 (∼6 nM) within 120 hours at the higher monochloramine dose and more slowly approached a lower maximum NDMA concentration ∼300 ng L−1 (∼4 nM) at the lower monochloramine dose. In addition, at higher monochloramine doses, NDMA formation increased faster and reached its maximum in less time. Thus, the concentration of monochloramine is a crucial factor of the NDMA formation kinetics via chloramination of wastewater effluents in our experiments, both thermodynamically and kinetically. Data collected for the other wastewater effluents showed a similar impact of monochloramine on the rate and yields of NDMA formation (see ESI,† Fig. S1–S4). The maximum NDMA formation in each experiment will be referred to as NDMAmax, and equals the molar concentrations of NDMA precursors (P0) in the water under the specific experimental conditions before chloramination.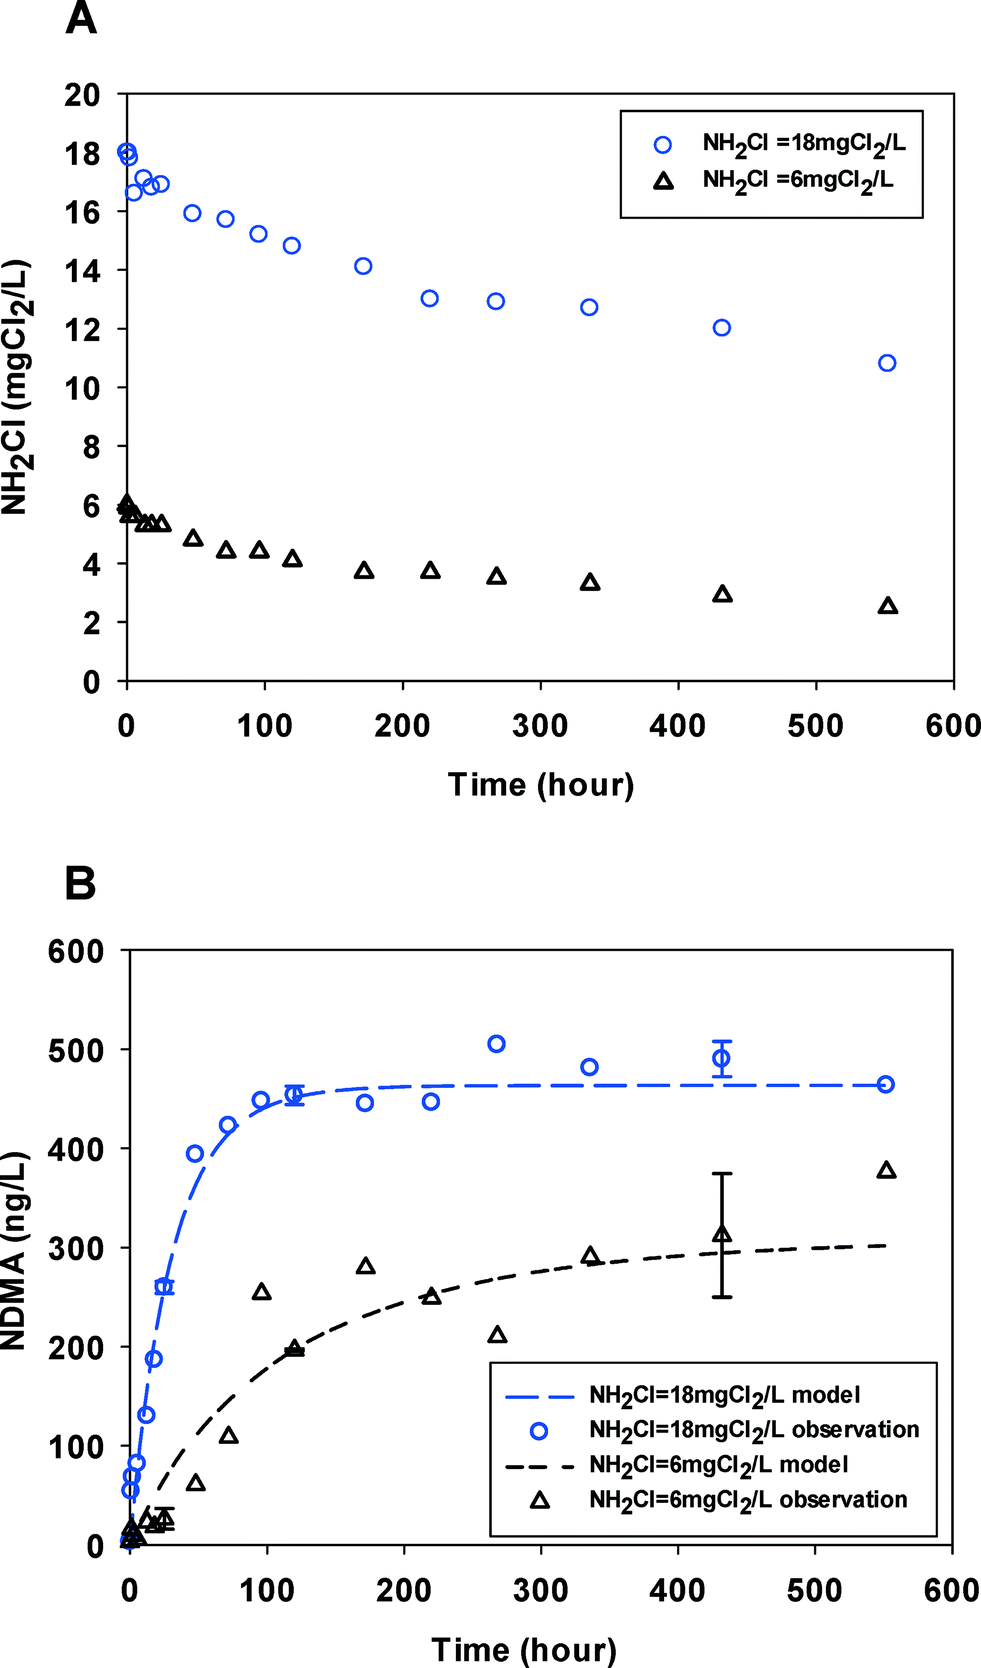 | ||
| Fig. 1 (A) Monochloramine (NH2Cl) decay kinetics in WW1 for two initial monochloramine doses. (B) NDMA formation observed (symbols) and fitted by eqn (2) & (3) (lines). Error bars represent one standard deviation (n = 3) for select time points (pH = 8.2, temperature = 23 ± 1 °C). | ||
Table 1 summarizes NDMAmax values for each experiment. In the wastewater effluent samples, NDMAmax ranged from 4 to 12 nM. There was no correlation found between NDMAmax and DOC or UV254, similar to statistical analyses presented elsewhere.26,27 In all cases, higher monochloramine doses led to 30% to >50% higher NDMAmax values. This was unexpected because even at very long reaction times there was adequate oxidant residual present to react with NDMA precursors. Although monochloramine is the dominant chloramine species in our test (pH = 8, N:Cl2 molar ratio 1.2:1), dichloramine, the disproportionation product from monochloramine, was still present according to the equilibrium:
| 2NH2Cl + H+ ↔ NHCl2 + NH4+ | (1) |
It has been reported that dichloramine is responsible for greater NDMA formation from NDMA precursors such as DMA.16,21 Additionally, NDMA precursors were found to react preferably with either monochloramine or dichloramine.17,28 Thus, in our experiment, even trace levels of dichloramine formed could affect the maximum NDMA formation. At higher doses of monochloramine there would be more dichloramine enhancing the NDMA formation and in contrast a low monochloramine concentration solution would contain less dichloramine, resulting in less NDMA formation.
| Sample ID | Source | DOC (mgC L−1) | UV254 (cm−1) | Upon monochloramine addition | ||||
|---|---|---|---|---|---|---|---|---|
| Monochloramine dose (mgCl2 L−1 [μM]) | pH | NDMAmax (nM) | k app (M−1 s−1) | R 2 | ||||
| a Data of NDMA formation and monochloramine were from Chen and Valentine, 2006. | ||||||||
| WW1 | Wastewater | 4.6 | 0.12 | 18 [254 μM] | 8.2 | 6 | 0.04 | 0.99 |
| 6 [85 μM] | 4 | 0.04 | 0.95 | |||||
| WW2 | Wastewater | 6.17 | 0.15 | 20 [282 μM] | 8.0 | 7 | 0.04 | 0.97 |
| 7 [99 μM] | 2 | 0.04 | 0.88 | |||||
| WW3 | Wastewater | 5.83 | 0.14 | 20 [282 μM] | 8.0 | 12 | 0.07 | 0.95 |
| 7 [99 μM] | 9 | 0.05 | 0.98 | |||||
| WW4 | Wastewater | 5.32 | 0.17 | 20 [282 μM] | 8.0 | 12 | 0.08 | 0.96 |
| 7 [99 μM] | 8 | 0.08 | 0.92 | |||||
| WW5 | Wastewater | — | — | 20 [282 μM] | 8.0 | 8 | 0.08 | 0.97 |
| 6 [85 μM] | 5.5 | 0.09 | 0.96 | |||||
| SW1 | Lake | 3.88 | 0.08 | 36 [507 μM] | 8.0 | 0.7 | 0.01 | 0.91 |
| 12 [169 μM] | 0.4 | 0.02 | 0.91 | |||||
| GW1 | Groundwater | 1.78 | 0.05 | 20 [282 μM] | 8.0 | 0.2 | 0.04 | 0.91 |
| 7 [99 μM] | 0.2 | 0.06 | 0.89 | |||||
| SW2a | River | 3.4 | — | 3.5 [50 μM] | 8.0 | 0.3 | 0.09 | 0.96 |
NDMA formation kinetics in surface waters
Despite having DOC concentrations of similar order of magnitude, NDMAmax values in the surface water (3.9 mgC L−1) were approximately an order of magnitude lower than in wastewater (DOC 4.6–6.2 mgC L−1) (Table 1). Fig. 2 shows that the reaction proceeded over hundreds of hours before NDMA approached a maximum concentration. NDMA formation was less and slower in surface water samples than in wastewater. Monochloramine residual slowly decayed during the experiments and was present throughout the duration of the experiments. In our test in surface water at two monochloramine doses (Fig. 2), the quick NDMA increase within hours possibly indicated the fast reaction part of NDMA and the slow NDMA increase thereafter showed a slow and rate limiting step of NDMA formation. Similar NDMA formation kinetics tests from natural organic matter (NOM) in surface water were made by Chen and Valentine.29 These authors separated NDMA precursors in NOM into two groups and postulated that the fast-reacting group reacts with monochloramine within hours while the slow-reacting group reacts with HOCl over days respectively. However, the fast-reacting group forming NDMA was not monitored in their work due to the low time resolution. Such fractionation of NDMA precursors remains controversial. The two kinetic parts (fast vs. slow) were not observed in the wastewater samples (Fig. 1, S1–S4†) in similar conditions (e.g. DOC and NH2Cl), possibly due to the difference in amine precursors between wastewater and surface water. Similar to wastewaters, NDMA formation in surface water at high monochloramine dose was enhanced, possibly due to presence of more dichloramine.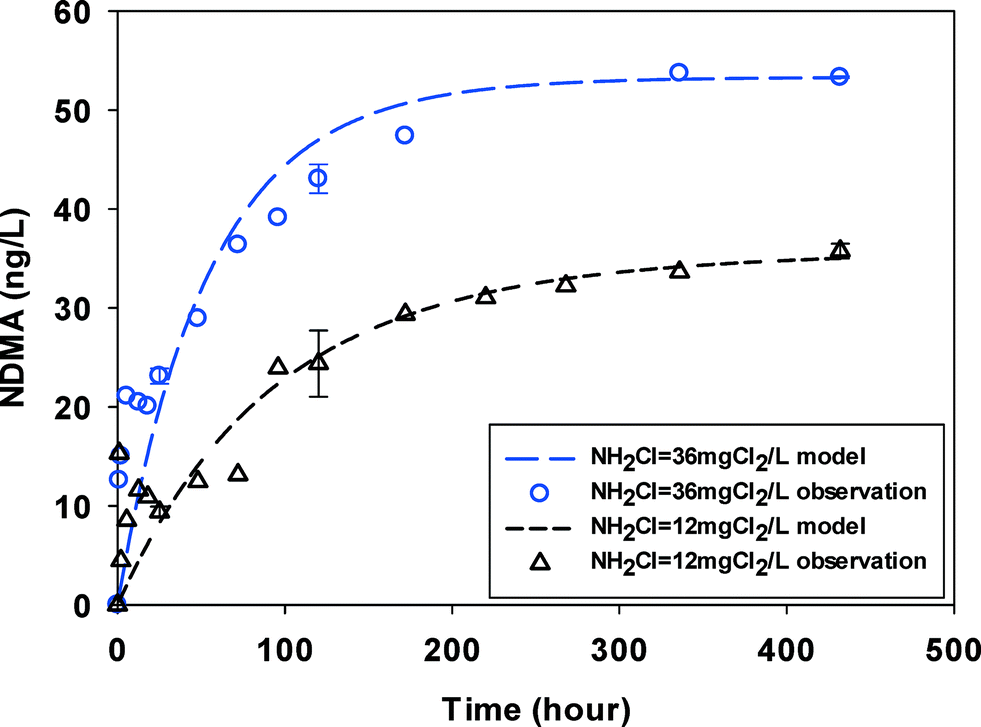 | ||
| Fig. 2 NDMA formation observed (symbols) and fitted by eqn (2) & (3) (line) in SW at two initial monochloramine doses. Error bars represent one standard deviation (n = 3) for select time points (pH = 8.0, 23 ± 1 °C). | ||
The groundwater had NDMAmax (15–20 ng L−1) on the same order of magnitude with, but lower than the surface water (30–50 ng L−1). It is possibly because it contained less DOC (1.78 mgC L−1) in groundwater. No two kinetic parts (fast vs. slow) were observed and NDMA formation reached maximum in less than 100 hours (Fig. 3) at two monochloramine doses.
 | ||
| Fig. 3 NDMA formation observed (symbols) and fitted by eqn (2) & (3) (line) in GW at two initial monochloramine doses (pH = 8.0, 23 ± 1 °C). | ||
In summary, in all water samples the overall NDMA formation at high monochloramine dose was higher than at low monochloramine dose. Wastewaters showed higher NDMA formation (200–950 ng L−1) than surface waters (30–50 ng L−1) and groundwater (15–20 ng L−1). The reaction times for NDMA formation reaching its maximum were shorter when higher monochloramine doses were applied in wastewater and groundwater. No significant difference of such reaction times was found between the two doses of chloramine in surface water. The differences in NDMA formation potential are due to the various types and concentrations of precursors in the different source waters. Precursors such as DMA, which is more reactive with dichloramine, may explain the higher and faster NDMA formation at higher doses of monochloramine.21 Recent research found that pharmaceutical compounds such as methadone, which was found in wastewater effluents have high yields of NDMA and could contribute to large fractions of total NDMA formed.30 It is possible that such high yield precursors are also more reactive to chloramines making the NDMA formation in wastewater relatively faster. So higher amine concentrations and higher levels of these known high yield NDMA precursors may be responsible for a higher overall NDMA formation in wastewater than in other water sources. Compared to the differences in NDMA yields in source waters, the differences in kinetics or rates were rather small. Molecular identification of NDMA precursors and NDMA formation kinetics of these precursors are needed to improve our understanding of NDMA formation in real waters.
Model fitting of NDMA kinetics
Three main pathways for NDMA formation have been proposed and are summarized in the ESI.† Initially we envisioned that different types of precursors may proceed along different mechanistic pathways to produce NDMA, involving a range of intermediates and potentially involving oxygen reactions. In tests performed in this work, fractions of NDMA precursors with different rates were not evident in surface water and were not observed in wastewater effluents. In addition, it was not practical to classify NDMA precursors (nM quantities) as either having higher or lower yields and presumably different reaction rates as they are water source specific. Based on NDMA and monochloramine concentrations observed in our kinetic experiments, NDMA formation was fit to eqn (2): for the reaction of NDMA precursors (P) in the presence of monochloramine (NH2Cl): | (2) |
:1 relationship between the disappearance of the precursor (P) and NDMA formation (m = 1). The rate order with respect to NH2Cl (n) was calculated ∼1 (n = 1.20 ± 0.41) by plotting log[NDMA formation rate] vs. log[NH2Cl] in the same time period for the same water at two NH2Cl doses. Therefore we used the second order expression (m = n = 1, eqn (2)) to fit to the data. The concentration of NDMA at any time ([NDMA(t)]) is related to the maximum amount of NDMA precursors available for reaction in an experiment ([P]0 = [NDMAmax]) as follows:| [NDMA(t)] = [P]0 − [P]t | (3) |
Although dichloramine was thought to react with precursors forming NDMA, the model did not use dichloramine as a reactant variable. One reason is that the measurement of dichloramine is time consuming and more complicated compared to that of monochloramine.31 Additionally, under our experimental conditions (pH = 8.0) the NHCl2/NH2Cl ratio would be constant because the system is in equilibrium during the reaction time.32,33 Thus dichloramine could be represented as ratio of monochloramine and its reaction could also be fit with our model empirically, leading to an apparent rate constant kapp.
Using this modeling approach, NDMA formation in treated wastewaters and in surface waters was well fit with correlation coefficients (R2) greater than 0.9 in most tests. Optimized data fits were achieved using Kintecus.34 Model fits of experimental data are shown in Fig. 1–3. In wastewater effluents tests, the model overestimated the NDMA in the beginning of the test (<50 h) at low doses of monochloramine, showing a ‘lag period’ of NDMA formation. Such a ‘lag-period’ was observed in previous studies of NDMA formation from pharmaceutical compounds (e.g. ranitidine) as NDMA precursors at similar monochloramine dose (6 mg Cl2 L−1) in surface waters.16 In work conducted by Shen and Andrews, the lag and a subsequent initiation of NDMA formation from selected pharmaceuticals were successfully modeled with a dose–response curve.16 The lag and the rate constants were found correlated to TOC and SUVA values for certain pharmaceuticals. It was suggested that there was NOM-pharmaceutical binding that inhibited the initial NDMA formation.16 A similar lag-period was interpreted as indicating the possible interactions of pharmaceutical compounds with wastewater organics. A similar dose–response curve model was applied to our kinetics data. The NDMA formation was well represented with a similar correlation coefficient than in our kinetic model (R2 > 0.9) (Table S1†). The wastewater effluent samples with the ‘lag-period’ were better fit with the dose–response curve model than our proposed model. However, the rate constant k (h−1) derived from the dose–response model showed broad variations, ranging from 0.007 h−1 to 0.175 h−1 for surface water and wastewater respectively. No correlation was found between water quality (e.g. TOC and SUVA) and model parameters (e.g. lag and rate constant k). The dose–response model also did not take into account the role of monochloramine dose, which in our kinetic experiments, impacted NDMA FP and the reaction kinetics. Finally the dose–response model is purely descriptive and does not provide insight into the underlying formation mechanisms, especially in complex water matrices.
Table 1 summarizes fitted kapp and R2 values for all experiments. The magnitude of kapp values fall within a relatively narrow range of less than one order of magnitude (0.01–0.09 M−1 s−1). The goodness of fit of the model, represented by eqn (2) and (3), was evaluated by comparing observed NDMA formation data and model prediction in Fig. 4. The small 95% confidence intervals suggested significant correlation between model-predicted and observed NDMA formation. Data in Chen and Valentine's 2006 work on NDMA formation from NOM was also fit with our model and the kapp (0.09 M−1 s−1) was similar to that of our wastewater and surface waters. A narrow range in kapp values was surprising given the very different precursors expected in varying source waters and the order of magnitude differences in NDMAmax between sources.
 | ||
| Fig. 4 Linear correlation between model predictions and observations of NDMA concentrations in all waters. Data from all reaction time periods are included. | ||
Most mechanistic work on NDMA formation during chloramination has been conducted with secondary amines such as DMA.21 It has been suggested that during chlorination some tertiary amines could decay to secondary amines forming NDMA upon subsequent chloramination.22 It was still unclear if such transformation reaction between amines or NDMA formation from amines was a rate limiting step. The small variance of rate constants suggests that reactions like degradation of higher order amines to secondary amine precursors, if there any were present, are rapid compared to NDMA formation. This is in agreement with the short half-life (<14 h) of trimethylamine (TMA) decomposing to DMA in presence of monochloramine and indicates that amine precursor groups, including secondary amines and tertiary amines with either low or high yields, probably have a similar rate limiting step forming NDMA in our tests.
We propose a general reaction pathway of NDMA formation from chloramination of NDMA precursors in treated wastewaters and surface waters. Precursors that include anthropogenic chemicals or natural biomolecules rapidly react with chloramines to produce intermediates. The yield of intermediates depends upon types of precursors (e.g. secondary or tertiary amines, β-aryl amines) and monochloramine dose. The intermediates then function as the precursors (P) and the subsequent conversion from intermediates (P) to NDMA undergoes a second order reaction mechanism in the presence of oxidant such as monochloramine.
Monochloramine exposure
Oxidant exposure has been used as a parameter in many oxidation reactions (e.g. ozonation) when modeled as second order reactions in waters to investigate reaction kinetics.35,36 In this work NDMA formation was modeled as a second order reaction in eqn (2), which can be integrated (eqn (4)) with ∫[NH2Cl]dt being the monochloramine exposure.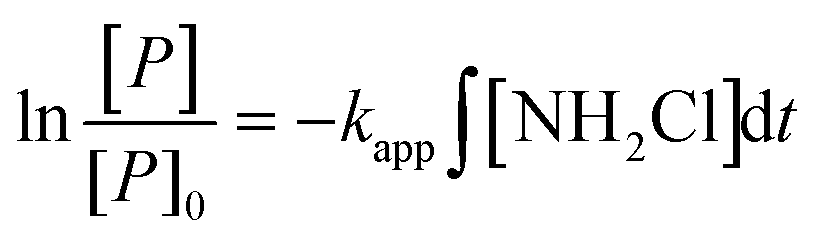 | (4) |
Eqn (4) offers another way of quantifying the apparent second order rate constant kapp. In addition, it shows ([P]/[P]0), the relative conversion of NDMA precursor, is related to the NH2Cl exposure. Fig. 5 shows the plots of [P]/[P]0 against NH2Cl exposure for water samples at low and high NH2Cl doses. In different water samples, the reaction required different NH2Cl exposure for the same conversion of precursors. The rate constants varied by water sources, possibly due to the varying precursor groups and their different reactivity with NH2Cl or NHCl2. From the previous discussion in this work NH2Cl dose determines the NDMAmax even in the same water sample, but does not affect the rate constants in wastewater and groundwater. The relative change of precursors (or increase of NDMA formation) had the same kinetics for the same water at different NH2Cl doses (Fig. 5a–c, S5–S7†). Surface water represents an exception (Fig. 5d). The surface water had a lower kapp than all other waters tested. The relative change of precursors in surface water differed with low and high dose NH2Cl, especially when NH2Cl exposure is less than 5 × 10⁶ mgCl2 min L−1, possibly due to the ‘fast and slow’ reaction mechanism in surface water.
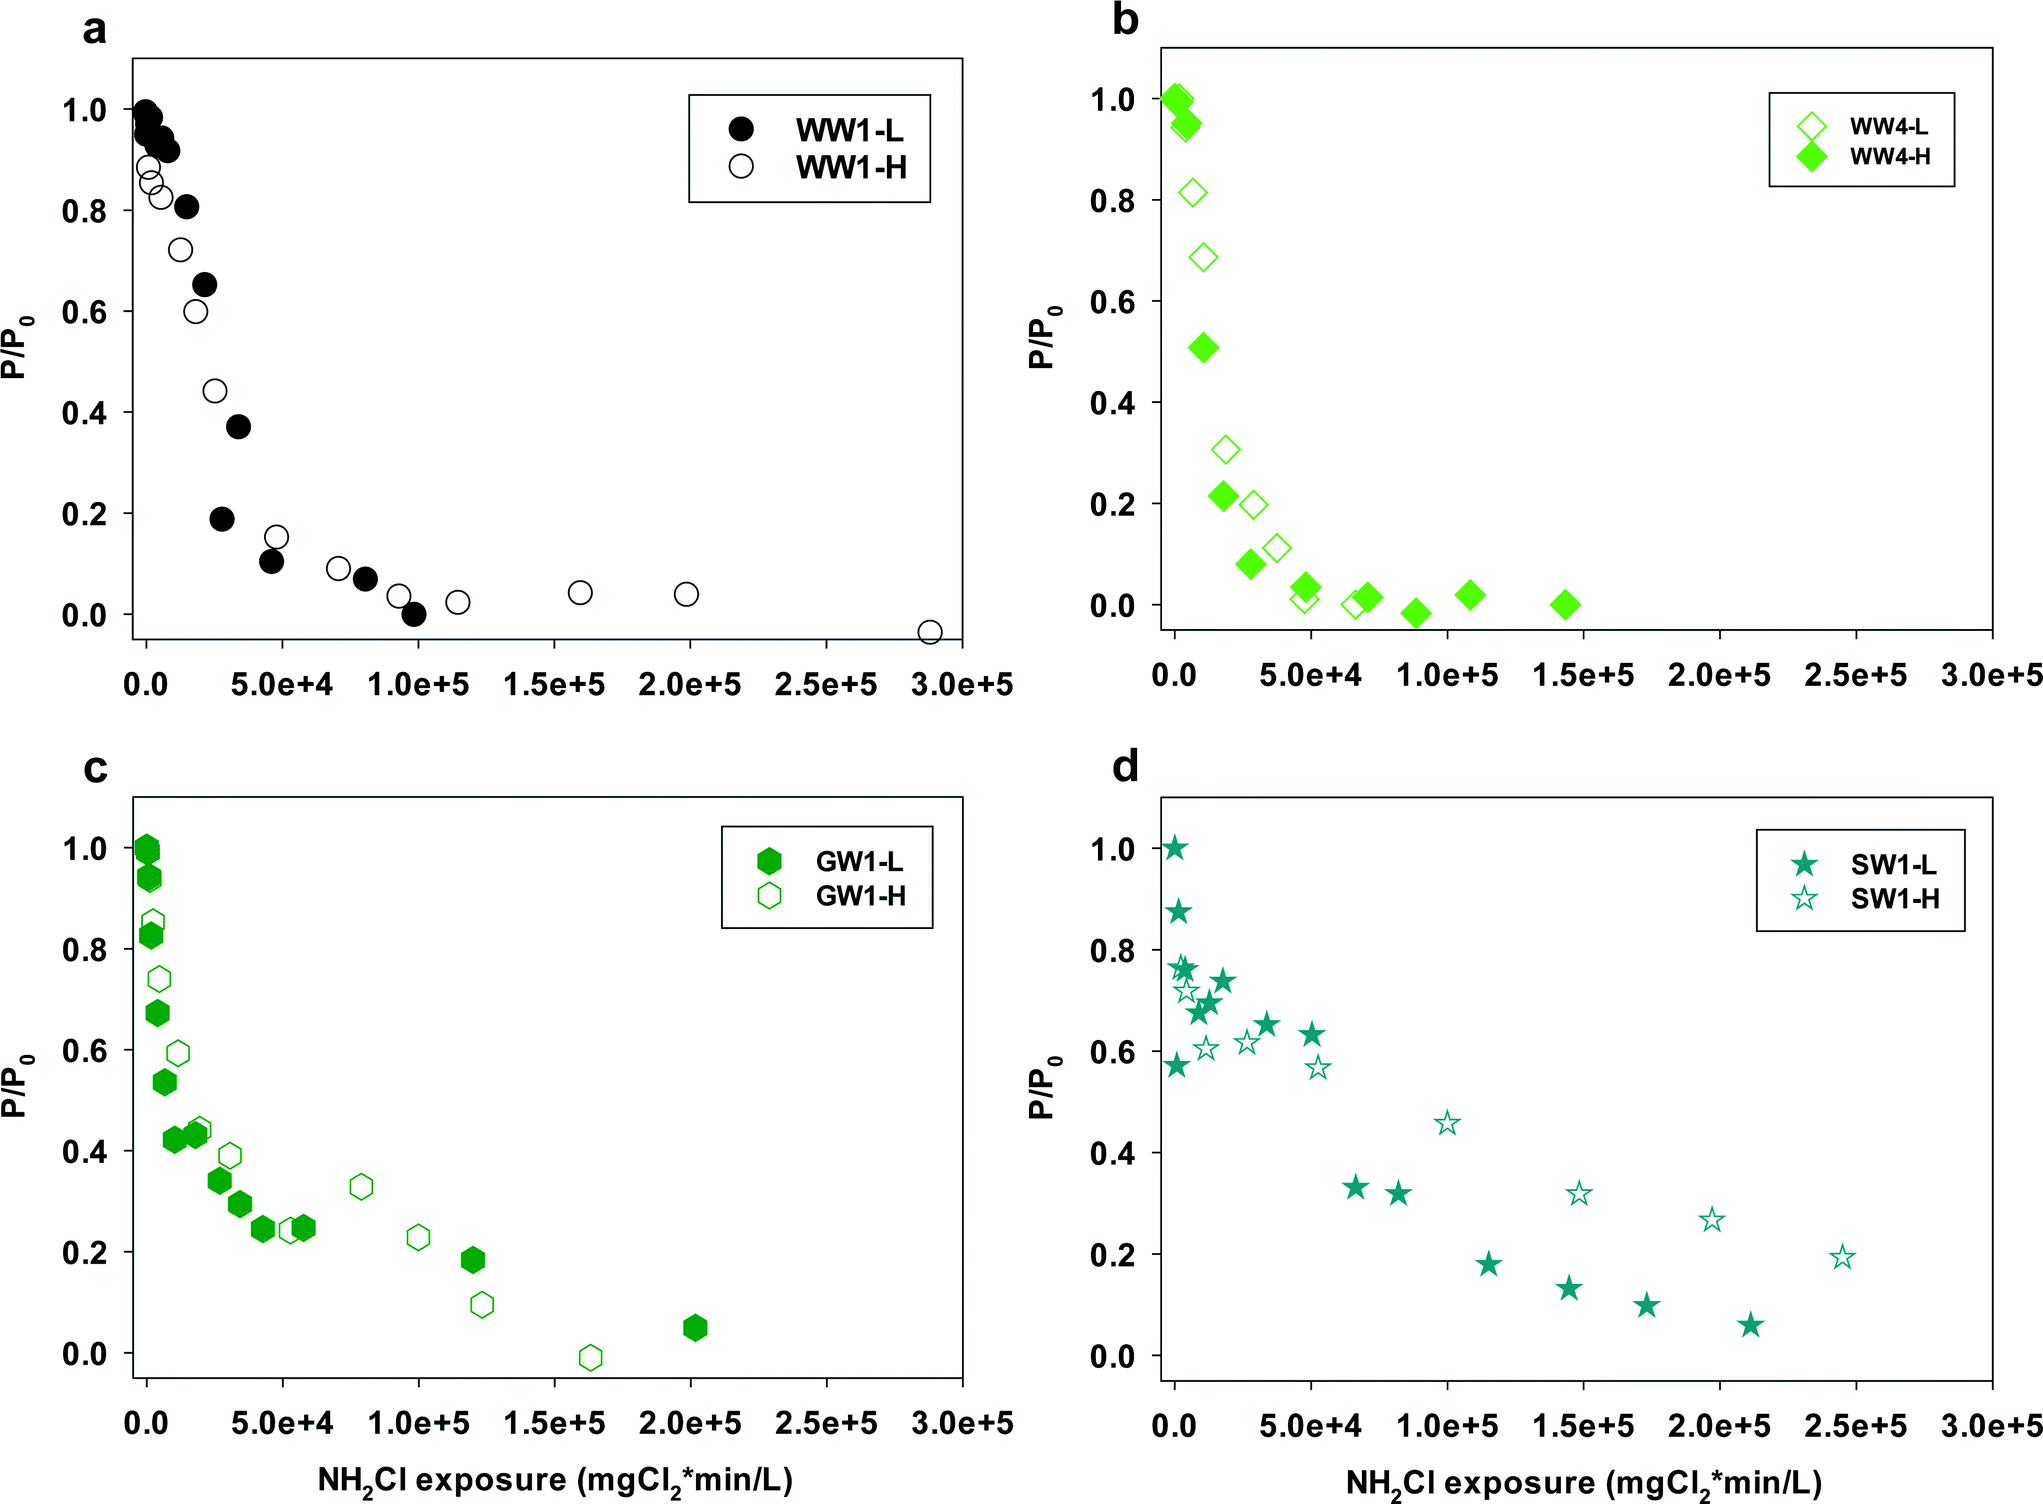 | ||
| Fig. 5 Plots of P/P0versus monochloramine exposure for water samples (a) WW1, (b) WW4, (c) GW1, (d) SW1. L = lower, H = higher, represent samples with lower or higher NH2Cl concentrations. | ||
In finished drinking water NH2Cl concentrations (<0.06 mM) are typically lower than those used in our test (0.09–0.51 mM). From our results, NDMA formation reaction kinetics are dependent upon NH2Cl exposure, not NH2Cl concentrations. The rate constants could be applied to waters with lower NH2Cl concentration and longer contact time ranges. NH2Cl exposure and the rate constants are the key parameters for the prediction of the transformation efficiency of NDMA precursors into NDMA. With a measurement of NDMAmax in site-specific sample and chloramine conditions, our proposed model provides a practical way to predict NDMA formation in drinking water influenced by wastewater effluents and surface waters in water plants and drinking water distribution systems.
Conclusions
NDMA formation potential and formation kinetics during chloramination were investigated in wastewater and surface water samples. Under reaction conditions in our experiments (pH = 8.0, NH2Cl = 0.09–0.51 mM) NDMA formation increased to its maximum over hundreds of hours. NDMA maximum conversion was found to be dependent on the preformed monochloramine in the water samples.A simple second order NDMA formation model of reactions between amine precursors and monochloramine was developed. NDMA formations were well predicted by the model with correlation coefficients higher than 0.9 in most cases. The modeled rate constants for different water samples were found surprisingly within a narrow range (0.01–0.09 M−1 s−1), indicating a possible rate limiting step of NDMA formation for different amine precursor groups. With only two simple measurements (NDMA formation potential and monochloramine exposure), our model provides a practical way to predict NDMA concentrations in distribution system.
Our proposed model was validated at pH 8 and monochloramine doses between 0.09 mM to 0.51 mM with wastewater effluents and surface water samples. It would be of value to extend the work further in a larger variety of water matrices and reaction conditions such as pH, N:Cl2 ratio and dissolved oxygen level, to simulate a larger variety of water treatment plants or distribution systems. Additionally, characterization or profiling of the precursors of NDMA and chloramination kinetic studies of more model precursors are needed to better understand different pools of precursors and how they could interact or contribute to NDMA formation in different water systems.
Acknowledgements
This research was supported by the Water Research Foundation (Project 4499, managed by Djanette Khiari), American Water Works Association Abel Wolman Fellowship, Water Environment Federation Canham scholarship, and the Arizona State University Fulton School of Engineering Dean's Fellowship.References
- S. W. Krasner, W. A. Mitch, D. L. McCurry, P. Westerhoff and D. Hanigan, Water Res., 2013, 47, 4433–4450 CrossRef CAS PubMed.
- USEPA. Contaminant Candidate List 3 (CCL3). 2009. http://water.epa.ov/scitech/drinkingwater/dws/ccl/ccl3.cfm (accessed September 26th, 2014).
- C. G. Russell, N. K. Blute, S. Via, X. Wu, Z. Chowdhury and R. More, J. - Am. Water Works Assoc., 2012, 104, E205–E207 CrossRef.
- USEPA. Risk-Based Screening Table. 2015. http://semspub.epa.gov/work/03/2218450.pdf (accessed September 26th, 2015).
- OEHHA, Public Health Goal for N-Nitrosodimethylamine in Drinking Water, Office of Environmental Health Hazard Assessment, CA, 2006 Search PubMed.
- CDPH, NDMA and other nitrosamines - Drinking water issues, 2013. http://www.waterboards.ca.gov/drinking_water/certlic/drinkingwater/NDMA.shtml (accessed September 26th, 2014 ).
- S. W. Krasner, M. J. Sclimenti and C. F. T. Lee, Proccedings of AWWA Water Qualility Technology Conference, Denver, CO, 2012 Search PubMed.
- S. W. Krasner, P. Westerhoff, W. A. Mitch and J. Skadsen, Proccedings of AWWA Water Qualility Technology Conference, Toronto (ONT.), 2012 Search PubMed.
- R. L. Valentine, J. Choi, Z. Chen, S. E. Barrett, C. J. Hwang, Y. Guo, M. Wehner, S. Fitzsimmons, S. A. Andrews, A. G. Werker, C. Brubacher and K. D. Kohut, Proccedings of AWWA Water Qualility Technology Conference, Denver, CO, 2005 Search PubMed.
- S. W. Krasner, P. Westerhoff, B. Chen, B. E. Rittman and G. Amy, Environ. Sci. Technol., 2009, 43, 8320–8325 CrossRef CAS PubMed.
- D. Liang, K. L. Linge, C. Joll, A. Heitz, R. Trolio, L. Breckler, R. Henderson and J. W. A. Charrois, Proccedings of Oz Water Conference, 2011 Search PubMed.
- J. Choi and R. L. Valentine, Water Res., 2002, 36, 817–824 CrossRef CAS PubMed.
- C. Lee, C. Schmidt, J. Yoon and U. von Gunten, Environ. Sci. Technol., 2007, 41, 2056–2063 CrossRef CAS PubMed.
- I. M. Schreiber and W. A. Mitch, Environ. Sci. Technol., 2005, 39, 3811–3818 CrossRef CAS PubMed.
- J. Le Roux, H. Gallard and J. P. Croue, Environ. Sci. Technol., 2012, 46, 1581–1589 CrossRef CAS PubMed.
- R. Shen and S. A. Andrews, Water Res., 2011, 45, 944–952 CrossRef CAS PubMed.
- M. Selbes, D. Kim, N. Ates and T. Karanfil, Water Res., 2013, 47, 945–953 CrossRef CAS PubMed.
- D. Hanigan, E. M. Thurman, I. Ferrer, Y. Zhao, S. Andrews, J. Zhang, P. Herckes and P. Westerhoff, Environ. Sci. Technol. Lett., 2015, 2, 151–157 CrossRef CAS.
- W. A. Mitch and D. L. Sedlak, Environ. Sci. Technol., 2004, 38, 1445–1454 CrossRef CAS PubMed.
- I. M. Schreiber and W. A. Mitch, Environ. Sci. Technol., 2006, 40, 3203–3210 CrossRef CAS PubMed.
- I. M. Schreiber and W. A. Mitch, Environ. Sci. Technol., 2006, 40, 6007–6014 CrossRef CAS PubMed.
- W. A. Mitch and I. M. Schreiber, Environ. Sci. Technol., 2008, 42, 4811–4817 CrossRef CAS PubMed.
- R. Shen and S. A. Andrews, Water Res., 2011, 45, 5687–5694 CrossRef CAS PubMed.
- D. Hanigan, J. W. Zhang, P. Herckes, S. W. Krasner, C. Chen and P. Westerhoff, Environ. Sci. Technol., 2012, 46, 12630–12639 CrossRef CAS PubMed.
- J. W. A. Charrois, M. W. Arend, K. L. Froese and S. E. Hrudey, Environ. Sci. Technol., 2004, 38, 4835–4841 CrossRef CAS PubMed.
- B. Y. Chen and P. Westerhoff, Water Res., 2010, 44, 3755–3762 CrossRef CAS PubMed.
- H. Uzun, D. Kim and T. Karanfil, Water Res., 2015, 69, 162–172 CrossRef CAS PubMed.
- J. Le Roux, H. Gallard and J. P. Croue, Water Res., 2011, 45, 3164–3174 CrossRef CAS PubMed.
- Z. Chen and R. L. Valentine, Environ. Sci. Technol., 2006, 40, 7290–7297 CrossRef CAS PubMed.
- D. Hanigan, E. M. Thurman, I. Ferrer, Y. Zhao, S. Andrews, J. Zhang, P. Herckes and P. Westerhoff, Environ. Sci. Technol. Lett., 2015, 2, 151–157 CrossRef CAS.
- W. Lee, P. Westerhoff, X. Yang and C. Shang, Water Res., 2007, 41, 3097–3102 CrossRef CAS PubMed.
- K. Ozekin, R. L. Valentine and P. J. Vikesland, in Water Disinfection and Natural Organic Matter: Characterization and Control, ed. R. A. Minear and G.L. Amy, 1996, vol. 649, pp. 115–125 Search PubMed.
- J. Zhang, D. Hanigan, R. Shen, S. Andrews, P. Herckes and P. Westerhoff, in Recent Advances in Disinfection By-Products, American Chemical Society, 2015, pp. 79–95 Search PubMed.
- J. C. Ianni, Kintecus. Windows Version 2.80, http://www.kintecus.com (accessed September 20th, 2014), 2002 Search PubMed.
- U. von Gunten, Water Res., 2003, 37, 1443–1467 CrossRef CAS PubMed.
- M. K. Ramseier, U. von Gunten, P. Freihofer and F. Hammes, Water Res., 2011, 45, 1490–1500 CrossRef CAS PubMed.
Footnote |
| † Electronic supplementary information (ESI) available. See DOI: 10.1039/c5ew00234f |
| This journal is © The Royal Society of Chemistry 2016 |