Complex organic corona formation on carbon nanotubes reduces microbial toxicity by suppressing reactive oxygen species production
J. R.
Lawrence
*a,
G. D. W.
Swerhone
a,
J. J.
Dynes
b,
A. P.
Hitchcock
c and
D. R.
Korber
d
aEnvironment Canada, 11 Innovation Blvd., Saskatoon, SK S7N 3H5, Canada. E-mail: John.Lawrence2@canada.ca
bCanadian Light Source, University of Saskatchewan, 44 Innovation Blvd., Saskatoon, SK S7N 5A8, Canada
cBrockhouse Institute for Materials Research, McMaster University, Hamilton, ON L8S 4M1, Canada
dFood and Bioproduct Sciences, University of Saskatchewan, 51 Campus Drive, Saskatoon, SK S7N 5A8, Canada
First published on 14th December 2015
Abstract
Little is known about the fate of carbon nanotubes in aquatic environments. To investigate their interactions with dissolved organics and microorganisms, carbon nanotubes (CNTs) were exposed to natural river water in microcosms for 50 days. CNTs and developed biofilms were recovered and examined using scanning transmission X-ray microscopy (STXM). CNTs underwent extensive aggregation, forming bundles and flocs. CNTs were also integrated into developing biofilm and either became associated with the biology or acted as a scaffold for growth. STXM examination revealed the development of an extensive complex coating consisting of lipids, proteins, polysaccharides and carbonates. Single walled-CNT had a significantly greater affinity, on a per-unit material basis, for protein (2× more) and polysaccharides (10× more) relative to multi walled-CNTs. These bio-molecular coatings constitute a highly-modified surface chemistry influencing a range of functional properties, including the toxicity of these nanomaterials. Reactive oxygen species (ROS) are linked to CNTs toxicity; therefore, we compared ROS production in bacteria by “as-manufactured” with that by biofilm-coated CNTs. Fluorescence confocal laser microscopy using carboxy-H2DCFDA demonstrated a significant reduction in ROS production in bacteria exposed to coated CNTs. CNT-based toxicity will likely be rapidly attenuated when these materials enter aquatic environments. These observations contribute to understanding the fate and potential effects of CNTs in natural systems, and confirm the need to evaluate the impact of complex bio-molecular coatings on environmental effects of nanomaterials.
Nano impactThe environmental impact of nanoparticles in aquatic environments may be greatly influenced by adsorbed organic molecules or macromolecules on the NP surface. The interactions with microbial biofilm matrix components such as proteins, polysaccharides, and lipids are anticipated to impact bioavailability and toxicity of nanoparticles. This study demonstrates that nanoparticles such as carbon nanotubes undergo extensive material specific interactions including the development of complex coatings featuring polysaccharides, proteins, lipids and minerals. Furthermore, we show that these changes impact the toxicity of carbon nanotubes through reduction of reactive oxygen species production. Therefore, our study highlights the importance of examining micro and nanoscale events in understanding the fate and effects of these materials in the environment. |
Introduction
The development and application of nanotechnology has raised significant concerns regarding potentially adverse effects of nanoparticles (NPs) on human health and the environment.1–3 Carbon nanomaterials have a wide variety of applications.4–6 Their commercial scale production and use with growing demand increases concerns regarding the potential health and environmental effects of these materials.7 A major issue with regard to nanomaterials is the physical, chemical and biological transformations that they may undergo in the environment, along with subsequent interactions with biomacromolecules. In terms of environmental fate and effects, it is apparent that these nanomaterials may be modified upon entering the environment, undergoing aggregation,8 coating with organic matter and cations, as well as potential modification by oxidants or microorganisms.9,10 Kang et al.11 indicated that in aquatic and wastewater systems, CNTs were modified by natural organic matter (NOM), polysaccharides and other biomacromolecules. Such information is critical for risk assessment.12 Oxidation, dissolution and redistribution in the biota and associated macromolecules may occur for metal nanomaterials.13 We have suggested that abundant, highly-reactive exopolymeric substances (EPS) produced by the microbiota represent the most likely point of interaction for nanomaterials with the biological compartment of aquatic ecosystems. This is particularly true for biofilms and flocs, where both direct and indirect effects may occur as a result of bioaccumulation of particles and their dissolution products in the EPS pool along with potential introduction into the food web. A range of studies examining interactions of CNTs with NOM, which is ubiquitous in aquatic environments, report that NOM influences or controls the stability of nanomaterials.8,10,14–16 Battin et al.17 considered biofilms to be a major potential sink for nanomaterials in the environment, while Ikuma et al.18 focused on the critical nature of nanoparticle biofilm interactions.Sacchetti et al.19 have detected the coating of CNTs by organic and inorganic materials in the environment, as well as by plasma proteins in blood. Microscopy-based approaches are critical to achieving the goals of detection and assessment of fate for a broad range of nanomaterials. Scanning transmission X-ray microscopy (STXM)20 is a technique that can be used effectively to assess interactions of nanomaterials and their fate in complex systems such as microbial biofilms. As we have demonstrated, STXM can provide detailed in situ information on the biochemistry, structure and composition of biofilms, bioflocs and their associated materials in hydrated environments at a minimum resolution scale of ∼30 nm.21–25 It is essential to study the behaviour of NPs in the context of complex microbial communities and at the appropriate scale. STXM combines the chemical sensitivity of NEXAFS spectroscopy at the C-1s edge with high spatial resolution (30 nm or better) and has been proven to be capable of mapping the biochemical composition of bacteria and biofilms at a subcellular scale, as well as the speciation of metals.13,22–24 Thus, STXM is well suited to test hypotheses regarding the fate of nanomaterials in the environment.
Carbon nanomaterials have been shown to inhibit the growth and activity of a range of microorganisms in pure culture and mixed microbial community exposures, including bacteria and protozoa.11,26–29 A major mechanism for toxicity of carbon-based nanomaterials is the generation of reactive oxygen species (ROS) that can damage cells.30,31 These may be generated by exposure to sunlight, or even by ozonation and ultrasonication.3 Some have suggested that physical damage may also occur via direct physical puncturing by multi-walled carbon nanotubes (MWCNTs) and single-walled carbon nanotubes (SWCNTs). However, Krishnamoorthy et al.31 demonstrated that this mechanism was not significant relative to ROS production. It has also been noted that the release of toxic metals from the catalyst materials used to synthesize CNTs may account for toxicity in some studies.32,33
We have focused on the fate and effects of two main types of CNTs: i) SWCNTs, which are single-layered graphitic cylinders having diameters on the order of a few nanometers, and ii) MWCNTs, which contain between 2 and 30 concentric cylinders with outer diameters commonly between 30 and 50 nm. CNT lengths vary substantially and often range from 100 nanometers to 10 or more micrometers.3 Following exposure to natural river water and developing complex microbial communities, the corona/coating on SWCNTs and MWCNTs was analysed by STXM at the C 1s edge, and ROS production of conditioned and “as-manufactured” CNTs was compared using a fluorescence-based CLSM assay.
Materials and methods
Microcosm operation
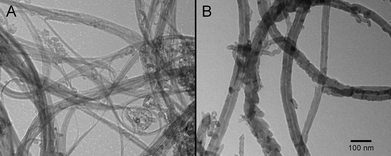
The experimental set-up and reactor design for biofilm development has been described in detail previously.34,35 Natural river water (South Saskatchewan River, Saskatoon, SK, Canada) was used as inoculum and as a source of carbon and nutrients. CNTs were added directly to the individual reactors using a peristaltic pump. CNTs were obtained from M K Impex, Canada, (MKnano) Mississauga, ON., with the following properties: MWCNT (CAS# 99685-96-8) purity >95%, dimensions OD >50 nm/ID 5–15 nm/length 10–20 μm, specific surface area >40 m2 g−1, bulk density 0.05 g cm−3; whereas the SWCNT (CAS# 308068-56-6), purity >95%, dimensions OD 1–2 nm/length 5–30 μm, specific surface area >490 m2 g−1, bulk density 0.14 g cm−3. Fig. 1 shows typical transmission electron micrographs of “as-manufactured” SWCNT and MWCNT, in particular showing the much smaller diameter of the SWCNTs. Nutrient levels were assessed as described by Chénier et al.36 Typical water chemistry for the South Saskatchewan River, an oligotrophic, carbon-limited, alkaline pH system, is shown in Table 1.| Parameter | Spring | Summer |
|---|---|---|
| Conductivity (μmhos cm−1) | 451 | 429 |
| pH | 8.13 | 8.46 |
| Turbidity (NTU) | 2.7 | 5 |
| Ammonia (mg N l−1) | 0.04 | 0.03 |
| Nitrate–nitrite (mg N l−1) | 0.75 | 0.31 |
| Orthophosphate (mg P l−1) | 0.01 | 0.01 |
| Dissolved organic carbon (mg C l−1) | 3.5 | 3.0 |
| Total suspended solids (mg l−1) | 1 | 1 |
The reactors were maintained at 21 ± 2 °C. River water was pumped through the reactors at a rate of 500 ml per day (one reactor volume) by using a multichannel peristaltic pump (Watson Marlow, Wilmington, MA). Treatments involved the addition of 500 μg L−1 of MWCNTs or SWCNTs to reactor influent waters during the biofilm development period. Microcosms receiving 0.1 mg L−1 CNTs were also operated to create biofilms with sufficient CNT material for the reactive oxygen species production assay (see below). In addition, control reactors were operated that received river water alone. Biofilms were grown under treatment and control conditions on polycarbonate coupons in replicate/triplicate bioreactors over a period of 50 days, at which time coupons were removed for immediate analysis. After incubation, the biofilm (∼40 μm thick) was aseptically scraped from the surface with a sterile silicone spatula and placed in a sterile 1 mL centrifuge tube. No homogenization of the sample was undertaken, as the goal was to look at as intact a biofilm as possible.
Transmission electron microscopy
Samples of “as-manufactured” CNTs were mounted on ultrathin Carbon Type-A, 400 mesh, copper grids (Ted Pella, Inc., Redding, CA) and imaged using a Philips 410 EM transmission electron microscope equipped with a Mega View III soft imaging system video camera.Scanning transmission X-ray microspectroscopy and confocal laser scanning microscopy
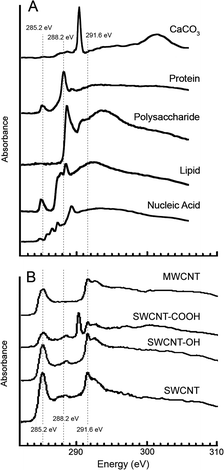
All STXM samples were prepared by deposition of 1–5 μL of the “as-manufactured” CNTs in deionized water, or collected biofilm material onto Si3N4 windows (1 × 1 mm by 100 nm thick on a 5 × 5 mm-sized 200 μm thick Si3N4 chip, Norcada Inc., Edmonton, Canada). Prepared STXM samples of the biofilm material on Si3N4 windows were analyzed by confocal laser scanning microscopy (CLSM) using a Nikon-C2 confocal laser microscope attached to a Nikon Eclipse 80i standard light microscope and equipped with 488/543/633 nm excitation, as well as reflection and transmission imaging (Nikon, Chiyoda, Tokyo, Japan). The fluorescent stains, Syto9 (Life Technologies, Burlington, ON, Canada) and Triticum vulgaris lectin-TRITC (Sigma, St. Louis MI), were used to visualize bacterial cells and exopolymer, respectively, as previously described.37 This approach also allowed the selection of representative biofilm areas that could then be systematically analysed using STXM.STXM at the C 1s edge was performed on the spectromicroscopy (SM) beamline 10ID-1 at the Canadian Light Source (CLS), Saskatoon, SK, Canada.38 The beamline was operated at an energy resolving power of E/ΔE ≥ 3000. All samples were analyzed in 1/3 atmosphere of He. After each analytical measurement, an image was recorded at 289 eV, an energy which readily visualizes radiation damage to polysaccharides, the most easily damaged chemical component. The extra-cellular matrix polysaccharide signal was reduced by less than 20% as a consequence of beam damage in the worst case of the measurements reported. The microscope energy scale was calibrated to an accuracy of ±0.05 eV using sharp gas phase signals, typically the Rydberg peaks of CO2. STXM was used analytically by measuring image sequences at specific energies39 or from image difference maps, which are the differences between on- and off-resonance images. Representative absorption spectra for the target species (MWCNT, SWCNT, protein, lipid, exopolysaccharide, CaCO3) were obtained by placing these species on Si3N4 windows and performing C 1s scans using STXM at the SM beamline. Results of these spectral scans are shown in Fig. 2A and B.
The as-measured transmitted X-ray signals were converted to optical densities using the incident flux measured in the Si3N4 window devoid of sample to correct for absorbance by the window. In analytical mode STXM was used to collect spectro-microscopic datasets consisting of thousands of spectra representing the sum of the contributions of all species present. This data was then converted to quantitative component maps of for example, protein, lipid, polysaccharide, CO3 and CNTs derived from image sequences measured between 280 eV and 320 eV by using singular value decomposition to fit the spectrum at each pixel to a linear combination of reference spectra (Fig. 2A and B) recorded from pure materials of the components suspected to be present. The analysis methods have been described extensively elsewhere.20 Data analysis was performed using aXis2000.40 A total of twenty one locations (n = 21) were quantitatively analysed for CNT, protein, lipid, polysaccharide and calcium carbonate content. Analyses of variance (ANOVA) as well as principle components analyses (PCA) were used to assess significant differences between treatments (p < 0.05).
ROS production
Reactive oxygen species production was detected using the Image-iT™ LIVE Green Reactive Oxygen Species Detection Kit based on 5-(and-6)-carboxy-2′,7′ dichlorodihydrofluorescein diacetate (carboxy-H2DCFDA) (Life Technologies, Burlington, ON, Canada). This assay is considered a reliable fluorogenic marker for ROS in living cells and was applied in accordance with the manufacturer’s instructions (Life Technologies). To confirm the generation of ROS by CNTs, a well-characterized biofilm-forming organism, Pseudomonas fluorescens strain 840406E,41 (selected for its ability to attach to glass surfaces, facilitating coupon preparation), pre-loaded with carboxy-H2DCFDA and to which was added a defined concentration of “as-manufactured” CNTs or CNTs that were aged in biofilm (continuous illumination in South Saskatchewan River Water see Microcosm operation above) at an exposure concentration of approximately 0.1 mg mL−1, was prepared for examination using CLSM. Immediately after adding the “as-manufactured” CNTs and gently mixing the sample 10 μl of the mixture was applied to a glass slide, covered with a #1 glass coverslip and the edges sealed with clear fingernail polish. The preparation was then observed with CLSM, 488 nm excitation fluorescence and phase contrast transmission imaging (Nikon, Chiyoda, Tokyo, Japan) to detect the presence of the green fluorescence indicative of ROS stress and non-fluorescent cells, respectively. A positive control was produced by exposing bacterial cells to the common inducer of ROS production, tert-butyl hydroperoxide (TBHP), and generating a ROS-positive fluorescence signal (Fig. 3).Experimental design
MWCNT and SWCNT were added to rotating annular reactors during a 50 day developmental interval. Two CNT treatment levels were applied: 500 μg L−1 and a higher concentration 0.1 mg L−1. The latter concentration allowed sufficient accumulation of CNTs in biofilm to allow coupon production and visualization for the ROS assays. Following the incubation/development period biofilm materials with associated CNTs were removed and either transferred to Si3N4 windows for STXM analyses or used to make coupons for ROS assays. X-ray absorption spectra for protein, lipid, polysaccharide, nucleic acids. CaCO3 MWCNTs, and SWCNTs were used to create component maps of these species in biofilms (n = 21). Analysis of variance and PCA analyses were applied to determine significant differences in the distribution/quantity of organic species associated with CNTs.Results and discussion
Carbon nanotubes have remarkable electrical, chemical and physical properties – in general, they are highly reactive structures.42 There are numerous reports of their sorption of organic chemicals,43 natural organic matter, polysaccharides and other biomacromolecules.9,11 A significant question is whether, and to what extent, the “as-manufactured” properties of the CNT dominate its behaviour, toxicology, etc. versus the nature and influence of the adsorbed coating or corona that forms upon entering the aquatic environment. It is clear that physicochemical modifications, such as capping, bundling, etc., alter the toxicity of CNTs.18,44 Luongo and Zhang27 suggested that microbial EPS associated with flocs provide protection from CNTs. Quigg et al.45 similarly reported that the exopolymeric substances produced by algae reduces the bioavailability and toxicity of engineered NPs in the water column and food web. Other studies have reported that the nanoscale coating that develops on nanomaterials in the environment always reduces toxicity.12,46 This is presumably due to masking of the NP effect, most likely by directly coating the surface or by limiting its dissolution. Indeed, Petersen et al.3 suggested that interactions with NOM might make the initial surface chemistry unimportant, indicating that this should be an important topic for future research, while the review of Ikuma et al.18 confirms the importance of coatings and biofilms in the fate and effects of NP.To date most research has used extracted NOM for environmental studies12 or EPS from pure cultures,45 rather than the complex array of macromolecules present in natural systems. Limited characterization of the protein corona formed on CNTs following exposure to fetal bovine serum and human blood plasma has been reported based on extractive methods.19,47,48 However, Lowry et al.12 noted that there are an “endless number of biomacromolecules” that may interact with nanomaterials in the environment. These include proteins, polysaccharides, peptidoglycans, lipids, humic/fluvic acids, and a wide range of poorly defined products of the decomposition of bacteria, algae, and plants in the aquatic environment.12,49,50
The review of Petersen and Henry51 indicates that there are a range of methods that may allow detection of fullerenes and CNTs, including electron energy loss spectroscopy, coherent anti-stokes Raman scattering microscopy (CARS), UV/vis spectroscopy, which may be interfered with by the presence of other biomolecules such as lipids. Fourier-transformed infra-red (FTIR) spectroscopy may be effective if the spectra are unique and Raman spectroscopy can be used to qualitatively detect CNTs in bio-matrices. Infra-red (IR) spectroscopy has also been used to detect coatings on nanomaterials, although the resolution of the technique is a limitation.52 Transmission electron microscopy is highly effective for characterization of nanomaterials, although detection of the associated corona may present a challenge due to its transparency. Thus, it appears there is a need for direct analyses of naturally-developed nanoscale coatings or coronas associated with nanomaterials. STXM provides a useful analytical and imaging technique for environmental samples, including biofilms and flocs.52,53 The resolution, sample thickness (up to 10 μm hydrated material), use of the X-ray absorption properties of the sample (imaging/spectromicroscopy), identity and mapping of metals, macromolecules, biomacromolecules (polymers, proteins, lipids), speciation of metals, reduced radiation damage relative to electron microscopy21,23,54 all make STXM a valuable but under-utilized tool for the study of nanomaterials.13
Initially, we determined C 1s absorption spectra for the target CNT species under investigation, following the approach described previously.21,22 The results indicated well-defined spectra similar to those reported elsewhere25 for MWCNTs and SWCNTs, allowing them to be detected in a complex sample and differentiated from associated species detected at the C 1s edge, including proteins, exopolysaccharides, lipids, etc. (Fig. 2A) as well as other carbon nanotubes such as those modified by carboxylation or hydroxylation21 (Fig. 2B).21 Furthermore, examination of “as-manufactured” CNT’s suspended in deionized water as reference materials did not reveal the presence of any organic coatings. Following these preliminary studies, we sought to map the presence of the target CNTs when they had been exposed to complex microbial communities and unfiltered natural river waters.
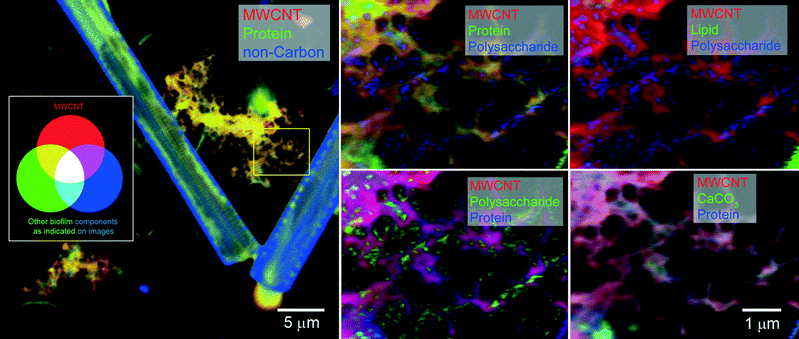
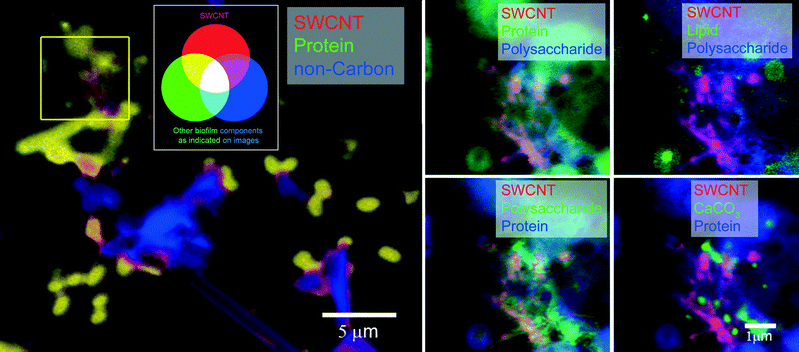
Fig. 4 and 5 show large-scale C 1s maps of exposed/coated MWCNTs and SWCNTs, respectively. The CNTs were detected in the context of complex microbial biofilms and organic coatings. Given the concentration upon addition, the CNTs likely underwent extensive homoaggregation, as well as heteroaggregation, before undergoing integration into the biofilm communities. At expected environmental concentrations, heteroaggregation would likely be the more dominant process, leading to greater interactions with dissolved organic matter and suspended solids. This may favour integration into microbial biofilms and bioaggregates. Each CNT exhibited a unique general distribution pattern with the MWCNT forming a meshwork (Fig. 4) upon which biofilm and organics accumulated versus the SWCNT which tended to occur as coatings on biofilm organisms and materials (Fig. 5). These differences may reflect the differences in size and possibly the stronger tendency for homoaggregation of the SWCNTs. All of these events would likely limit transportation/redistribution of CNTs in aquatic environments but may enhance their potential for entering the food web.
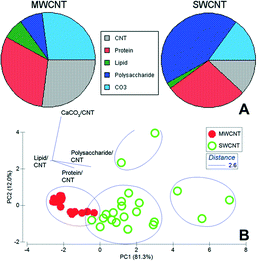
The morphology of the community is evident in the optical density component of the data stack, showing algae (diatoms, non-carbon = blue, Fig. 4), bacterial cells/colonies, while the chemistry of the macromolecular structures, including MWCNTs, SWCNTs, protein, polysaccharide, lipid, and calcium carbonate, are mapped. High-resolution mapping based on fitting the reference X-ray absorption spectra (Fig. 2) to the image sequences to identify pixels with matching spectra was carried out within defined sub-regions of the large-scale maps to enable analyses of all components. STXM analyses of biofilms confirmed the tendency for different CNTs to accumulate a halo, or corona, of various macromolecules including lipids, EPS and proteins. The results of analysis of multiple representative stacks taken at biofilm locations are summarized in Table 2, showing significant differences (p < 0.05, ANOVA) in the quantitative amounts of protein, lipid, polysaccharide and calcium carbonate detected in association with MWCNTs or SWCNTs. The differences in composition of the associated corona are also evident in the proportional graph (Fig. 6A) which illustrates the differences in amounts of the major macromolecules associated with each type of CNT clearly showing the increase in polysaccharide contribution in the SWCNT. The results of principle component analyses (PCA) of the data sets (Fig. 6B) show the nature of the drivers of the differences in the two CNT-exposed biofilm systems, illustrating the importance of polysaccharide and protein components in differentiating the coatings on SWCNTs from those on MWCNTs. It is also apparent that the quantity of polysaccharide detected associated with SWCNT is variable as indicated by the scatter in these points (Fig. 6B) and the variance (Table 2).
| MWCNT | 27 ± 4aa | SWCNT | 12 ± 4b |
|---|---|---|---|
| a Thickness in nanometers. Values followed by the same letter are not significantly different p < 0.05 ANOVA. n = 21 (##) = nm per unit of MWCNT or SWCNT. | |||
| Protein | 31 ± 12a (1.2 ± 0.6b) | 28 ± 6a | (2.7 ± 1.4a) |
| Lipid | 7 ± 10a (0.26 ± 0.38a) | 2 ± 3a | (0.14 ± 0.19a) |
| Polysaccharide | 8 ± 10b (0.37 ± 0.52b) | 43 ± 6a | (3.9 ± 1.3a) |
| CaCO3 | 27 ± 9a (0.99 ± 0.27a) | 15 ± 10b | (1.6 ± 1.4a) |
The STXM analyses suggest that both types of CNTs undergo relatively extensive conditioning, with the development of a complex macromolecular coating or corona. Of particular interest is that although the CNTs are exposed to identical conditions, the resultant coating is, in fact, significantly different (p < 0.05 ANOVA), presumably dictated by the underlying surface chemistry and various reactive mechanisms, including electrostatic, hydrogen bonding, and hydrophobic interactions. MWCNTs and SWCNTs accumulated similar amounts of protein (Table 2) but on a per-unit CNT basis SWCNTs had twice as much material. The amounts of lipid, and calcium carbonate accumulated by each CNT on a per-unit basis were very similar but SWCNTs had significantly (p < 0.05) more protein. The major difference was the apparently-significant high affinity of SWCNTs for polysaccharides where there was a more than 10× greater accumulation (Table 2).
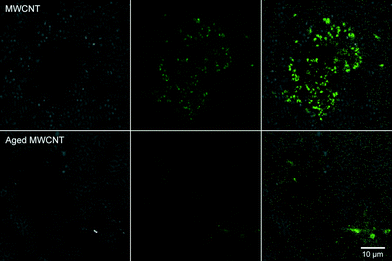
These coatings presumably dominate the properties of the modified CNT, altering composition, size, electrophoretic mobility and aggregation.11 The coatings may also control dissolution and short-range toxicity mechanisms, such as ROS production and potential palatability and entry into the food web. This is particularly true when interactions with flocs and biofilms are considered, since these represent foci for biogeochemical activity and a major source of carbon and energy in aquatic systems.17,55 Although Kang et al.11 reported that coating with NOM did not influence bacterial cytotoxicity of SWCNTs, the presence of coatings, in general, reduced the toxicity of nanomaterials and may reduce ROS production.3 Krishnamoorthy et al.31 demonstrated that the major source of bacterial toxicity for CNTs was generation of ROS by CNTs exposed to light. We hypothesized that a reduction in ROS production would occur for SWCNTs and MWCNTs after incubation with river water and during biofilm formation. To assess this, we used a well-defined, biofilm-forming organism Pseudomonas fluorescens strain 840406E (ref. 41) as a reporter strain in the ROS assay. After staining P. fluorescens cells with carboxy-H2DCFDA they were placed in contact with “as-manufactured” and biofilm-coated SWCNTs and MWCNTs. A coupon was created where contact between test material and stained cells were ensured, and the system observed with CLSM. The results (Fig. 7) clearly indicate that the short range ROS activity was attenuated since cells directly associated with the aged CNT masses did not fluoresce, indicating no ROS-induced stress. In contrast, the “as-manufactured” CNTs generated an ROS-positive signal.
Further, when the common inducer of ROS production, tert-butyl hydroperoxide, was applied (Fig. 3), a ROS-positive fluorescence signal was generated. Although there was evidence that bundling of CNTs may result in internal attenuation of ROS production to some degree, the similarity of sample preparations would mitigate against this mechanism. These observations confirm that short-range ROS generation is attenuated by these organic coatings. Similarly, Liu et al.56 indicated that exposure to ambient urban air resulted in organic coatings that significantly decreased cytotoxicity of SWCNTs. Metal contamination has also been proposed as a mechanism for bacterial cytotoxicity of CNTs;44,51 however, metal edge scans (data not shown) using STXM did not reveal detectable concentrations of nickel or other metals, and neither did ICP-MS analyses (data not shown) of water and biofilm materials. Thus, close CNT contact appeared to mediate generation of ROS within our test system. It is important to note that we have only examined two of a wide variety of CNTs, and that the properties of CNTs can vary considerably with even batch-to-batch variability in physiochemical properties, implying that while valid in the context of this study results may not be generalized to all CNTs.
Conclusions
MWCNTs and SWCNTs underwent extensive surface coating with the development of distinct complex organic coatings, including protein, polysaccharide, lipid, and calcium carbonate. STXM analyses indicated that the significant differences between coatings were due to the higher affinity of SWCNTs for protein, and in particular, polysaccharide. Indeed the coatings were more complex than the typical protein corona described for a variety of systems. Based on a fluorescent assay, a significant effect of CNT-coating was seen as a reduction in their short-range toxicities due to the production of ROS. These differences would presumably influence the environmental fate and impacts of CNTs, including their microbial toxicity, aggregation and potential entry into the aquatic food web. These results should contribute to risk assessment of CNTs and modeling environmental fate, while suggesting that additional further study is warranted regarding modification of CNTs through interactions with microbes and organics.Acknowledgements
This work was funded through Environment Canada’s Chemicals Management Plan. The Canadian Light Source (CLS) is supported by the Natural Sciences and Engineering Research Council of Canada, the National Research Council Canada, the Canadian Institutes of Health Research, the Province of Saskatchewan, Western Economic Diversification Canada, and the University of Saskatchewan. None of the authors have a relationship or financial interest constituting a conflict of interest with regard to the work described in the manuscript.Notes and references
- R. D. Handy, R. Owen and E. Valsami-Jones, Ecotoxicology, 2008, 17, 315–325 CrossRef CAS PubMed.
- R. D. Handy, F. von der Kammer, J. R. Lead, M. Hassellov, R. Owen and M. Crane, Ecotoxicology, 2008, 17, 287–314 CrossRef CAS PubMed.
- E. J. Petersen, L. Zhang, N. T. Mattison, D. M. O’Carroll, A. J. Whelton, N. Uddin, T. Nguyen, Q. Huang, T. B. Henry, R. D. Holbrook and K. L. Chen, Environ. Sci. Technol., 2011, 45, 9837–9856 CrossRef CAS PubMed.
- P. M. Ajayan, J. C. Charlier and A. G. Rinzler, Proc. Natl. Acad. Sci. U.S.A., 1999, 96, 14199–14200 CrossRef CAS.
- P. M. Ajayan and O. Z. Zhou, Carbon Nanotubes, 2001, 80, 391–425 CAS.
- P. Ball, Nature, 2001, 414, 142–144 CrossRef CAS PubMed.
- K. L. Dreher, Toxicol. Sci., 2004, 77, 3–5 CrossRef CAS PubMed.
- K. L. Chen and M. Elimelech, J. Colloid Interface Sci., 2007, 309, 126–134 CrossRef CAS PubMed.
- H. Hyung, J. D. Fortner, J. B. Hughes and J. H. Kim, Environ. Sci. Technol., 2007, 41, 179–184 CrossRef CAS PubMed.
- H. Hyung and J. H. Kim, Environ. Sci. Technol., 2008, 42, 4416–4421 CrossRef CAS PubMed.
- S. Kang, M. S. Mauter and M. Elimelech, Environ. Sci. Technol., 2009, 43, 2648–2653 CrossRef CAS PubMed.
- G. V. Lowry, K. B. Gregory, S. C. Apte and J. R. Lead, Environ. Sci. Technol., 2012, 46, 6893–6899 CrossRef CAS PubMed.
- J. R. Lawrence, J. J. Dynes, D. R. Korber, G. D. W. Swerhone, G. G. Leppard and A. P. Hitchcock, Chem. Geol., 2012, 329, 18–25 CrossRef CAS.
- S. Ghosh, H. Mashayekhi, P. Bhowmik and B. Xing, Langmuir, 2008, 24, 12385–12391 CrossRef CAS PubMed.
- M. Li and C. P. Huang, Carbon, 2010, 48, 4527–4534 CrossRef CAS.
- C. Lu and F. Su, Sep. Purif. Technol., 2007, 58, 113–121 CrossRef CAS.
- T. J. Battin, F. V. D. Kammer, A. Weilhartner, S. Ottofuelling and T. Hofmann, Environ. Sci. Technol., 2009, 43, 8098–8104 CrossRef CAS PubMed.
- K. Ikuma, A. W. Decho and B. L. T. Lau, Front. Microbiol., 2015, 6, 591, DOI:10.3389/fmicb.2015.00591.
- C. Sacchetti, K. Motamedchaboki, A. Magrini, G. Palmieri, M. Mattei, S. Bernardini, N. Rosato, N. Bottini and M. Bottini, ACS Nano, 2013, 7, 1974–1989 CrossRef CAS PubMed.
- A. P. Hitchcock, Soft X-ray Imaging and Spectromicroscopy Chapter 22 in Volume II of the Handbook on Nanoscopy, ed. G. van Tendeloo, D. van Dyck and S. J. Pennycook, Wiley, 2012, pp. 745–791 Search PubMed.
- J. R. Lawrence, G. D. W. Swerhone, G. G. Leppard, T. Araki, X. Zhang, M. M. West and A. P. Hitchcock, Appl. Environ. Microbiol., 2003, 69, 5543–5554 CrossRef CAS PubMed.
- J. J. Dynes, J. R. Lawrence, D. R. Korber, G. D. W. Swerhone, G. G. Leppard and A. P. Hitchcock, Sci. Total Environ., 2006, 369, 369–383 CrossRef CAS PubMed.
- J. J. Dynes, T. Tyliszczak, T. Araki, J. R. Lawrence, G. D. W. Swerhone, G. G. Leppard and A. P. Hitchcock, Environ. Sci. Technol., 2006, 40, 1556–1565 CrossRef CAS PubMed.
- A. P. Hitchcock, J. J. Dynes, J. R. Lawrence, M. Obst, G. D. W. Swerhone, D. R. Korber and G. G. Leppard, Geobiology, 2009, 7, 432–453 CrossRef CAS PubMed.
- J. R. Lawrence, G. D. W. Swerhone, J. J. Dynes, D. R. Korber and A. P. Hitchcock, J. Microsc., 2014 DOI:10.1111/jmi.12156.
- Y. Yin and X. Zhang, Water Sci. Technol., 2008, 58, 623–628 CrossRef CAS PubMed.
- L. A. Luongo and X. Q. Zhang, J. Hazard. Mater., 2010, 178, 356–362 CrossRef CAS PubMed.
- D. Goyal, X. J. Zhang and J. N. Rooney-Varga, Lett. Appl. Microbiol., 2010, 51, 428–435 CrossRef CAS PubMed.
- P. Ghafari, C. H. St-Denis, M. E. Power, X. Jin, V. Tsou, H. S. Mandal, N. C. Bols and X. W. Tang, Nat. Nanotechnol., 2008, 3, 347–351 CrossRef CAS PubMed.
- C. Y. Chen and C. T. Jafvert, Environ. Sci. Technol., 2010, 44, 6674–6679 CrossRef CAS PubMed.
- R. Krishnamoorthy, R. Gomathi, S. Manian and R. T. R. Kumar, Langmuir, 2014, 30, 592–601 CrossRef PubMed.
- L. M. Jakubek, S. Marangoudakis, J. Raingo, X. Y. Liu, D. Lipscombe and R. H. Hurt, Biomaterials, 2009, 30, 6351–6357 CrossRef CAS PubMed.
- X. Y. Liu, V. Gurel, D. Morris, D. W. Murray, A. Zhitkovich, A. B. Kane and R. H. Hurt, Adv. Mater., 2007, 19, 2790–2796 CrossRef CAS.
- J. R. Lawrence, G. D. W. Swerhone and T. R. Neu, J. Microbiol. Methods, 2000, 42, 215–224 CrossRef CAS PubMed.
- J. R. Lawrence, M. Chenier, R. Roy, D. Beaumier, N. Fortin, G. D. W. Swerhone, T. R. Neu and C. W. Greer, Appl. Environ. Microbiol., 2004, 70, 4326–4339 CrossRef CAS PubMed.
- M. R. Chénier, D. Beaumier, R. Roy, B. T. Driscoll, J. R. Lawrence and C. W. Greer, Appl. Environ. Microbiol., 2003, 69, 5170–5177 CrossRef.
- T. R. Neu, G. D. W. Swerhone and J. R. Lawrence, Microbiology, 2001, 147, 299–313 CrossRef CAS PubMed.
- K. V. Kaznatcheev, C. Karunakaran, U. D. Lanke, S. G. Urquhart, M. Obst and A. P. Hitchcock, Nucl. Instrum. Methods Phys. Res. Sect. A-Accel. Spectrom. Dect. Assoc. Equip., 2007, 582, 96–99 CrossRef CAS.
- C. Jacobsen, S. Wirick, G. Flynn and C. Zimba, J. Microsc., 2000, 197, 173–184 CrossRef CAS PubMed.
- A. P. Hitchcock, 2014, It is available free for non-commercial use from http://unicorn.mcmaster.ca/aXis2000.html.
- J. R. Lawrence, P. J. Delaquis, D. R. Korber and D. E. Caldwell, Microb. Ecol., 1987, 14, 1–14 CrossRef CAS PubMed.
- M. S. Mauter and M. Elimelech, Environ. Sci. Technol., 2008, 42, 5843–5859 CrossRef CAS PubMed.
- B. Pan and B. S. Xing, Environ. Sci. Technol., 2008, 42, 9005–9013 CrossRef CAS PubMed.
- S. Kang, M. S. Mauter and M. Elimelech, Environ. Sci. Technol., 2008, 42, 7528–7534 CrossRef CAS PubMed.
- A. Quigg, W.-C. Chin, C.-S. Chen, S.-J. Zhang, Y.-L. Jiang, A.-J. Miao, K. A. Schwehr, C. Xu and P. H. Santschi, ACS Sustainable Chem. Eng., 2013, 1, 686–702 CrossRef CAS.
- S. Lee, K. Kim, H. Shon, S. Kim and J. Cho, J. Nanopart. Res., 2011, 13, 3051–3061 CrossRef CAS.
- M. Lundqvist, J. Stigler, G. Elia, I. Lynch, T. Cedervall and K. A. Dawson, Proc. Natl. Acad. Sci. U. S. A., 2008, 105, 14265–14270 CrossRef CAS PubMed.
- I. Lynch and K. A. Dawson, Nano Today, 2008, 3, 40–47 CrossRef CAS.
- J. Buffle, K. J. Wilkinson, S. Stoll, M. Filella and J. W. Zhang, Environ. Sci. Technol., 1998, 32, 2887–2899 CrossRef CAS.
- S. M. Myklestad, Sci. Total Environ., 1995, 165, 155–164 CrossRef CAS.
- E. J. Petersen and T. B. Henry, Environ. Toxicol. Chem., 2012, 31, 60–72 CrossRef CAS PubMed.
- J. R. Lawrence and A. P. Hitchcock, Synchrotron-based X-ray and FTIR absorption spectromicroscopies of organic contaminants in the environment, in Biophysico-Chemical Processes of Anthropogenic Organic Compounds in Environmental Systems, International Union of Pure and Applied Chemistry Books Series, John Wiley & Sons, 2011, ch. 14, pp. 341–368 Search PubMed.
- T. R. Neu, B. Manz, F. Volke, J. J. Dynes, A. P. Hitchcock and J. R. Lawrence, FEMS Microbiol. Ecol., 2010, 72, 1–21 CrossRef CAS PubMed.
- A. P. Hitchcock, J. J. Dynes, G. Johansson, J. Wang and G. Botton, Micron, 2008, 39, 311–319 CrossRef CAS PubMed.
- J. R. Lawrence and T. R. Neu, Rev. Environ. Sci. Biotechnol., 2004, 2(2–4), 85–97 Search PubMed.
- Y. Liu, J. Liggio, S. Li, D. Breznan, R. Vincent, E. M. Thomson, P. Kumarathasan, D. Das, J. Abbatt, M. Antiñolo and L. Russell, Environ. Sci. Technol., 2015, 49(5), 2806–2814 CrossRef CAS PubMed.
| This journal is © The Royal Society of Chemistry 2016 |

