 Open Access Article
Creative Commons Attribution 3.0 Unported Licence
Methylmercury production in a chronically sulfate-impacted sub-boreal wetland
Nathan W.
Johnson
*ab,
Carl P. J.
Mitchell
c,
Daniel R.
Engstrom
d,
Logan T.
Bailey
b,
Jill K.
Coleman Wasik
e and
Michael E.
Berndt
f
aDepartment of Civil Engineering, University of Minnesota Duluth, USA. E-mail: nwjohnso@d.umn.edu; Fax: +1-218-726-6445; Tel: +1-218-726-6435
bWater Resources Science Program, University of Minnesota, USA
cDepartment of Physical and Environmental Sciences, University of Toronto, Scarborough, Canada
dSt. Croix Watershed Research Station, Science Museum of Minnesota, USA
eDepartment of Plant and Earth Science, University of Wisconsin River Falls, USA
fDivision of Lands and Minerals, Minnesota Department of Natural Resources, USA
First published on 16th May 2016
Abstract
Increased deposition of atmospheric sulfate exacerbates methylmercury (MeHg) production in freshwater wetlands by stimulating methylating bacteria, but it is unclear how methylation in sub-boreal wetlands is impacted by chronically elevated sulfate inputs, such as through mine discharges. The purpose of our study is to determine how sulfate discharges to wetlands from iron mining activities impact MeHg production. In this study, we compare spatial and temporal patterns in MeHg and associated geochemistry in two wetlands receiving contrasting loads of sulfate. Two orders of magnitude less sulfate in the un-impacted wetland create significant differences in acid-volatile sulfide and porewater sulfide; however, dissolved and solid-phase MeHg concentrations and methylation rate potentials (Kmeth) are statistically similar in both wetlands. Permitted mine pumping events flood the sulfate-impacted wetland with very high sulfate waters during the fall. In contrast to observations in sulfate-limited systems, this large input of sulfate to a chronically sulfate-impacted system led to significantly lower potential relative methylation rates, suggesting a predominance of demethylation processes over methylation processes during the sulfate loading. Overall, short-term measurements of methylation and demethylation potential are unrelated to gross measures of long-term MeHg accumulation, indicating a decoupling of short- and long-term process measurements and an overall disequilibrium in the systems. High sulfide accumulation, above ∼600–800 μg l−1 sulfide, in the sulfate-impacted system lowers long-term MeHg accumulation, perhaps as a result of less bioavailable Hg–S complexes. Although continued research is required to determine how sulfate-limited freshwater wetlands might respond to new, large inputs of high-sulfate runoff from mining operations, chronically impacted wetlands do not appear to continually accumulate or produce MeHg at rates different from wetlands unimpacted by mining.
Environmental impactThis study examined how sulfate discharges from iron mining activities to sub-boreal wetlands impact MeHg production. The two study wetlands differ greatly in the quantity of sulfur in peat solid-phase and porewater; however little difference is present in the production of MeHg. Seasonal and spatial patterns are present, though methylation rate potentials are largely decoupled from MeHg observations. This is most evident during a permitted discharge of sulfate-laden mine water that inundated a chronically sulfate-impacted wetland but did not change the overall quantity of MeHg during or after the flooding. The results highlight the difficulty of characterizing the net effects of sulfur on mercury methylation under transient hydrologic and geochemical conditions in sulfate-impacted wetland environments. |
Introduction
The bioaccumulation of mercury (Hg) in aquatic ecosystems – a serious global concern owing to its toxic effects in humans and wildlife1,2 – has led to fish consumption advisories for thousands of lakes across the US3,4 and recent worldwide efforts to curb Hg emissions and exposure through the Minimata Convention.5 Methylmercury (MeHg) is the bioaccumulative form of Hg, and its production in aquatic ecosystems is a key factor controlling the organismal load of Hg.6 A significant amount of research therefore has been devoted to understanding the complex set of interrelated chemical and biological processes that produce, break down, and transport MeHg in a variety of natural settings.7,8 The production of MeHg in natural environments is primarily an anaerobic, microbially-driven process.9 Although a wide array of anaerobes harbor the two genes (hgcAB) responsible for Hg methylation capabilities,10 sulfate-reducing bacteria (SRB) have consistently dominated other functional groups as conclusive Hg methylators.11,12Wetlands, with their highly organic soils and saturated hydrologic conditions, harbor a myriad of anaerobic microbes and are important net producers of MeHg.13 Considerable output of MeHg to downstream ecosystems can occur when areas of relatively high MeHg production and accumulation are linked to hydrologically connected areas.14,15 In freshwater wetlands, MeHg production appears limited by sulfate availability, particularly in nutrient poor peatlands,16,17 and Hg methylation capabilities vary considerably across different wetland types.18,19 Discrete spatial variations in sulfate loads and redox processes within wetlands are important to the internal spatial patterning of MeHg production.15 Thus, the production of MeHg in wetlands is important in defining in situ wetland MeHg concentrations and also as a source for downstream rivers and lakes.
The role of sulfate loading on MeHg production in wetlands with chronically elevated sulfate concentrations is much less clear than for sulfate-limited wetlands. For example, in the Florida Everglades where sulfate is a common agricultural fertilizer, sediment exposed to a range of sulfate and nutrient loads showed lower net MeHg production in areas where sulfate and nutrient loads were already elevated.20 In the Prairie Pothole Region of Saskatchewan, where freshwater sulfate concentrations can be naturally very high (up to 1000 s of mg l−1), Hoggarth et al.21 found no significant difference in Hg methylation potentials between high-sulfate (>150 mg l−1) and low-sulfate (<20 mg l−1) wetland sediment. The buildup of sulfide in anoxic sediment and porewater exposed to high sulfur loads is thought to alter the form of inorganic mercury, reducing its bioavailability to methylating microbes due to either thermodynamically or kinetically limited processes.7,22
Iron ore mining has been an important economic activity on the Mesabi Iron Range, in the St. Louis River watershed of northern Minnesota since the early 20th century,23 with current activities focused on mining and beneficiation of taconite, a low-grade ore. Over the years, there has been a significant accumulation of sulfate in tailings ponds (constructed settling basins for fine-grained waste rock) and pit lakes (abandoned open-pit mines) resulting from a mixture of sources including ore and waste rock sulfide mineralization24 and the taconite pellet induration process.25 Non-point discharges, including water leaking from tailings basins and runoff from tailings piles, as well as permitted discharges from active dewatering operations and pit-lake overflows have significantly increased sulfate loading to the St. Louis River, which drains into western Lake Superior.26,27 While abundant carbonate minerals in the iron formation appear to fully neutralize acid generation, sulfate concentrations above 100 mg l−1 have been observed in local streams and in excess of 1000 mg l−1 in some mine pits.27 Background surface water sulfate concentrations in the region are less than 5 mg l−1. Despite receiving far greater loads of sulfate, tributary streams impacted by mining in the St. Louis River watershed carry similar concentrations of MeHg as their non-sulfate impacted counterparts27 and do not significantly differ with respect to Hg bioaccumulation by dragonfly larvae.28 Our study was designed to investigate how elevated sulfate loading from mining affects MeHg production in an impacted wetland and to compare with Hg methylation capabilities in a wetland hydrologically disconnected from elevated sulfate loading. We were also interested in testing the hypothesis that MeHg production in sulfate-impacted wetlands is lessened by low bioavailability of inorganic Hg due to high sulfide concentrations.7,22
Methods
Site description
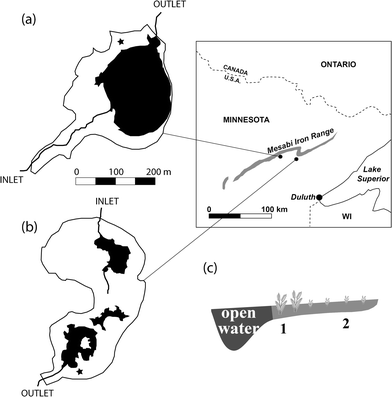
This study focused on the St. Louis River watershed, which drains through northeastern Minnesota into western Lake Superior (Fig. 1). The regional climate is humid continental, with an average annual temperature of 3.5 °C and average annual precipitation of 680 mm. Two wetland sites with contrasting upstream mining impacts were selected for the study. The Long Lake Creek (LLC) wetland (N 47.42°, W 92.56°) is a ∼15 hectare sub-boreal fen that receives sulfate-rich water (typically ∼250 mg l−1) from a ∼2.5 km2, mining-influenced catchment. Previous work indicates significant sulfate reduction as waters pass through the wetland.29 The LLC periphery supports typical peatland vegetation with Sphagnum dominated peat, grading into a degraded fen margin dominated by Typha spp., and a 1.5 hectare open-water pool. The un-impacted West Two River (WTR) wetland (N 47.465°, W 92.77°) lies near the headwaters of a small (1.2 km2) catchment with no ongoing mining operations and drains into the west branch of the West Two River. WTR is a large sedge-dominated fen on the north side of a small (4.5 hectare) pond with surface water sulfate concentrations typically less than 5 mg l−1.The study wetlands are similar in size and in that both surround open water pools with small, but active riverine inputs and outlets. Our study year (2012) was characterized by several large rainfall events in June (∼300 mm) and mostly dry conditions through the remainder of the summer (<150 mm until October). In both wetlands, the water table ranged from 10–20 cm above the peat surface in late June and early July to approximately 5–10 cm below the peat surface in September. Following this dry period, the LLC wetland was subject to a flooding event from permitted pumping and discharge of water from an upstream mine pit in mid-September. In accordance with its discharge permit, the mining company reported that the flow in the Long Lake Creek watershed increased from near zero to 0.25–0.38 m3 s−1 during the week following September 15, 2012.30 The pumping lasted through November and resulted in an inundation of the entire wetland area with 30–50 cm of sulfate-rich (>500 mg l−1) water. This same type of pumping event occurred during 2011 and also possibly in years prior, meaning the LLC wetland complex was inundated by high sulfate water during the fall preceding the data reported here for 2012.
Sampling methods
Samples were collected from two sampling plots at each wetland site: (1) from an area 5–10 m adjacent to the open water pool (hereafter “near open water”), and (2) within approximately 5 m of the surrounding terrestrial upland (hereafter “near upland,” Fig. 1c). Peat samples were collected in May, July, and October 2012 from the Long Lake Creek wetland (hereafter “sulfate-impacted”) and in July and October 2012 at the West Two River wetland (hereafter “sulfate-unimpacted”). There are no samples from the sulfate-unimpacted site during May because we originally chose a different site that was not well-matched geomorphically to the LLC wetland and subsequently abandoned the site for West Two River starting in July.For methylation and demethylation assays, triplicate 5 cm diameter cores were collected at each plot using clear polycarbonate tubes, capped, and stored upright in coolers during transport to a local lab. Core tubes were specially designed with silicone-sealed injection ports spaced at 1 cm intervals to allow for enriched Hg isotope injections (explained further below). For other solid phase analyses, triplicate peat blocks were cut with a serrated knife from each sampling plot, wrapped in plastic wrap to preserve moisture, and transported to a local lab for sectioning and processing. The center portion of moist peat blocks were sliced into 0–2, 2–4, and 4–8 cm depth sections and immediately placed into an oxygen-free atmosphere where individual samples were homogenized. Sediment samples for acid volatile sulfide (AVS) analysis were sealed in a nitrogen atmosphere, preserved with zinc acetate (final concentration of 0.02 mol l−1), and frozen until analysis.
Porewater samples were collected in triplicate from each sampling plot in May 2012 and then approximately biweekly during July, August, and September using 10 cm Rhizon® filters31 installed in situ and connected to acid-washed, evacuated serum bottles with PTFE tubing and stainless steel hypodermic needles. In the case of a water table at or above the peat surface, porewater was collected from the surficial 10 cm of peat pore fluids. When the water table was below the peat surface, porewater was collected from the uppermost 10 cm of saturated peat. Replicate Rhizons® were typically installed in the afternoon and retrieved the following morning, allowing time for the in situ filtration of four bottles totaling approximately 325 ml. One bottle was pre-loaded with ZnAc for the preservation of sulfide (final concentration 0.002 mol l−1), while other bottles containing no preservative were opened in the lab, allocated, and preserved as needed for analysis of total mercury (THg), MeHg, and sulfate. In an effort to avoid sampling of disturbed areas, an approximately 7 meter diameter area was staked out at each plot at the beginning of the season and samples were collected from different areas within the plot during each sampling event. Because previous research has shown that microtopographic characteristics of peatlands can have significant influence on mercury and related geochemistry,32 an effort was made to consistently collect both solid and porewater samples from representative hollows between hummocks that appeared similarly moist or inundated compared to other hollows in the immediate area. Total- and methyl-mercury samples were preserved with trace metal grade 12 N HCl (0.5% by volume) and stored on ice in double-bagged PETG bottles. Porewater samples for sulfate analysis were acidified to pH <3 with concentrated HCl and gently bubbled with oxygen-free nitrogen to remove dissolved sulfide prior to storage at 4 °C until analysis.
Analytical methods
Methylation potential rate constants (Kmeth) are reported in units of per day, while demethylation potential rate constants (Kdemeth) are reported as per hour. Rather than the Kmeth/Kdemeth ratio used in some studies to examine relative methylation,19 we multiplied Kmeth by the solid-phase peat inorganic Hg concentration (total mercury minus methylmercury) and Kdemeth by the solid-phase peat MeHg concentration (to derive potential rates in units of ng g−1 d−1). We used the ratio of these potential rates as a measure of the “potential relative methylation rate”. This measure should only be considered semi-quantitative as the bioavailable fractions of inorganic Hg and MeHg are not known or readily quantifiable.37 However, the product of Kmeth and the solid phase inorganic mercury pool (with which it is reacting) is a more intuitive measurement than the raw Kmeth potential (units of d−1) because the product accounts for the pool of reactant. Ratios of these potential rates (each having units of ng g−1 d−1) above one suggest the potential for net methylation and ratios of these potential rates below one suggest the potential for net demethylation.
Porewaters were analyzed for MeHg by isotope-dilution ICP-MS following distillation, as described above for sediment samples.34,35 Porewaters were analyzed for HgT according to USEPA method 1631, using a Tekran 2600 automated mercury analyzer.38 The ratio of mean solid phase to mean porewater concentrations of MeHg and inorganic Hg at each sampling plot was used to define an effective porewater-solid phase distribution coefficients (KD).
Statistical methods
All variables were tested for normality by examination of histograms and Q–Q plots and log-transformed as necessary. Differences across seasons and between sulfate-impacted and sulfate-unimpacted sites were investigated using a mixed model taking into account wetland, sampling site, and season. Correlations were explored using Pearson's correlation. Statistical significance was tested at α = 0.05. All statistical analyses were conducted using the RStudio package.40Results & discussion
MeHg distribution and production in peat
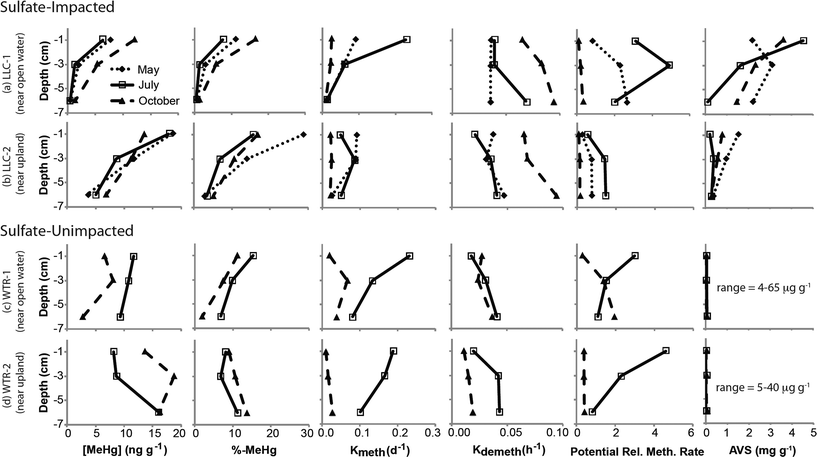
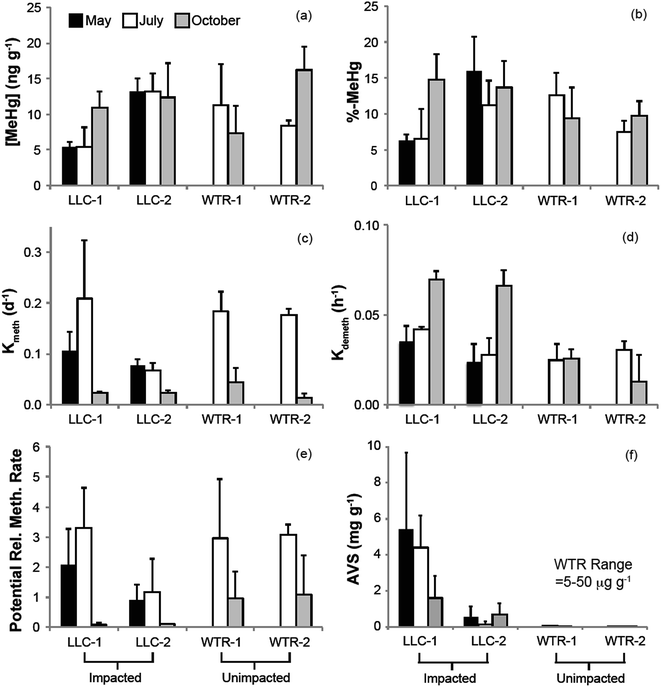
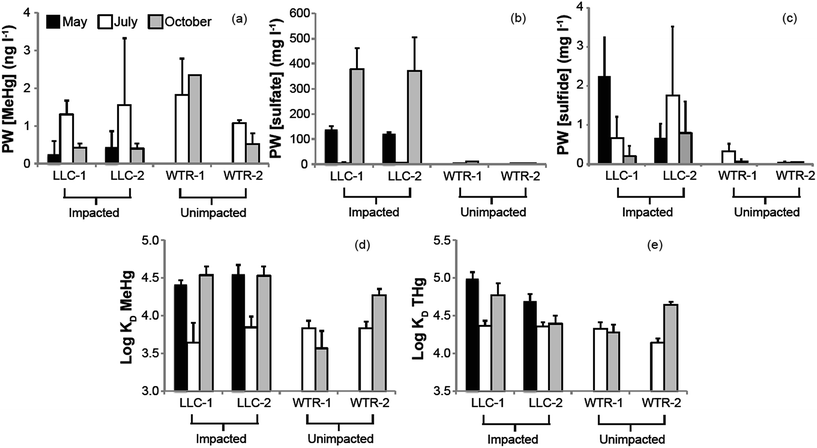
The mine pumping events that inundated the impacted wetland with high-sulfate water in the fall prior to our study and again from mid-September 2012 to well after our October sampling, did not have a significant impact on MeHg concentrations in the peat solid phase. No significant increases in peat MeHg concentration, peat % MeHg, or porewater MeHg concentrations were observed in response to this sulfate loading, in contrast to experimental sulfate additions to sulfate-limited wetlands which produced rapid and marked increases in porewater MeHg (e.g.ref. 16, 17, 42 and 43). Instead, during July when sulfate concentrations in the impacted wetland were at their lowest (0.9–8.7 mg l−1; Fig. 4b), high porewater MeHg concentrations, elevated Kmeth, and lower pore-water-peat distribution coefficients (relative to October) suggest more rapid net methylation and relative partitioning into pore water. Although we did not observe significantly greater sulfate reduction products – such as porewater sulfide and AVS – during July in the sulfate-impacted wetland, the large decline in porewater sulfate between May and July strongly suggests a period of active sulfate consumption by sulfate-reducing bacteria. The activity of sulfate-reducing bacteria, which is often coupled with high rates of Hg methylation,44,45 was likely enhanced by the warmer temperatures observed during July and led to the elevated porewater MeHg, Kmeth and potential relative methylation rates observed at this time. The summertime maximum in MeHg production and porewater accumulation suggests that peat temperature, as it affects microbial activity, may be important to seasonal patterns.
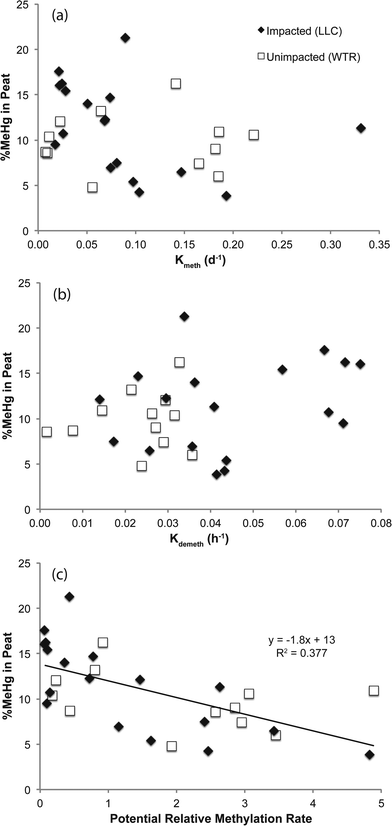
The lack of a strong relationship between Kmeth or Kdemeth with % MeHg in the peat (p = 0.16 and 0.12, respectively) most likely represents a decoupling of the timing between instantaneous Hg methylation/demethylation processes and solid phase MeHg accumulation (Fig. 5). We observed a significant (p < 0.001), but weakly (r2 = 0.38) inverse relationship between solid phase % MeHg and potential relative methylation rates, indicating that the instantaneous methylation and demethylation potential rate constants that we measured do not reflect the long-term accumulation of MeHg in these systems. This is in sharp contrast to other studies in freshwater systems, wherein % MeHg correlated positively and relatively strongly with Kmeth or the Kmeth/Kdemeth ratio.19,20 Our study systems, particularly the sulfate-impacted wetland, are likely not in chemical equilibrium – a result of the transient hydrologic and geochemical setting, which leads to short-term swings in redox conditions in the surface peat that are difficult to discern in the seasonal sampling. The most dramatic example of this decoupling was observed during October in the sulfate-impacted wetland: solid phase MeHg concentrations were some of the highest we observed and sulfate concentrations were elevated, but potential relative methylation rates were exceedingly low. We hypothesize that net MeHg production and accumulation may have continued beyond our July sampling as temperatures increased until the wetland was inundated with high-sulfate, well-oxygenated mine-waters in mid-September. The large influx of high-sulfate, oxygenated water may have led to a redox block, such that the wetland could not attain sufficiently reducing conditions for Hg methylation, and instead Hg demethylation was favored (Fig. 3d and e) and reflected in our instantaneous potential relative methylation measurements. Indeed, laboratory studies have shown that Hg methylation is coupled with sulfate reduction, but that more strongly reducing, fermentative conditions are especially conducive to Hg methylation.46 Additionally more recent research suggests that bacteria that thrive in sulfate reducing and fermentative conditions are common methylators.10 The high potential relative methylation rates observed in July during a time of low available sulfate (Fig. 3e and 4b) support this redox block hypothesis. Porewater sulfide was still present in the sulfate-impacted peat in October (lower than July by a factor of 2), but porewater sulfate had increased by three orders of magnitude. Directly linking instantaneous processes with MeHg concentration over time in this sulfate-impacted system is not feasible in the field, but laboratory experiments should be devised to more carefully trace processes across time using chronically sulfate-impacted and -unimpacted peat.
Sulfate loading impacts on Hg bioavailability
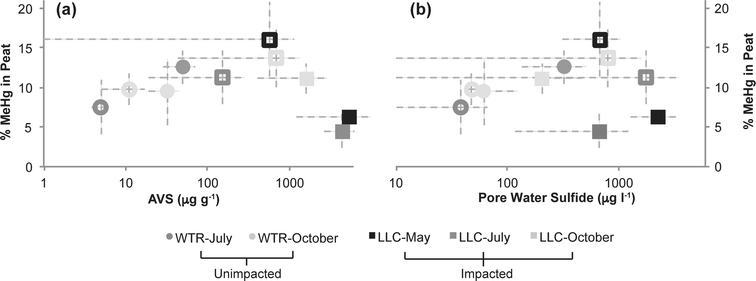
The second objective of this study was to investigate whether the chronic loading of sulfate into the Long Lake Creek wetland had a significant impact on inorganic Hg bioavailabilty due to sulfide complexation. Previous work in other sulfate-impacted freshwater systems such as the Florida Everglades suggests a “Goldilocks zone” wherein inputs of sulfate stimulate Hg methylation through the activity of sulfate-reducing bacteria, but the accumulation of sulfide with further sulfate inputs and advanced sulfate reduction inhibits Hg methylation. Although several hypotheses describing the formation of microbially-unavailable Hg–S complexes have been proposed, including mononuclear aqueous complexes, sulfhydryl–Hg complexes in DOC, and nanoparticulate HgS,47–49 experimental observations suggest that the peak of the “Goldilocks zone” above which Hg methylation begins to be inhibited occurs at sulfide concentrations between approximately 300 and 3000 ug l−1 in porewater.47,48 Results from our study, wherein we observed a strong log-linear relationship between % MeHg and porewater sulfide at sulfide concentrations below ∼600–700 μg l−1 (p < 0.01; r2 = 0.87), follow a similar pattern (Fig. 6b). This relationship excludes an outlier of low % MeHg at the near open water site in the sulfate-impacted wetland during July. At impacted and un-impacted sites collectively, we observed an equally strong relationship for AVS concentrations up to ∼800 μg g−1 (Fig. 6a; p < 0.01; r2 = 0.81). At the impacted site, the near open water plot had consistently higher AVS and consistently lower solid phase % MeHg, a pattern that may reflect both the proximity to the sulfate-rich stream and more consistent strongly-reducing and inhibiting conditions nearer the open water. The site farther from the open water may experience more frequent and prolonged dry periods which could re-mobilize sulfate from reduced solid sulfur phases providing additional fuel for driving MeHg production, as has been observed in relation to water table fluctuation (Coleman Wasik et al. 2015).50 Additionally, more frequent inputs of freshwater runoff from the upland could result in lower sulfate loads to peat porewaters and less buildup of sulfide in peat porewaters and solid phase.Although our observations of solid phase % MeHg are consistent with the hypothesis that MeHg production in the sulfate-impacted wetland was suppressed by low bioavailability of inorganic Hg (resulting from high sulfide concentrations), Hg process measurements (Kmeth, Kdemeth, or potential relative methylation rate) did not reflect this. For example, lower methylation rate constants but higher solid phase MeHg were consistently observed farther from shore at the LLC site (compared to near open water, Fig. 3a and c). The consistent relationships observed between sulfide chemistry and solid-phase MeHg concentration, but inconsistent relationships observed between sulfide chemistry and methylation/demethylation rates, is further evidence that instantaneous Hg methylation rates are decoupled from MeHg accumulation in an environment with dynamic changes to redox conditions such as peat. Unraveling the reason for this decoupling is challenging with the limited temporal resolution of solid-phase measurements. The sampling plot near the open water in the sulfate-impacted wetland had consistently higher AVS than the sampling plot farther from shore (near upland, Fig. 3f); however, dissolved sulfide (Fig. 4c) did not show a similar pattern. Potential relative methylation rate and porewater MeHg, similar to porewater sulfide, likely reflect conditions present in the preceding hours or days, whereas solid phase % MeHg and AVS are likely more representative of the cumulative effect of predominant microbial and redox conditions over a longer period.
Conclusions
Methylmercury production in freshwater wetlands subject to chronically elevated sulfate loading is different from observations in wetlands where sulfate is limiting. Methylmercury concentrations and methylation potential rate constants did not differ significantly between a freshwater wetland chronically impacted by mining-influenced water containing high (100 s of mg l−1) sulfate concentrations and a similar wetland with background (∼5 mg l−1) sulfate concentrations. This was despite large apparent differences in sulfate reduction between the two wetlands, manifest in orders of magnitude differences in pore water sulfate and sulfide and solid-phase AVS concentrations. Importantly, we found that short-term measurements of methylation and demethylation potentials were very weakly related to longer-term measurements of MeHg accumulation, such as %-MeHg in peat, indicating that methylation and demethylation processes are highly transient through time. While this research may be interpreted that sulfate inputs to wetland systems in this region are uncoupled from Hg methylation, we caution that our work has focused on a chronically sulfate-impacted wetland and that further research is needed to better understand the evolution of wetland Hg cycling responses during the transition from low sulfate to chronically-sulfate-impacted conditions.Acknowledgements
Funding for this work was provided by the Minnesota Department of Natural Resources. The authors are indebted to the staff of the Minnesota Department of Natural Resources office in Hibbing, Minnesota, for use of lab space during field sampling and sample processing.References
- D. Mergler, H. A. Anderson, L. H. M. Chan, K. R. Mahaffey, M. Murray, M. Sakamoto and A. H. Stern, Methyl mercury exposure and health effects in humans: a worldwide concern, Ambio, 2007, 36, 3–11 CrossRef CAS PubMed.
- A. M. Scheuhammer, M. W. Meyer, M. B. Sandheinrich and M. W. Murray, Effects of environmental methylmercury on the health of wild birds, mammals, and fish, Ambio, 2007, 36, 12–18 CrossRef CAS PubMed.
- U.S. Environmental Protection Agency, Mercury Study Report to Congress EPA-452/R97-004, Office of Air, Washington, DC, 1997 Search PubMed.
- W. F. Fitzgerald, D. R. Engstrom, R. P. Mason and E. A. Nater, The case for atmospheric mercury contamination in remote areas, Environ. Sci. Technol., 1998, 32, 1–7 CrossRef CAS.
- United Nations Environment Program, Global Mercury Assessment 2013: Sources, Emissions, Releases, and Environmental Transport, UNEP Chemicals Branch, Geneva, Switzerland, 2013 Search PubMed.
- J. G. Wiener, B. C. Knights, M. B. Sandheinrich, J. D. Jeremiason, M. E. Brigham, D. R. Engstrom, L. G. Woodruff, W. F. Cannon and S. J. Balogh, Mercury in soils, lakes, and fish in Voyageurs National Park (Minnesota): Importance of atmospheric deposition and ecosystem factors, Environ. Sci. Technol., 2006, 40, 6261–6268 CrossRef CAS PubMed.
- H. Hsu-Kim, K. H. Kucharzyk, T. Zhang and M. A. Deshusses, Mechanisms regulating mercury bioavailability for methylating microorganisms in the aquatic environment: a critical review, Environ. Sci. Technol., 2013, 47, 2441–2456 CrossRef CAS PubMed.
- I. Lehnherr, Methylmercury biogeochemistry: a review with special reference to arctic aquatic ecosystems, Environ. Rev., 2014, 22, 229–243 CrossRef CAS.
- M. Berman and R. Bartha, Levels of chemical versus biological methylation of mercury in sediments, Bull. Environ. Contam. Toxicol., 1986, 36, 401–404 CrossRef CAS PubMed.
- M. Podar, C. C. Gilmour, C. C. Brandt, A. Soren, S. D. Brown, B. R. Crable, A. V. Palumbo, A. C. Somenahally and D. A. Elias, Global prevalence and distribution of genes and microorganisms involved in mercury methylation, Sci. Adv., 2015, 1, E1500675 Search PubMed.
- C. C. Gilmour, E. A. Henry and R. Mitchell, Sulfate stimulation of mercury methylation in freshwater sediments, Environ. Sci. Technol., 1992, 26, 2281–2287 CrossRef CAS.
- C. C. Gilmour, M. Podar, A. L. Bullock, A. M. Graham, S. D. Brown, A. C. Somenahally, A. Johs, R. A. Hurt, K. L. Bailey and D. A. Elias, Mercury methylation by novel microorganisms from new environments, Environ. Sci. Technol., 2013, 47, 11810–11820 CrossRef CAS PubMed.
- B. A. Branfireun, A. Heyes and N. T. Roulet, The hydrology and methylmercury dynamics of a precambrian shield headwater peatland, Water Resour. Res., 1996, 32, 1785–1794 CrossRef CAS.
- V. L. S. Louis, J. W. M. Rudd, C. A. Kelly, K. G. Beaty, N. S. Bloom and R. J. Flett, Importance of wetlands as sources of methylmercury to boreal forest ecosystems, Can. J. Fish. Aquat. Sci., 1994, 51, 1065–1076 CrossRef.
- C. P. J. Mitchell, B. A. Branfireun and R. K. Kolka, Spatial characteristics of net methylmercury production hotspots in peatlands, Environ. Sci. Technol., 2008, 42, 1010–1016 CrossRef CAS PubMed.
- C. P. J. Mitchell, B. A. Branfireun and R. K. Kolka, Assessing sulfate and carbon controls on net methylmercury production in peatlands: an in situ mesocosm approach, Appl. Geochem., 2008, 23, 503–518 CrossRef CAS.
- J. K. Coleman Wasik, C. P. J. Mitchell, D. R. Engstrom, E. B. Swain, B. A. Monson, S. J. Balogh, J. D. Jeremiason, B. A. Branfireun, S. L. Eggert, R. K. Kolka and J. E. Almendinger, Methylmercury declines in a boreal peatland when experimental sulfate deposition decreases, Environ. Sci. Technol., 2012, 46, 6663–6671 CrossRef CAS PubMed.
- C. P. J. Mitchell and C. C. Gilmour, Methylmercury production in a Chesapeake Bay salt marsh, J. Geophys. Res.: Biogeosci., 2008, 113, G00C04 Search PubMed.
- I. Tjerngren, T. Karlsson, E. Bjorn and U. Skyllberg, Potential Hg methylation and MeHg demethylation rates related to the nutrient status of different boreal wetlands, Biogeochemistry, 2012, 108, 335–350 CrossRef CAS.
- C. C. Gilmour, G. S. Riedel, M. C. Ederington, J. T. Bell, J. M. Benoit, G. A. Gill and M. C. Stordal, Methylmercury concentrations and production rates across a trophic gradient in the northern Everglades, Biogeochemistry, 1998, 40, 327–345 CrossRef CAS.
- C. G. Hoggarth, B. D. Hall and C. P. J. Mitchell, Mercury methylation in high and low-sulphate impacted wetland ponds within the prairie pothole region of North America, Environ. Pollut., 2015, 205, 269–277 CrossRef CAS PubMed.
- J. M. Benoit, C. C. Gilmour, R. P. Mason and A. Heyes, Sulfide controls on mercury speciation and bioavailability to methylating bacteria in sediment pore waters, Environ. Sci. Technol., 1999, 33, 951–957 CrossRef CAS.
- H. Hatcher, A Century of Iron and Men, Bobbs–Merrill, New York, 1950 Search PubMed.
- G. B. Morey, Chemical composition of the eastern Biwabik Iron-Formation (Early Proterozoic), Mesabi Range, Minnesota, Econ. Geol., 1992, 87, 1649–1658 CrossRef CAS.
- K. Lapakko and A. Jagunich, Sulfate Release from the USX Tailings Basin and Quantification of Sulfate Sources, Minnesota Department of Natural Resources Division of Minerals, St. Paul, MN, 1991 Search PubMed.
- J. Lindgren, N. Schuldt, B. Borkholder, T. Howes, A. Levar, C. Olson, J. Tillma and D. Vogt, A Study of the St. Louis River, Minnesota Department of Natural Resources Division of Fisheries, Duluth, MN, 2006 Search PubMed.
- M. E. Berndt and T. K. Bavin, Methyl mercury and dissolved organic carbon relationships in a wetland-rich watershed impacted by elevated sulfate from mining, Environ. Pollut., 2012, 161, 321–327 CrossRef CAS PubMed.
- J. D. Jeremiason, T. K. Reiser, R. A. Weitz, M. E. Berndt and G. R. Aiken, Aeshnid dragonfly larvae as bioindicators of methylmercury contamination in aquatic systems impacted by elevated sulfate loading, Ecotoxicology, 2016, 25, 456–468 CrossRef CAS PubMed.
- M. E. Berndt and T. K. Bavin, Sulfur and Mercury Cycling in Five Wetlands and a Lake Receiving Sulfate from Taconite Mines in Northeastern Minnesota: a Report to Iron Ore Cooperative Research Program, Minnesota Department of Natural Resources Division of Lands and Minerals, St. Paul, MN, 2011 Search PubMed.
- Cliffs Natural Resources, Inc. 2012 Water Appropriation Permit 1963-0691 Mitigation & Monitoring Plan Annual Report, Memo to Michael Liljegren at Minnesota Department of Natural Resources Waters, dated February 4, 2013.
- J. Seeberg-Elverfeldt, M. Schluter, T. Feseker and M. Kolling, Rhizon sampling of porewaters near the sediment water interface of aquatic systems, Limnol. Oceanogr.: Methods, 2005, 3, 361–371 CrossRef.
- B. A. Branfireun, Does microtopography influence subsurface pore-water chemistry? Implications for the study of methylmercury in peatlands, Wetlands, 2004, 24, 207–211 CrossRef.
- H. Hintelmann, K. Keppel-Jones and R. D. Evans, Constants of mercury methylation and demethylation rates in sediments and comparison of tracer and ambient mercury availability, Environ. Toxicol. Chem., 2000, 19, 2204–2211 CrossRef CAS.
- M. Horvat, N. S. Bloom and L. Liang, Comparison of distillation with other current isolation methods for the determination of methyl mercury compounds in low level environmental samples. Part 1. Sediments, Anal. Chim. Acta, 1993, 281, 135–152 CrossRef CAS.
- H. Hintelmann and R. D. Evans, Application of stable isotopes in environmental tracer studies – Measurement of monomethylmercury (CH3Hg+) by isotope dilution ICP-MS and detection of species transformation, Fresenius' J. Anal. Chem., 1997, 358, 378–385 CrossRef CAS.
- H. Hintelmann and N. Ogrinc, Determination of stable mercury isotopes by ICP/MS and their application in environmental studies, in Biogeochemistry of Environmentally Important Trace Elements, ed. Y. Cai and C. O. Braids, ACS Symposium Series, Washington, DC, 2003, vol. 835, pp. 321–338 Search PubMed.
- D. W. Zhu, H. Zhong, Q. L. Zeng and Y. Yin, Prediction of methylmercury accumulation in rice grains by chemical extraction methods, Environ. Pollut., 2015, 199, 1–9 CrossRef CAS PubMed.
- U.S. Environmental Protection Agency, U.S. EPA Method 1631: Mercury in Water by Oxidation, Purge and Trap, and Cold Vapor Atomic Fluorescence Spectrometry for Determination of Mercury in Aqueous Samples, Revision E, Washington, DC, 2002, Publication no. EPA-821-R-02–019 Search PubMed.
- Standard Methods for the Examination of Water and Wastewater: Centennial Edition, ed. A. D. Eaton, L. S. Clesceri, E. W. Rice, A. E. Greenberg and M. A. H. Franson, American Public Health Association, Washington, DC, 21st edn, 2005 Search PubMed.
- RStudio, RStudio: Integrated Development Environment for R (Version 0.98.1091) Computer Software, Boston, MA, 2014, http://www.rstudio.org/ Search PubMed.
- D. F. Grigal, Mercury sequestration in forests and peatlands: a review, J. Environ. Qual., 2003, 32, 393–405 CrossRef CAS PubMed.
- B. A. Branfireun, N. T. Roulet, C. A. Kelly and J. W. M. Rudd, In situ sulfate stimulation of mercury methylation in a boreal peatland: toward a link between acid rain and methylmercury contamination in remote environments, Global Biogeochem. Cycles, 1999, 13, 743–750 CrossRef CAS.
- J. D. Jeremiason, D. R. Engstrom, E. B. Swain, E. A. Nater, B. M. Johnson, J. E. Almendinger, B. A. Monson and R. K. Kolka, Sulfate addition increases methylmercury production in an experimental wetland, Environ. Sci. Technol., 2006, 40, 3800–3806 CrossRef CAS PubMed.
- J. K. King, F. M. Saunders, R. F. Lee and R. A. Jahnke, Coupling mercury methylation rates to sulfate reduction rates in marine sediments, Environ. Toxicol. Chem., 1999, 18, 1362–1369 CrossRef CAS.
- M. E. Hines, E. N. Poitras, S. Covelli, J. Faganeli, A. Emili, S. Zizek and M. Horvat, Mercury methylation and demethylation in Hg-contaminated lagoon sediments (Marano and Grado Lagoon, Italy), Estuarine, Coastal Shelf Sci., 2012, 113, 85–95 CrossRef CAS.
- S. C. Choi and R. Bartha, Cobalamin-mediated mercury methylation by Desulfovibrio desulfuricans LS, Appl. Environ. Microbiol., 1993, 59, 290–295 CAS.
- J. Benoit, C. Gilmour, A. Heyes, R. Mason and C. Miller, Geochemical and biological controls over methylmercury production and degradation in aquatic ecosystems, in Biogeochemistry of Environmentally Important Trace Elements, ed. Y. Cai and C. O. Braids, ACS Symposium Series, Washington, DC, 2003, vol. 835, pp. 262–297 Search PubMed.
- C. C. Gilmour, D. Krabbenhoft, W. Orem, G. Aiken and E. Roden, Appendix 3B-2: status report on ACME studies on the control of mercury methylation and bioaccumulation in the Everglades, in 2007 South Florida Environmental Report-Volume I, South Florida Water Management District, West Palm Beach, FL, 2007 Search PubMed.
- T. Zhang, B. Kim, C. Levard, B. C. Reinsch, G. V. Lowry, M. A. Deshusses and H. Hsu-Kim, Methylation of mercury by bacteria exposed to dissolved, nanoparticulate, and microparticulate mercuric sulfides, Environ. Sci. Technol., 2012, 46, 6950–6958 CrossRef CAS PubMed.
- J. K. Coleman Wasik, D. R. Engstrom, C. P. J. Mitchell, E. B. Swain, B. A. Monson, S. J. Balogh, J. D. Jeremiason, B. A. Branfireun, R. K. Kolka and J. E. Almendinger, The effects of hydrologic fluctuation and sulfate regeneration on mercury cycling in an experimental peatland, J. Geophys. Res.: Biogeosci., 2015, 120, 1697–1715 CrossRef CAS.
| This journal is © The Royal Society of Chemistry 2016 |

