 Open Access Article
Creative Commons Attribution 3.0 Unported Licence
High performance aliphatic-heterocyclic benzyl-quaternary ammonium radiation-grafted anion-exchange membranes†
Julia
Ponce-González
 *a,
Daniel K.
Whelligan
a,
Lianqin
Wang
a,
Rachida
Bance-Soualhi
a,
Ying
Wang
b,
Yanqiu
Peng
b,
Hanqing
Peng
b,
David C.
Apperley
c,
Himanshu N.
Sarode
d,
Tara P.
Pandey
d,
Ashutosh G.
Divekar
d,
Soenke
Seifert
e,
Andrew M.
Herring
d,
Lin
Zhuang
b and
John R.
Varcoe
a
aDepartment of Chemistry, University of Surrey, Guildford GU2 7XH, UK. E-mail: j.ponce@surrey.ac.uk
bDepartment of Chemistry, Wuhan University, Wuhan 430072, P. R. China
cDepartment of Chemistry, Durham University, South Road, Durham, DH1 3LE, UK
dDepartment of Chemical and Biological Engineering, Colorado School of Mines, Golden, Colorado 80401, USA
eX-ray Sciences Division, Advanced Photon Source, Argonne National Laboratory, Argonne, Illinois 60439, USA
First published on 3rd October 2016
Abstract
Anion-exchange membranes (AEM) containing saturated-heterocyclic benzyl-quaternary ammonium (QA) groups synthesised by radiation-grafting onto poly(ethylene-co-tetrafluoroethylene) (ETFE) films are reported. The relative properties of these AEMs are compared with the benchmark radiation-grafted ETFE-g-poly(vinylbenzyltrimethylammonium) AEM. Two AEMs containing heterocyclic-QA head groups were down-selected with higher relative stabilities in aqueous KOH (1 mol dm−3) at 80 °C (compared to the benchmark): these 100 μm thick (fully hydrated) ETFE-g-poly(vinylbenzyl-N-methylpiperidinium)- and ETFE-g-poly(vinylbenzyl-N-methylpyrrolidinium)-based AEMs had as-synthesised ion-exchange capacities (IEC) of 1.64 and 1.66 mmol g−1, respectively, which reduced to 1.36 mmol dm−3 (ca. 17–18% loss of IEC) after alkali ageing (the benchmark AEM showed 30% loss of IEC under the same conditions). These down-selected AEMs exhibited as-synthesised Cl− ion conductivities of 49 and 52 mS cm−1, respectively, at 90 °C in a 95% relative humidity atmosphere, while the OH− forms exhibited conductivities of 138 and 159 mS cm−1, respectively, at 80 °C in a 95% relative humidity atmosphere. The ETFE-g-poly(vinylbenzyl-N-methylpyrrolidinium)-based AEM produced the highest performances when tested as catalyst coated membranes in H2/O2 alkaline polymer electrolyte fuel cells at 60 °C with PtRu/C anodes, Pt/C cathodes, and a polysulfone ionomer: the 100 μm thick variant (synthesised from 50 μm thick ETFE) yielded peak power densities of 800 and 630 mW cm−2 (with and without 0.1 MPa back pressurisation, respectively), while a 52 μm thick variant (synthesised from 25 μm thick ETFE) yielded 980 and 800 mW cm−2 under the same conditions. From these results, we make the recommendation that developers of AEMs, especially pendent benzyl-QA types, should consider the benzyl-N-methylpyrrolidinium head-group as an improvement to the current de facto benchmark benzyltrimethylammonium head-group.
Broader contextThis article discusses the use of anion-exchange membranes (AEM) in alkaline polymer electrolyte fuel cells (also known as alkaline membrane fuel cells, anion-exchange membrane fuel cells, or solid alkaline fuel cells). As well as the employment of AEMs in non-electrochemical applications, such as for ion exchange and diffusion dialysis technologies (e.g. for acid recovery), AEMs are being developed for a wide range of electrochemical technologies such as Reverse Electrodialysis cells (RED is a salinity gradient power technology), biological fuel cells, and redox flow batteries (an electrochemical energy storage technology); these technologies are discussed in a previous review article [Varcoe et al., Energy Environ. Sci., 2014, 7, 3135]. There is also growing interest in the use of AEMs in alkaline water electrolysis technologies. As well as the aforementioned alkaline membrane fuel cells, this application requires AEMs that are stable in high pH environments (cf. the other technologies mentioned above do not require such alkali stable AEMs). Therefore, the AEMs discussed in this article should also be particularly applicable to this alternative technology alongside the alkaline membrane fuel cells discussed in this article. |
Introduction and background
Anion-exchange membranes (AEMs) are anion-conducting polymer electrolytes with potential uses in a range of electrochemical energy technologies.1,2 If the AEMs are to be used in devices such as alkaline polymer electrolyte fuel cells (APEFCs) then they must have good chemical stabilities in high pH environments as well as high hydroxide conductivities. Once suitable AEMs are available, an ultimate ambition for the development of APEFCs is the potentially wider range of non-Pt catalysts that can be used.3–6 Recent developments of candidate AEMs, that can be produced in larger quantities, include a poly(benzimidazolium)-type AEM reported by Wright et al.,7 QAPS-type polysulfone copolymers such as those reported by Pan et al.8 and the interpenetrating network type AEM reported by Hickner et al.9A recent small molecule study by Marino and Kreuer suggests that AEMs containing aliphatic heterocyclic quaternary ammonium (QA) cationic head groups, the positively charged groups covalently bound to the AEMs that allow anion conduction, will exhibit enhanced alkali stabilities compared to the current de facto benchmark benzyltrimethlammonium head group:10 the benzyl-N-methylpiperidinium molecule showed ca. twice the half-life of the benchmark under extreme accelerated test conditions. Other recent reports also point to the excellent stability and conductivity afforded by polymer bound N-alkylpyrrolidinium cations.11,12 AEMs containing benzyl-N-methylmorpholinium head groups have also reported higher alkaline stabilities than the commercially available Tokuyama A201 AEM.13 Alkali stable cationic head-group chemistries can also include more chemically complicated, metal-containing types such as the permethyl cobaltocenium chemistry reported by Gu et al.14
Radiation-grafting is a convenient method for the repeatable production of large lab-scale batches of different polymer electrolyte membranes, including both cation- and anion-exchange types.15,16 This radiation-grafting method is useful for fundamental studies: these include the ability to compare the properties of a range of AEMs where they feature comparable ion-exchange capacities (IEC) and backbone chemistries but different cationic head group chemistries (i.e. the only effective variable between the different AEMs is the nature of the cationic head group).17,18
This study combines the radiation-grafting method for the production of AEMs19 with benzyl-linked saturated-heterocyclic QA head groups. It will be shown that a radiation-grafted AEM containing a benzyl-N-methypyrrolidinium head group is the most promising in terms of relative alkaline stability and outperforms the benzyltrimethylammonium benchmark.
Experimental
Materials
Poly(ethylene-co-tetrafluoroethylene) Nowoflon ET 6235Z film (ETFE, 50 μm thick) was supplied by Nowofol Kunstoffprodukte GmbH (Germany): it is a dense film of very low porosity with a density of 1.75 g cm−3. Vinylbenzyl chloride monomer (VBC, mixture of meta and para isomers containing 700–1100 ppm nitromethane Friedel–Crafts inhibitor and 50–100 ppm tert-butylcatechol polymerisation inhibitor), surfadone LP-100 (1-octyl-2-pyrrolidone) surfactant, aqueous trimethylamine (TMA, 45%w/w), N-methylpiperidine (MPRD, 99%), 4-methylmorpholine (MMPH, 99.5%), 1-methylpyrrolidine (MPY, 97%), 1-methylpiperazine (MPZ, 99%) and 1,4-dimethylpiperazine (DMPZ, 98%) were purchased from Sigma-Aldrich (UK). Propan-2-ol and toluene were of reagent grade and supplied by Fisher Scientific (UK). Pt/C (60%w/w) and PtRu/C (60%w/w(metal/C)) catalysts were purchased from Johnson Matthey. The preparation of aQAPS-S14 alkaline ionomer solution has been reported in detail in a previous publication.20 As previously reported, this polysulfone-based anion-exhcange ionomer has sufficient stability in alkali to allow for its routine use in fuel cell tests.Preparation of the VBC-grafted intermediate membranes (ETFE-g-VBC)
ETFE-g-VBC membranes were prepared by post-irradiation grafting (PIG) of VBC onto ETFE film as described in previous reports17 and as summarised below. 50 μm thick ETFE films (15 × 15 cm) were irradiated in air to a total absorbed dose of 70 kGy (±10%) via cumulative 10 kGy passes on a commercial 4.5 MeV electron-beam (Synergy Health Sterilisation UK Ltd). The irradiated ETFE films were immersed into the grafting solution consisting of propan-2-ol (79%v/v) diluent, VBC (20%v/v) and surfactant (1%v/v) and purged with a continuous flow of N2 for at least 4 h. The grafting mixture was then stirred under N2 at 70 °C for 72 h. The resultant ETFE-g-VBC films were extracted and washed with toluene at 70 °C for 24 h and dried in the vacuum oven at 70 °C for 4–5 h.Amination of ETFE-g-VBC films to yield the target anion-exchange membranes (AEM)
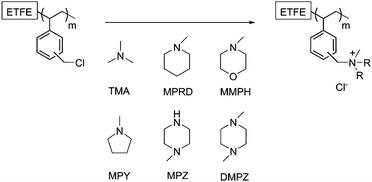
ETFE-polyvinylbenzyl-(PVB)-type quaternary ammonium (QA) anion-exchange membranes (AEM) with different heterocyclic QA head groups (designated PVB-X, where X = amine used for quaternisation, see Fig. 1) were prepared by the immersion of the ETFE-g-VBC films in a 50%v/v aqueous solution of the corresponding heterocyclic amine and stirred at 80 °C for 24 h. For the PVB-TMA benchmark AEM, the ETFE-g-VBC films were immersed in commercial aqueous TMA (45%w/w) and stirred at room temperature for 24 h (do not heat aqueous TMA solutions for safety reasons). All of the AEMs were prepared from the same batch of ETFE-g-VBC to aid relative comparisons. The synthesised AEMs were then washed and boiled in 18.2 MΩ cm ultrapure water (UPW) for 4 h to remove any excess, unreacted amine. The Cl− anions forms of the as-synthesised AEMs were ensured by soaking the AEMs in excess aqueous NaCl (analytical grade, 1 mol dm−3) solutions for 24 h (changing with fresh solution at least twice) followed by multiple washes with UPW to remove any excess Na+ and Cl− ions (so that the only free ions present are the Cl− counter anions that are charge balancing the positive QA groups that are covalently bound to the AEMs: i.e. there are no metal co-ions). The AEMs were stored in UPW, in the AEM(Cl−) form, until required for characterisation or testing.Ion exchange capacities (IEC) determinations
Quaternary-IECs determinations (IECQN, mmol of charged N atoms only per g of dry Cl−-form AEM) were conducted on the as-synthesised AEM(Cl−) membranes. This ensures the determination of this fundamental, intrinsic AEM property before they have been exposed to any alkalis: this eliminates any extreme pH-derived degradation, which would interfere with the IECQN values determined. IECQN were measured using the dried AEM samples recovered from WU measurements (see below). The AEM samples were soaked in aqueous NaNO3 (20 cm3, 2.4 mol dm−3) overnight and acidified with HNO3 (2 cm3, 2 mol dm−3). The displaced Cl− ions were then titrated with aqueous AgNO3 (20.00 ± 0.06 mmol dm−3) on a Metrohm 848 Titrino plus autotitrator. The IEC (mmol g−1) values were calculated using eqn (1) (means and sample standard deviations calculated with n = 4), where EP (cm3) is the determined end point and md (g) is the dry mass of each AEM sample.| IEC = EP × 0.02/md | (1) |
For the PVB-MPZ and PVB-DMPZ AEMs, the total exchange capacity determinations, IECtotal being the sum of mmol of both charged and uncharged N atoms per g of dry Cl−-form AEM, were determined (n = 4 samples of each AEM). Dry weighted (md) samples were pre-treated with aqueous HCl (1 mol dm−3) for 12 h (changing the solution at least twice): the HCl quaternises any uncharged N atoms present (e.g. tertiary –NR2 converted to –N+R2H Cl− groups). After thorough washing with UPW, the samples were soaked in aqueous NaNO3 (20 cm3, 2.4 mol dm−3) overnight and acidified with HNO3 (2 cm3, 2 mol dm−3). The titration process (and calculations) from then on were exactly the same as for the IECQN determination described above.
Gravimetric water uptakes (WU) measurements (fully hydrated)
Four samples of each AEM(Cl−) in the as-synthesised hydrated forms (ca. 2 × 2 cm in size) were cut, quickly placed in between filter paper to remove any excess surface water, and immediately weighed on an analytical balance (mass obtained = mh). Samples were then dried overnight in the vacuum oven at 50 °C and weighted again (mass = md). Gravimetric water uptakes (WU) were calculated according to eqn (2) (means and sample standard deviations calculated with n = 4):| WU (%) = 100 × (mh − md)/md | (2) |
| SDt (%) = 100 × (th − td)/td | (3) |
WU measurements (humidified atmospheres)
AEM samples of ca. 1 cm × 1 cm were cut and vacuum dried overnight at ambient temperature before undergoing gravimetric weight measurements using a dynamic vapour sorption instrument (Surface Measurement Systems, DVS-Advantage 1). Dynamic weight changes of the samples were measured as a function of relative humidity (RH) at 60 °C in N2 environments. The RH was increased from a dry setpoint of 0% RH to 95% RH (20% RH steps were used between 0% and 80%): 4 h equilibration was used for the 0% RH dry step, 1 h each at 20, 40, 60, and 80% RH, and 2 h at 95% RH. The equilibrated mass at each RH was used for WU calculations (eqn (4)), where m%RH is the mass of the AEM sample under a given RH:| WURH (%) = 100 × (m%RH − md)/md | (4) |
| λ = WURH/(MWH2O × IECQN) | (5) |
Relative ex situ alkali stabilities of the heterocyclic AEMs synthesised vs. the PVB-TMA benchmark AEM
Approximately 10 × 10 cm sized samples of each AEM were immersed in aqueous KOH (1 mol dm−3) solutions, purged with N2 for 1 h (to minimise the O2 and CO2 contamination of the solutions) and immediately sealed in polypropylene plastic bottles. These sealed bottles were placed in an oven at 80 °C for 28 d. The two most stable AEMs were also tested in even more accelerated conditions by using aqueous KOH (6 mol dm−3) solution. The KOH-aged AEMs were then re-exchanged into the Cl− forms by aqueous NaCl (1 mol dm−3) and UPW treatment as described previously. IEC values were determined using the same methods as described above. Other experiments (spectroscopic, elemental analysis etc.) were conducted on the alkali aged AEMs as required (details given below).Cl− anion conductivity (through plane) determinations with fully hydrated AEMs at 25 °C
The fully hydrated, Cl− conductivities of AEM samples were measured using a Solartron 1260 frequency response analyser/Solartron 1287 electrochemical interface combination controlled by ZPlot software (Scribner Associates). Electrical resistance values were extracted from the data analyses using ZView software.21 For the determination of through-plane Cl− conductivities (σTP), fully hydrated AEM samples were first cut to a circular diameter ∅ = 2.2 cm and then hot-pressed between two carbon cloth electrodes (∅ = 1.3 cm, CeTech) with 150 ± 50 kg cm−2 force for 3 min at 80 °C: the carbon-cloth electrodes were pressed so that the PTFE-bonded C-black sides were pressed against the AEM and the C-fibre sides face away from the AEM. The resulting mini-membrane electrode assemblies (mMEAs) were then soaked in UPW for 18 h to fully rehydrate at room temperature. The mMEAs were fixed between two graphite plates and impedance spectra (Nyquist plots) were recorded at 25 °C in UPW. The 2-probe through-plane conductivity (S cm−1) was calculated according to eqn (6), where t is the AEM sample thickness (cm), A is the electrode area (1.33 cm2) and R is the resistance (Ω) taken from the high frequency intercept of the x-axis in the Nyquist plot: R values were corrected for the electronic contributions from the electrodes.| σTP = t/(A × R) | (6) |
OH− and Cl− (in plane) anion conductivity determinations in humidified atmospheres
The Cl− anion conductivities of the fully hydrated AEMs (above) are important as these are the intrinsic conductivities of the as-synthesised membranes before they have been exposed to any acid or alkali treatment (or major dehydration). However, OH− conductivities under a humidified atmosphere are more directly relevant to the target applications, including APEFCs. Hence, these were measured (in a 95% RH atmosphere) for the AEMs with alkali stabilities that were more stable than the PVB-TMA benchmark AEM. To aid direct comparison (to provide complementary data from multiple test sites), the Cl− ion conductivities were also re-recorded but now under a 95% RH atmosphere. Measurements with both ions were collected on the dedicated in-plane conductivity equipment as reported previously and described below.22Electrochemical impedance spectroscopy was used to measure in-plane ionic conductivity of AEM samples. A BekkTech cell with four Pt electrodes was used for OH− conductivity measurements; for the Cl− measurements, a slightly different home-made (four Pt electrode) cell was used. Impedance spectra were obtained over a frequency range from 500 kHz–1 Hz using a 16 channel VMP3 potentiostat (Bio Logic Scientific Instruments). Each conductivity value is the mean of eight to nine replicates ran on three different samples of each AEM. Sample preparation methodology for the Cl− and OH− AEM forms was different. For the Cl− conductivity measurements, the AEM samples were equilibrated, and tested, in a temperature and humidity controlled oven (Test Equity Model 1007H). The temperature was swept from 30–90 °C at 95% RH.
Samples for OH− conductivity measurements were soaked in aqueous NaOH (1 mol dm−3) solution in a CO2 free glove box for 24 h and were washed in UPW for 4 times over 24 h to remove any excess OH− ions. The OH− samples were transferred to the BekkTech cell in the glove box and the cell was transferred to the conductivity test stand as described below. Care was taken to not expose the sample to air (i.e. CO2) at any time during this process. In-plane OH− conductivities were measured at 95% RH over a temperature range of 30–80 °C. A fuel cell testing stand was modified to incorporate the 4 electrode BekkTech conductivity cell. Humidity in the cell was maintained at 95% RH using a humidified gas supply achieved by flowing dry ultrahigh purity (UHP) N2 gas through a heated humidity bottle (Fuel Cell Technologies): gas flow rates were controlled by two mass flow controllers (1 SLPM, MKS, Andover, MA, USA). All gas lines and the conductivity cell were temperature controlled using external heaters. All temperature and humidity setpoints were controlled by LabView software.
In-plane conductivities (S cm−1) were calculated according to eqn (7), where d is the distance between the two inner potential Pt sense wires (cm), t is the membrane thickness (cm), W is the membrane width (cm) and R is the resistance (Ω) taken from the low frequency intercept of the x axis in the Nyquist plot.
| σIP = d/(t × W × R) | (7) |
An additional extended ex situ stability test was conducted on PVB-MPY in the OH− form at 60 °C and 95% RH by flowing UHP nitrogen for 2 weeks in the modified (CO2 free) BekkTech setup. The in-plane conductivity of the AEM was measured every 20 min.
Spectroscopic, thermal, and elemental analyses
Solid state NMR (SS-NMR) spectra were collected at the EPSRC mid-range national service (University of Durham). The 13C and 15N solid state spectra (cross polarisation, 6.8 and 5.5 kHz magic-angle spinning, respectively) were obtained on a Varian VNMRS spectrometer (1H resonance = 400 MHz) using neat tetramethylsilane and nitromethane, respectively, as external shift references. 19F solid state spectra (direct excitation, 14 kHz magic-angle spinning frequency with no-decoupling) were obtained on a Bruker Avance III HD spectrometer (1H resonance = 400 MHz) using CFCl3 as an external shift reference. To record spectra of the AEMs, the samples were dried in a relative humidity RH = 0% desiccator to remove excess water. Chemical shifts (δ) are reported in ppm vs. the relevant shift references.Raman spectra and cross-sectional Raman spectroscopic maps were recorded on a DXR Raman Microscope (Thermo Fisher, UK) using a λ = 780 nm (24 mW power) or λ = 532 nm (10 mW power) laser with a resolution of 4 cm−1. For the cross-section mapping of the ETFE-g-VBC intermediate film, samples were sandwiched and pressed in a metal holder and freshly cut with a scalpel (to expose a cross section that allowed spectra to be recorded across the thickness of the samples). Maps were recorded across 30–50 × 60 μm cross-sectional areas (the latter dimension being the thickness of the samples) with spectra recorded in 1 μm steps in both the x–y direction.
Elemental analyses were performed at the Warwick Analytical Service. In order to evaluate the variation of N or Cl content on the alkali aged membranes, the % loss was calculated according to the formula (eqn (8)):
 | (8) |
Thermogravimetric analysis (TGA) were carried out on a TGA Q500 (TA Instruments). Samples were heated from ambient to 600 °C at a heating rate of 5 °C min−1 under a N2 gas flow.
Small angle X-ray scattering (SAXS)
SAXS measurements were performed at the beamline 12-ID-C at Advanced Photon Source, Argonne National Laboratory (Argonne, IL, USA) in a transmission mode with data acquisition time of 0.1 s and X-ray energy of 18 keV. Scattering spectra for all samples, with Kapton® background, were collected at 60 °C. For water soaked measurements, the samples were soaked in water for 2 h and quickly transferred to the oven that was maintained at 95% RH. The SAXS spectra were collected immediately to avoid the loss of water from drying out the samples. For SAXS measurements of AEMs samples treated under boiling conditions, fresh pieces of AEM samples were boiled in water for 30 min and quickly transferred to water-saturated oven at 60 °C for spectra collection.H2/O2 alkaline polymer electrolyte fuel cell (APEFC) benchmarking tests (60 °C) with Pt-based catalysts
Pt/C or PtRu/C catalysts (60%w/w in metal content) were ultrasonically mixed with the aQAPS-S14 ionomer solution23 to yield inks containing 20%w/w of ionomer and 80%w/w of catalyst: the PtRu anode ink and the Pt cathode ink was sprayed the correct sides of the test AEM (generally 100 ± 2 μm in thickness when fully hydrated) to produce a catalyst-coated membrane (CCM). The metal loading in both anode and cathode was controlled to be 0.4 mg cm−2, and the electrode area was 4 cm2. The prepared CCM was then converted to OH− form by immersing in aqueous KOH (1 mol dm−3) solution for 12 h followed by thorough washing with UPW. The resulting CCM was positioned between two pieces of Teflon-treated carbon paper (AvCarb GDS3250) to make the membrane electrode assembly (MEA) in situ: no hot-pressing was used. Single cell APEFCs were tested using an 850E Multi Range fuel cell test station (Scribner Associates, USA) in a galvanic mode at 60 °C. H2 and O2 were humidified at 60 °C (100% RH) and fed with a flow rate 400 cm3 min−1 with a back-pressure of either 0 or 0.1 MPa symmetrically on both sides. The cell voltage at each current density was recorded after the power output stabilised. Fuel cell testing was also conducted on thinner MPRD-, MPY- and TMA-based AEMs made from 25 μm thick ETFE (of the same grade from the same supplier as the 50 μm thick ETFE): the fully hydrated thicknesses of these E25-PVB-X AEMs were 51–52 μm.Results and discussion
Synthesis of the AEMs
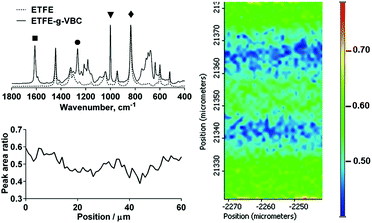
In the first step of the synthesis of the AEMs, VBC monomer was radiation-grafted into the ETFE films (Fig. 1) as has previously been reported.17 ETFE represents an excellent substrate for the production of radiation-grafted membranes due to its high yield of radical formation upon irradiation and good retention of the mechanical properties.16 The Raman spectra of the resulting ETFE-g-VBC intermediate film is shown in Fig. 2 (top left). The appearance of new bands in addition to that of the ETFE-precursor confirmed the successful grafting of the poly(VBC) chains. The most diagnostic of these correspond to the aromatic ring band (1615 cm−1, ■),24 the CH2Cl deformation (1270 cm−1, ●),19 and a very intense band at 1000 cm−1 (▼) characteristic of the meta isomer of di-substituted phenyl rings (this band is not seen in the para isomer: recall that the VBC used contains both meta and para isomers).24Spatially-resolved Raman spectro-microscopy was performed on the cross-sections of a ETFE-g-VBC sample to investigate the distribution of the poly(VBC) graft chains across the thicknesses of the membrane. The extent of the grafting was estimated from the ratio between the area of the 1615 cm−1 (■) band, related to the grafted poly(VBC) chains, and the area of the 830 cm−1 (✦) band (assigned to the CF2 stretching in the ETFE backbone):25 hence we are using the ETFE-based band (830 cm−1) for internal normalisation. Fig. 2 (right) reproduces the map of the ETFE-g-VBC cross-section represented by this peak area ratio. From this map it can be observed that the degree of grafting is slightly higher at the edge and in the middle of the membrane. Additional maps collected on different cross-sectional regions of the ETFE-g-VBC intermediate are presented in ESI,† Fig. S1. This is congruent with the grafting front mechanism.26–28 According to this mechanism, the grafting process starts on both surfaces and propagates towards the centre of the film (as the new graft chains allow the swelling of the polymer and further inward diffusion of the monomer). It appears that a small grafting enhancement occurs in the centre of the ETFE-g-VBC membrane where the grafting process stops as the two grafting fronts meet. Nevertheless, as shown in the select line-map shown in Fig. 2 (bottom left), the poly(VBC) is grafted throughout the ETFE-g-VBC thickness and the peak area ratio predominantly ranges between 0.4 and 0.6.
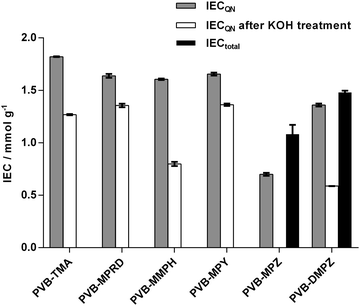
Once the ETFE-g-VBC intermediate was obtained, AEMs with the different head groups could be prepared by treatment of different samples with TMA and the 5 different saturated-heterocyclic amines. WUs and IECs are tabulated in ESI,† Table S1 and the latter is presented in Fig. 3. MPRD, MMPH and MPY amines afforded AEMs with IECQN values that were slightly lower compared to the PVB-TMA benchmark AEM. However, DMPZ and particularly MPZ led to AEMs with significantly lower IECQN values. Since the latter two are diamines, and possess two active N atoms, they may give rise to a degree of cross-linking between graft chains. To obtain further insights into this, total exchange capacities (IECtotal) were measured for the two AEMs synthesised using these piperazines: IECtotal is the combined content of quaternary ammoniums and tertiary and secondary amines. The difference between IECQN and IECtotal indicates that the piperazine groups are predominantly cross-linked in PVB-DMPZ: only a 16% of the N atoms remain as tertiary amines. In accordance to this, two bands (δ = −325 and −345) of different intensities corresponding to tertiary and quaternary amines can be observed in the 15N SS-NMR spectra of the PVB-DMPZ (ESI,† Fig. S2). In contrast, all AEMs prepared from monoamines yield one 15N SS-NMR peak each. In the case of the PVB-MPZ, the presence of secondary and tertiary amine groups in the starting amine makes difficult to elucidate the predominant structure of the final AEM (>2 peaks in the 15N SS-NMR spectrum). The extremely low WU (ESI,† Table S1) and low IECQN values recorded for PVB-MPZ suggests a combination of crosslinking plus reaction of the secondary N with the poly(VBC) grafts, yielding an AEM containing a large proportion of uncharged tertiary N atoms.
Effect of alkali on the chemistries of the AEMs
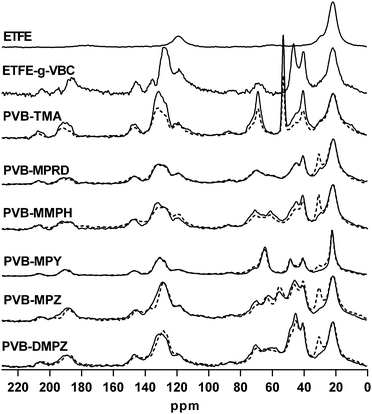
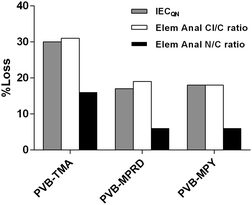
In order to test the relative alkali stabilities of the AEMs synthesised, ex situ aging treatment was conducted with AEMs submerged in aqueous KOH (1 mol dm−3) at 80 °C for 28 d. The analysis of the post-mortem membranes showed a variable loss of the IECQN that was dependent on the cationic head group present (Fig. 3). PVB-MMPH and PVB-DMPZ both showed a loss of >50% of the positive charges, while PVB-MPZ yielded a total loss of IECQN. For these three AEMs the IECQN losses were significantly higher than for the PVB-TMA benchmark (30%). In contrast, PVB-MPRD and PVB-MPY showed higher relative alkali stabilities with only 17% and 18% losses in IECQN, respectively, compared to the benchmark AEM (30% loss). The question we will address later is – could PVB-MPRD or PVB-MPY be the next generation benchmark radiation-grafted AEM?To get further insights about the alkali degradation, a comparative spectroscopic study of the pre- and post-alkali aged samples was also conducted. The 19F SS-NMR spectrum of ETFE showed characteristic peaks as shown in ESI,† Fig. S3.19,25 These include a peak appearing at δ = 124 due to the tetrafluoroethylene component25 and additional peaks at δ = −75 and δ = −81: these relate to a portion of the ETFE containing head-to-head (rather than head-to-tail) arrangement of repeat units as well as the incorporation of another fluorinated component (containing –CF3 groups) in the commercial ETFE films use in this study.19 As previously observed,18 the 19F SS-NMR spectra remain unchanged during both the radiation-grafting and subsequent amination processes. Additionally, the 19F SS-NMR spectra of the alkali aged AEMs overlap perfectly the pre-aged spectra for all AEMs: no significant chemical degradation takes place on the ETFE backbone of the radiation-grafted AEMs on alkali treatment.
The 13C SS-NMR spectra of the precursor ETFE, the ETFE-g-VBC intermediate membrane and the PVB-X AEMs before and after the alkali aging process are shown in Fig. 4. The assignment of the bands appearing in the spectra of EFTE, the ETFE-g-VBC intermediate and the benchmark PVB-TMA AEM have been previously reported.19 Upon the alkali treatment, the spectra of the PVB-TMA AEM showed a significant decrease in intensity of the band corresponding to the quaternary ammonium methylene carbons (δ = 53), as well as the bands related to the polymeric benzyl grafts (δ = 146, 131, 118, 47, 41). This suggests that, not only is there loss of some of the QA groups but that whole parts of the polymeric benzyl grafts are lost on alkali treatment. The spectra of PVB-MMPH, PVB-MPZ and PVB-DMPZ also showed significant spectral variations on alkali treatment. By contrast, the spectra of PVB-MPRD and PVB-MPY remains essentially unchanged on alkali treatment, with the exception of the enhancement or narrowing of the band at δ = 30. This band, already present on the starting ETFE film, has been ascribed to the presence of amorphous polyethylene chains,29 which can vary in peak profile (shape) as a result of changes in the morphology of this polymeric component.
The Raman spectra recorded on the AEMs showed that the alkali aging lead to changes of the relative intensities of the Raman bands for PVB-TMA, PVB-MMPH and PVB-MPZ (ESI,† Fig. S4). By contrast, minimum differences were seen when comparing the pre- and post-alkali aged Raman spectra of PVB-MPRD and PVB-MPY. Furthermore, TGA data (ESI,† Fig. S5) revealed larger mass losses below 250 °C (loss of QA moieties) after alkali treatment in the traces for PVB-TMA, PVB-MMPH and PVB-DMPZ (compared to the TGA data recorded with the as-synthesised AEMs) than observed for PVB-MPRD and PVB-MPY. This further corroborates the IECQN loss data.
Spectral, TGA, and IEC data all corroborate and indicate that MPRD and MPY head groups lead to more chemically stable AEMs relative to the TMA benchmark (the finding that the MPY headgroup is more stable than TMA is aligned with prior reports),10–12 whereas MMPH-, MPZ- and DMPZ afforded AEMs of lower alkali stability. For this reason, this paper will, from now on, focus on the PVB-MPRD and PVB-MPY AEMs in comparison to the PVB-TMA benchmark.
All the AEMs in this work exhibit a loss of QA groups upon the treatment with aqueous KOH (1 mol dm−3) at 80 °C for 28 d. This loss can derive from different mechanisms, some of which involve loss of N atoms from the polymer backbone. To assess this, elemental analyses of C, H, N and Cl atoms was performed on the pre- and post-treated AEMs with the highest stability (as measured by % loss of IECQN). Fig. 5 compares the loss of IECQN to the loss of N and Cl contents (relative to C) in the down-selected AEMs. The numerical data is summarised in ESI,† Table S2. As expected, the loss of Cl content strongly correlates with the loss of positive charges (IECQN loss). However, the loss of N content does not correlate, indicating that multiple degradation mechanisms are taking place. The difference between the Cl/C and N/C losses relates to the loss of positive charges in the AEM that does not involve the cleavage of the N atoms from the polymer. This difference between Cl/C and N/C loss values is similar for all three AEMs and is in the range 12–14% (last column in ESI,† Table S2).
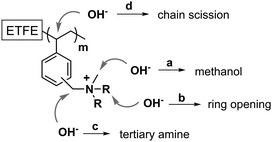
As is widely reported for methyl-containing head groups,30–32 a viable degradation pathway is the SN2 substitution at a methyl group leaving a polymer containing a benzyl-linked secondary amine and the loss of methanol (pathway a in Fig. 6). PVB-MPRD and PVB-MPY can also lose positive charges, without loss of N atoms, via nucleophilic attack or Hofmann elimination reactions that lead to heterocyclic ring opening (pathway b in Fig. 6). However, the loss of charged groups with retention of N atoms in the AEM depends on the nature of the head group. PVB-MPRD and PVB-MPY show only a 6% loss of N content (cf.PVB-TMA with a 16% loss of N content). Benzylic ϕ–CH2–N positions are well known to be especially sensitive to nucleophilic attacks (pathway c in Fig. 6):32,33 this is often considered the primary degradation pathway. Nevertheless, there is another benzylic position available for OH− nucleophilic attack: the CH-group on the grafted polymer chains where the benzene ring is attached (pathway d in Fig. 6). The attack of OH− anion at this position can lead loss of larger benzyl-QA fragments. This is consistent with the loss of benzene-ring derived band intensity the 13C NMR and Raman spectra of alkali aged PVB-TMA (see Fig. 4 and ESI,† Fig. S4). These degradation pathways appear to be less prevalent in the PVB-MPRD and PVB-MPY heterocyclic AEMs. This partially relates to the higher basicity of MPRD and MPY compared to TMA,34 which make these amines poorer leaving groups.
The small amounts of samples of PVB-MPY and PVB-MPRD AEMs that were remaining after all other experiments had been conducted were evaluated under even more highly accelerated degradation conditions (i.e. tested in aqueous KOH at a higher concentration of 6 mol dm−3 at 80 °C for 28 d). The IECQN values decreased more significantly when treated in these harsher conditions (see ESI,† Table S2), as expected, but the drops in IECs (25–28%) were still lower than found with the PVB-TMA AEM (30%) tested in the lower concentration aqueous KOH (1 mol dm−3). This again demonstrates that the PVB-MPY and PVB-MPRD AEMs have a higher stability in alkali test conditions compared to the prior benchmark chemistry. Note, even though N-methylpiperidine (MPRD) and 1-methylpyrrolidine (MPY) are slightly more expensive than TMA, the estimated production cost of these new AEMs (on an initial development and materials basis at the laboratory scale) is still below the price of commercially available ion-exchange membranes (see ESI,† Table S3 for cost estimations).
Ion conduction
Once PVB-MPRD and PVB-MPY were identified as the most stable heterocyclic AEMs, ion conducting properties were evaluated. In the first instance, the through-plane conductivity data was measured for the fully hydrated AEMs in the as-synthesised Cl− form at 25 °C (Table 1 and ESI,† Table S1). The in-plane conductivities were also recorded for PVB-MPY and PVB-MPRD in the OH− and Cl− forms in 95% RH atmospheres at different temperatures (Table 1 and Fig. 7) and compared to the prior published OH− conductivities of PVB-TMA.22| AEM | Thickness (fully hydrated)/μm | IECQN/mmol g−1 [n = 4] | σ TP (25 °C)/mS cm−1 [n = 4] | σ IP,Cl (90 °C)/mS cm−1 [n = 24] | σ IP,OH (80 °C)/mS cm−1 [n = 24] | P max (60 °C, 0 MPa)/mW cm−2 | P max (60 °C, 0.1 MPa)/mW cm−2 |
|---|---|---|---|---|---|---|---|
| PVB-TMA | 110 | 1.820 ± 0.002 | 14 ± 2 | 27 ± 11 | 132 ± 20 | 500 | 640 |
| PVB-MPRD | 106 | 1.638 ± 0.014 | 16.9 ± 1.6 | 49 ± 1 | 138 ± 1 | 360 | 470 |
| PVB-MPY | 115 | 1.655 ± 0.013 | 20 ± 2 | 52 ± 1 | 159 ± 5 | 630 | 800 |
| E25-PVB-TMA | 51 | 2.47 ± 0.02 | — | — | — | 700 | 970 |
| E25-PVB-MPRD | 52 | 2.125 ± 0.011 | — | — | — | 510 | 660 |
| E25-PVB-MPY | 52 | 2.09 ± 0.04 | — | — | — | 800 | 980 |
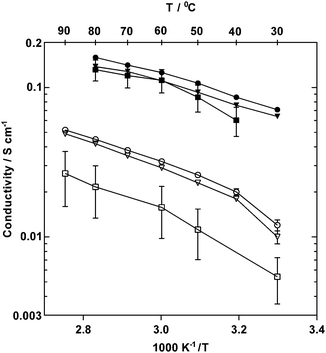 | ||
| Fig. 7 In-plane ionic conductivities of PVB-TMA (■, data taken from ref. 22), PVB-MPY (●) and PVB-MPRD (▼) AEMs under 95% RH in Cl− (open symbols, 30–90 °C) and OH− forms (filled symbols, 30–80 °C). Error bars are standard deviations (n = 24). | ||
For OH− forms, activation energies, Ea, of 15 and 14 kJ mol−1 were obtained for PVB-MPY and PVB-MPRD, respectively (calculated assuming Arrhenius behaviour), which appears lower than the average 19 kJ mol−1 previously reported for the PVB-TMA.22 However, it should be noted that the higher temperature data points for PVB-TMA are lower than the trend of the first three values, possibly indicating that PVB-TMA was not as stable at the higher temperatures studied. The Cl−Ea values were higher, 17 and 19 kJ mol−1 for PVB-MPY and PVB-MPRD, respectively, at temperatures ≥40 °C. The lower activation energies obtained for the hydroxide form of the MPY and MPRD AEMs compared to TMA shows that anionic conductivity is enhanced (for both), presumably due to better dissociation. OH− anions in these AEMs have much higher conductivities, which is presumably a result of the ability of OH− to Grotthuss hop.22,35 The OH− conductivities in a 95% RH atmosphere were 126 and 111 mS cm−1 for PVB-MPY and PVB-MPRD at 60 °C, respectively, which increased to 159 and 138 mS cm−1 at 80 °C. These values at 95% RH are comparable to those measured with AEMs with significantly higher IECs.35 The Cl− conductivities in a 95% RH atmosphere at 90 °C were 52 and 49 mS cm−1 for PVB-MPY and PVB-MPRD, respectively, which are good values for Grotthus-free ion conduction. Comparison with the conductivities of other AEMs measured under humidified atmosphere conditions shows that the Cl− and OH− conductivities of these new PVB-MPY and PVB-MPRD AEMs are amongst the highest reported by in the literature (literature survey data presented in ESI,† Table S4).
In addition, the temporal change in OH− conductivity of the most conducted AAEM synthesised (PVB-MPY) was tested in a CO2-free 95% RH atmosphere at 60 °C (see Fig. 8); this represents a test where the stability of PVB-MPY is evaluated in the OH− form in a humidified atmosphere without the presence of excess metal hydroxide co- and counter-ions (i.e. the AEM is not submerged in aqueous KOH). Over a period of 2 weeks, the conductivity of the AEM decreased by <7%, with high OH− conductivities remaining (ca. 100 mS cm−1). This result shows that this AEM is not only stable enough for detailed study but that it could be employed in AEM enabled devices (including “disposable-type” fuel cells).
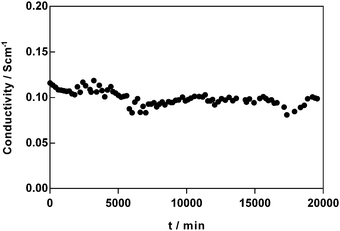 | ||
| Fig. 8 Changes in OH− conductivity of PVB-MPY AEM at 60 °C and 95% RH, over a period of 2 weeks (in a CO2-free N2 environment). Only every 10th datapoint is plotted for visual clarity. | ||
Water uptakes (WU) and swelling degree (SD, through-plane)
Fig. 9 presents the water uptakes and λ values, the number of H2O molecules per cationic head group, which were measured for the Cl− form AEMs as a function of relative humidity (RH). The WU (%) values for fully hydrated AEM(Cl−)s are presented in ESI,† Table S1. Both AEMs, PVB-MPRD and PVB-MPY, had similar WUs at 40% RH or below. The PVB-MPRD then showed larger WUs at higher RHs than PVB-MPY (the WUs for the PVB-MPRD AEM were 10, 21, and 43% larger at 60, 80, and 95% RH, respectively). As expected, the calculated λ values behaved similarly: they were again comparable up to RH 40%, but the WUs for PVB-MPRD were 7, 18, and 40% larger at 60, 80, and 95% RH, respectively, than observed for the PVB-MPY. However, both of AEMs had more than minimum λ values (λ = 4–5) needed for ion transport.36–38 Similar WU values were reported in previously reported, highly conductive PPO-b-PVB-TMA type AEMs.35 The higher WUs of the PVB-MPRD relative to the PVB-MPY AEM (both with the same IEC) correlates to the through-plane swelling (ESI,† Fig. S6). This may be a factor in the lower conductivity of the PVB-MPRD AEM: the higher swelling may be diluting the concentration of charge carriers. On the other hand, the higher water solvation of MPRD and MPY head-groups compared to TMA may be related to their higher relative stability in alkaline media.39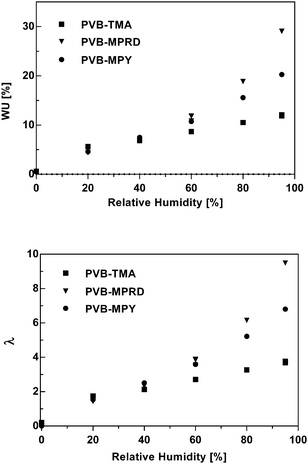 | ||
| Fig. 9 WU and λ values (number of water molecules per cationic head group), calculated for the PVB-TMA, PVB-MPRD and PVB-MPY AEMs in the Cl− forms at 60 °C as a function of RH. The PVB-TMA data was previously published in ref. 22. | ||
SAXS measurements
SAXS measurements were performed to get further insights into the membrane morphology and its change as a function of water contents. SAXS spectra of PVB-TMA, PVB-MPRD and PVB-MPY AEMs both in wet, dry and 95% RH atmospheres are included in the ESI,† (Fig. S7). A shoulder feature observed at ca. q = 0.022 Å−1, that corresponds to a d-spacing of ca. 29 nm, stayed constant with the change in humidity from dry to wet. In the case of the PVB-TMA benchmark,22 a similar d-spacing shoulder was found at 39 nm. However, on hydration the AEMs with the MPY and MPRD cations showed a peak at q = 0.011 Å−1 which corresponds to a swollen d-spacing of 57 nm in contrast to the PVB-TMA polymer. For all three samples, no changes could be observed after the water boiling treatment.H2/O2 fuel cell performance benchmarking with Pt-based catalysts
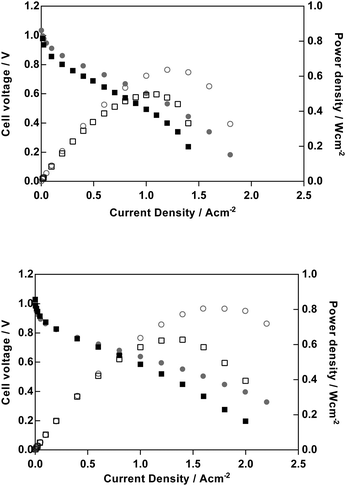
Obviously, one of the primary motivations for developing AEMs is to develop alkaline polymer electrolyte fuel cells (APEFC) that are Pt-free and ultimately to contain no precious metal catalysts at all. However, for early stage polymer electrolyte development programmes, Pt-based APEFC benchmarking is important to aid inter-laboratory comparisons (due to the high availability of quality controlled commercial Pt-based fuel cell catalysts). Recently Zhuang et al. noted the oxophillic promotion effect at the anode and the importance of using PtRu anodes for high performance APEFC benchmarking.23 Hence, PtRu/C anode and Pt/C cathode H2/O2 beginning-of-life APEFC tests were conducted to provide a relative comparison between the PVB-TMA, PVB-MPRD and PVB-MPY AEMs but where all other test conditions (including the ionomer used in the CCM) were as previously reported.23 We also conducted APEFC tests with and without 0.1 MPa of back-pressurisation of the gas supplies. The APEFC test data at 60 °C is presented in full in ESI,† Fig. S8 and peak power densities are summarised in Table 1. As the PVB-MPY AEM exhibited the highest performance, then the data for this AEM is compared against the PVB-TMA benchmark in Fig. 10.For the down-selected AEMs with 100 μm fully hydrated thicknesses discussed above (synthesised from 50 μm ETFE), the PVB-MPY AEM provided the highest peak power densities both with and without back-pressurisation (800 and 630 mW cm−2, respectively): this represents a relative 25% increase in power density over the PVB-TMA benchmark in both cases (640 and 500 mW cm−2, respectively). These are impressive fuel cell performances for 100 μm AEMs even considering the optimal testing conditions (Pt-containing catalysts, pure H2/O2 gases). The improvement in performance of PVB-MPYvs.PVB-TMA cannot be wholly accounted for by improvements in ionic conductivity or hydration effects. Therefore, future studies will need to probe in detail the main sources of this performance enhancement, such as the relative interference effects of the different chemistries on the catalyst activities etc.
As it is well known that thinner polymer electrolyte membranes generally perform better in fuel cells, we synthesised a small batch of thinner AEMs for APEFC evaluation (with the TMA, MPY, MPRD head groups) by the radiation grafting process using thinner 25 μm precursor ETFE (same supplier and grade as the 50 μm ETFE). Note, the IECQN of the resulting thinner AEMs (51–52 μm when fully hydrated) were 26–34% higher than the AEMs synthesised using the 50 μm ETFE (Table 1), so this multivariable change must be kept in mind. These experiments did, however, show the expected improvement in peak power performance compared to the thicker AEMs and that the PVB-MPY AEM was again the best relative performer (980 mW cm−2 with pressurisation and 800 mW cm−2 without pressurisation): these were slightly larger than the peak powers obtained with the PVB-TMA radiation-grafted AEM benchmark (970 and 700 mW cm−2, respectively), especially in the absence of back-pressurisation.
To demonstrate the competitiveness of these in situ, beginning-of-life performances with these radiation-grafted ETFE-g-poly(vinylbenzyl-N-methylpyrrolidinium) AEMs, they are compared with recent prior studies that report state-of-the-art APEFC performances. The previous, recent PtRu/C anode work by Zhuang et al. gave record breaking 1000 mW cm−2 H2/O2 fuel cell performances at 60 °C with a aQAPS QA-polysulfone AEM (50 μm fully hydrated thickness and IEC = 1.0 mmol g−1), while using the same PtRu/C anode and Pt/C cathode catalysts, aQAPS ionomer in the electrodes, CCM preparation method and fuel cell test equipment and conditions (400 ml min−1 fully hydrated gas flows and 0.1 MPa back-pressurisation).23 Scott et al. have reported exceptional fuel cell performance using low density polyethylene (LDPE) QA-type radiation-grafted AEM of 110 μm thickness (IEC = 1.77 mmol g−1), which yielded a H2/O2 fuel cell peak power density at 60 °C of 823 mW cm−2 (Pt/C catalysts) and with no gas-pressurisation.40 An impressive 471 mW cm−2 was achieved when CO2-free air was used instead of O2 and with the use of a 57 μm thickness LDPE-based radiation-grafted AEM (IEC = 1.22 mmol g−1).
Zitoun et al. have reported high Pt-free H2-air (CO2-free) APEFC performances.41 A peak power density of 400 mW cm−2 at 73 °C was obtained with a CCM containing Pd–Ni decorated anode catalyst, an Ag-based alloy as the cathode catalyst, a QA-functionalized polyhydrocarbon ionomer, and a QA-AEM: the fully humidified CO2-free air was pressurised to 0.2 MPa and the dry H2 was pressurised to 0.4 MPa. Dekel et al. have more recently published an even high power performance for a Pt-free APEFC.42 A peak power density of 500 mW cm−2 at 73 °C was obtained with a CCM containing Pd–CeO2 anode catalyst, an Ag-based alloy as the cathode catalyst and an undisclosed AEM and ionomer: the fully humidified air (<10 ppm CO2) was pressurised to 1 bargauge and the dry H2 was pressurised to 3 bargauge.
Conclusions
A series of benzyl-linked saturated-heterocyclic quaternary ammonium (QA) radiation-grafted ETFE-based anion-exchange membranes (AEM) were synthesised. Relative comparison of these AEMs showed that the benzyl-N-methylpyrrolidinium AEM exhibited the highest relative alkali stability, conductivity and in situ fuel cell performance (especially compared to the prior benzyltrimethylammonium benchmark). This benzyl-N-methyl-N-pyrrolidinium AEM exhibited an OH− conductivity of 159 mS cm−1 at 80 °C in a 95% relative humidity atmosphere. A beginning-of-life H2/O2 fuel cell performance of 980 mW cm−2 was achieved at 60 °C with PtRu/C anode and Pt/C cathode catalysts and a back-pressurisation of 0.1 MPa when using a 52 μm radiation-grafted benzyl-N-methylpyrrolidinium AEM; this reduced to a still respectable 800 mW cm−2 without back pressurisation of the gas supplies.It can be concluded that ETFE-g-poly(vinylbenzyl-N-methylpyrrolidinium) can now be considered the benchmark ETFE-based benzyl-type radiation-grafted AEM for use in alkaline polymer electrolyte fuel cells (and potentially AEM-containing alkaline water electrolysers). However, a consensus in the literature is building that a primary cause of alkali instability is the location of the positively charged N in the QA head groups at the benzyl position (poly-(C6H4)–CH2–N+RR′R′′), as in all of the AEMs reported in this paper. A future challenge, that is now being addressed, is the preparation of radiation-grafted membranes containing non-benzyl-QA groups. Regarding the development of radiation-grafted N-methylpyrrolidinium-type AEMs, another future step is to investigate the effect of changing the polymer backbone from partially fluorinated ETFE to non-fluorinated low density polyethylene (LDPE).40 Once we have a final idea of optimal materials for the ionomers on each electrode and the AEM (which may all be different), we then plan to conduct longer-term fuel cell tests including operation in H2/air mode, with and without the removal of CO2 from the air, and with non-Pt catalysts.
Acknowledgements
The UK component of the research was supported by Engineering and Physical Sciences Research Council (EPSRC) grants EP/M014371/1 and EP/M005933/1. The University of Surrey (UK) team synthesised the AEMs and conducted all characterisations apart from the fuel cell test data recorded by the team at Wuhan University (P. R. China), the solid state NMR measurements recorded at Durham University, and the conductivity (Cl− and OH− forms in controlled relative humidity atmospheres), WURH, λ, and SAXS data recorded by the team at the Colorado School of Mines (CSM, USA). The CSM team thank the US Army Research Office for support of this research under the MURI program, grant W911NF-11-1-0462. This research used resources of the Advanced Photon Source, a U.S. Department of Energy (DOE) Office of Science User Facility operated for the DOE Office of Science by Argonne National Laboratory under Contract No. DE-AC02-06CH11357. All of the raw data collected at Surrey is freely available (in compliance with EPSRC rules): the metadata and details on how to access this raw data can be found at DOI: http://10.15126/surreydata.00811096.References
- J. R. Varcoe, P. Atanassov, D. R. Dekel, A. M. Herring, M. A. Hickner, P. A. Kohl, A. R. Kucernak, W. E. Mustain, K. Nijmeijer, K. Scott, T. Xu and L. Zhuang, Energy Environ. Sci., 2014, 7, 3135–3191 CAS.
- Z. Yang, J. Ran, B. Wu, L. Wu and T. Xu, Curr. Opin. Chem. Eng., 2016, 12, 22–30 CrossRef.
- S. Lu, J. Pan, A. Huang, L. Zhuang and J. Lu, Proc. Natl. Acad. Sci. U. S. A., 2008, 105, 20611–20614 CrossRef CAS.
- Z. Zhuang, S. A. Giles, J. Zheng, G. R. Jenness, S. Caratzoulas, D. G. Vlachos and Y. Yan, Nat. Commun., 2016, 7, 10141 CrossRef CAS PubMed.
- A. Holewinski, J.-C. Idrobo and S. Linic, Nat. Chem., 2014, 6, 828–834 CrossRef CAS PubMed.
- W. Sheng, A. P. Bivens, M. Myint, Z. Zhuang, R. V. Forest, Q. Fang, J. G. Chen and Y. Yan, Energy Environ. Sci., 2014, 7, 1719–1724 CAS.
- A. G. Wright, J. Fan, B. Britton, T. Weissbach, H.-F. Lee, E. A. Kitching, T. J. Peckham and S. Holdcroft, Energy Environ. Sci., 2016, 9, 2130–2142 CAS.
- C. Chen, J. Pan, J. Han, Y. Wang, L. Zhu, M. A. Hickner and L. Zhuang, J. Mater. Chem. A, 2016, 4, 4071–4081 CAS.
- J. Pan, L. Zhu, J. Han and M. A. Hickner, Chem. Mater., 2015, 27, 6689–6698 CrossRef CAS.
- M. G. Marino and K. D. Kreuer, ChemSusChem, 2015, 8, 513–523 CrossRef CAS PubMed.
- K. M. Meek, J. R. Nykaza and Y. A. Elabd, Macromolecules, 2016, 49, 3382–3394 CrossRef CAS.
- F. Gu, H. Dong, Y. Li, Z. Sun and F. Yan, Macromolecules, 2014, 47, 6740–6747 CrossRef CAS.
- C. G. Morandi, R. Peach, M. Krieg and J. Kerres, J. Mater. Chem. A, 2014, 3, 1110–1120 Search PubMed.
- S. Gu, J. Wang, R. B. Kaspar, Q. Fang, B. Zhang, E. B. Coughlin and Y. Yan, Sci. Rep., 2015, 5, 11668 CrossRef CAS PubMed.
- M. M. Nasef, Chem. Rev., 2014, 114, 12278–12329 CrossRef CAS PubMed.
- L. Gubler, Adv. Energy Mater., 2014, 4, 1300827 CrossRef.
- O. I. Deavin, S. Murphy, A. L. Ong, S. D. Poynton, R. Zeng, H. Herman and J. R. Varcoe, Energy Environ. Sci., 2012, 5, 8584–8597 CAS.
- O. M. M. Page, S. D. Poynton, S. Murphy, A. Lien Ong, D. M. Hillman, C. A. Hancock, M. G. Hale, D. C. Apperley and J. R. Varcoe, RSC Adv., 2013, 3, 579–587 RSC.
- J. R. Varcoe, R. C. T. Slade, E. Lam How Yee, S. D. Poynton, D. J. Driscoll and D. C. Apperley, Chem. Mater., 2007, 19, 2686–2693 CrossRef CAS.
- J. Pan, C. Chen, Y. Li, L. Wang, L. Tan, G. Li, X. Tang, L. Xiao, J. Lu and L. Zhuang, Energy Environ. Sci., 2014, 7, 354–360 CAS.
- T. N. Danks, R. C. T. Slade and J. R. Varcoe, J. Mater. Chem., 2003, 13, 712–721 RSC.
- T. P. Pandey, A. M. Maes, H. N. Sarode, B. D. Peters, S. Lavina, K. Vezzù, Y. Yang, S. D. Poynton, J. R. Varcoe, S. Seifert, M. W. Liberatore, V. Di Noto and A. M. Herring, Phys. Chem. Chem. Phys., 2015, 17, 4367–4378 RSC.
- Y. Wang, G. Wang, G. Li, B. Huang, J. Pan, Q. Liu, J. Han, L. Xiao, J. Lu and L. Zhuang, Energy Environ. Sci., 2015, 8, 177–181 CAS.
- P. Larkin, Infrared and Raman Spectroscopy; Principles and Spectral Interpretation, Elsevier Science, 2011 Search PubMed.
- G. Calleja, A. Houdayer, S. Etienne-calas, D. Bourgogne, V. Flaud, G. Silly, S. Shibahara, A. Takahara, A. Jourdan, A. Hamwi and B. Ameduri, J. Polym. Sci., Part A: Polym. Chem., 2011, 49, 1517–1527 CrossRef CAS.
- E.-S. A. Hegazy, A. M. Dessouki, N. B. El-Assy, N. M. El-Sawy and M. A. A. El-Ghaffar, J. Polym. Sci., Part A: Polym. Chem., 1992, 30, 1969–1976 CrossRef CAS.
- R. Rohani, M. M. Nasef, H. Saidi and K. Z. M. Dahlan, Chem. Eng. J., 2007, 132, 27–35 CrossRef CAS.
- V. Sproll, T. J. Schmidt and L. Gubler, Polym. Int., 2016, 65, 174–180 CrossRef CAS.
- W. Pang, C. Fan and Q. Zhu, Eur. Polym. J., 2001, 37, 2425–2428 CrossRef CAS.
- H. Long and B. S. Pivovar, ECS Electrochem. Lett., 2014, 4, F13–F16 CrossRef.
- M. R. Sturgeon, C. S. Macomber, C. Engtrakul, H. Long and B. S. Pivovar, J. Electrochem. Soc., 2015, 162, F366–F372 CrossRef CAS.
- S. A. Nuñez, C. Capparelli and M. A. Hickner, Chem. Mater., 2016, 28, 2589–2598 CrossRef.
- A. D. Mohanty and C. Bae, J. Mater. Chem. A, 2014, 2, 17314–17320 CAS.
- H. K. Hall, J. Am. Chem. Soc., 1957, 79, 5441–5444 CrossRef CAS.
- T. P. Pandey, H. N. Sarode, Y. Yang, Y. Yang, K. Vezzù, V. Di Noto, S. Seifert, D. M. Knauss, M. W. Liberatore and A. M. Herring, J. Electrochem. Soc., 2016, 163, H513–H520 CrossRef CAS.
- M. E. Tuckerman, D. Marx and M. Parrinello, Nature, 2002, 417, 925–929 CrossRef CAS PubMed.
- M. E. Tuckerman, A. Chandra and D. Marx, Acc. Chem. Res., 2006, 39, 151–158 CrossRef CAS PubMed.
- C. Chen, Y.-L. S. Tse, G. E. Lindberg, C. Knight and G. A. Voth, J. Am. Chem. Soc., 2016, 138, 991–1000 CrossRef CAS PubMed.
- S. Chempath, B. R. Einsla, L. R. Pratt, C. S. Macomber, J. M. Boncella, J. A. Rau and B. S. Pivovar, J. Phys. Chem. C, 2008, 112, 3179–3182 CAS.
- M. Mamlouk, J. A. Horsfall, C. Williams and K. Scott, Int. J. Hydrogen Energy, 2012, 37, 11912–11920 CrossRef CAS.
- M. Alesker, M. Page, M. Shviro, Y. Paska, G. Gershinsky, D. R. Dekel and D. Zitoun, J. Power Sources, 2016, 304, 332–339 CrossRef CAS.
- H. A. Miller, A. Lavacchi, F. Vizza, M. Marelli, F. Di Benedetto, F. D'Acapito, Y. Paska, M. Page and D. R. Dekel, Angew. Chem., Int. Ed., 2016, 55, 6004–6007 CrossRef CAS PubMed.
Footnote |
| † Electronic supplementary information (ESI) available: Additional tables of data, spectra, and figures in support of those presented in the main article. See DOI: 10.1039/c6ee01958g |
| This journal is © The Royal Society of Chemistry 2016 |

