
 Open Access Article
 This Open Access Article is licensed under a
 Creative Commons Attribution 3.0 Unported Licence
Managing geologic CO2 storage with pre-injection brine production: a strategy evaluated with a model of CO2 injection at Snøhvit
Thomas A.
Buscheck
*a,
Joshua A.
White
a,
Susan A.
Carroll
a,
Jeffrey M.
Bielicki
 b and
Roger D.
Aines
a
b and
Roger D.
Aines
a
aAtmospheric, Earth, and Energy Division, Lawrence Livermore National Laboratory, Livermore, CA, USA. E-mail: buscheck1@llnl.gov
bDepartment of Civil, Environmental, and Geodetic Engineering and John Glenn College of Public Affairs, The Ohio State University, Columbus, OH, USA
First published on 4th March 2016
Abstract
CO2 capture and storage (CCS) in saline reservoirs can play a key role in curbing CO2 emissions. Buildup of pressure due to CO2 injection, however, can create hazards (wellbore leakage, caprock fracturing, and induced seismicity) to safe storage that must be carefully addressed. Reservoir pressure management by producing brine to minimize pressure buildup is a potential tool to manage these risks. To date, research studies on the effectiveness of brine production have largely focused on generic, hypothetical systems. In this paper, we use data from the Snøhvit CCS project to perform a data-constrained analysis of its effectiveness under realistic geologic conditions. During the first phase of the Snøhvit project, CO2 was injected into the compartmentalized Tubåen Fm. with lower-than-expected injectivity and capacity, which resulted in pressure buildup sooner than was expected. Using a reservoir model calibrated to this observed behavior, we analyze an alternative scenario in which brine is produced from the storage unit prior to injection. The results suggest that pre-injection brine production in this particular formation would be 94% efficient on a volume-per-volume basis – i.e. for each cubic meter of brine removed, an additional 0.94 cubic meters of CO2 could have been injected while maintaining the same peak reservoir pressure. Further, pressure drawdown observed during brine production is a mirror image of pressure buildup during CO2 injection, providing necessary data to estimate reservoir capacity before CO2 is injected. These observations suggest that this approach can be valuable for site selection and characterization, risk management, and increasing public acceptance.
Broader contextDeployment of CO2 capture and storage (CCS) at a sufficient scale to meaningfully reduce CO2 emissions can be accelerated with strategies that proactively manage project risks, many of which are linked to reservoir pressure. Active management of reservoir pressure by removing formation brine is one possible approach, and here we test its effectiveness under realistic geologic conditions. Using a model constrained with data from the Snøhvit project, we evaluate the efficacy of using the same well to produce brine prior to injecting CO2. The results indicate that this approach to managing geologic CO2 storage can (1) identify resources with sufficient storage capacity prior to CO2 injection; (2) increase storage capacity and efficiency on a per well basis; (3) limit pore-space competition with neighboring subsurface operations; and (4) reduce the duration of post-injection site care and monitoring. This approach may be necessary to assure investors, insurers, and, most importantly, the public that uncertainty and risk have been sufficiently reduced. |
1 Introduction
The CO2 storage aspect of CO2 capture and storage (CCS) technology requires the injection of enormous volumes of CO2 into the subsurface. From a physical standpoint, many of the biggest challenges impeding the deployment of industrial-scale CCS arise from the overpressure that results when CO2 is injected into a porous and permeable sedimentary reservoir – that is, introducing fluids into the rock increases the pore fluid pressure above the original reservoir pressure. This overpressure is a key driver for geomechanical and hydrologic hazards: induced seismicity, fault reactivation, caprock fracture, and leakage through wells, faults, or fractures.1–3A few project-specific variables dominate the degree to which overpressure occurs in a storage reservoir: (1) the volume and the net rate of fluid injection (injection minus production) in the reservoir; (2) the accessible pore volume within the storage reservoir “compartment,” determined by the geology and hydrogeologic properties (e.g., residual liquid saturation); and (3) the permeability of the storage reservoir and adjacent seals that define the compartment. Geologic surveys, geologic logs, and core data from exploration wells provide information that can be used to estimate the pore volume and permeability of a prospective reservoir. But estimates of storage capacity will have large uncertainties until operators have experience moving large quantities of fluid into and/or out of the storage reservoir.
A number of storage projects have encountered difficulties due to limitations on total storage capacity or injection rate imposed by insufficient reservoir pore volume or permeability. For example, the Snøhvit CO2 storage project – the focus of this work – could not sustain the desired injection rate into the initial target formation, the Tubåen.4 Subsequent modification of the injection strategy, to exploit a better permeability unit, has allowed continued and stable injection at this site.5 Injection at the in Salah CO2 storage project led to reservoir pressures that stimulated fracture flow and may have caused fracturing in the reservoir and lowermost caprock.6,7 The ZeroGen project in Australia only advanced to the point of learning that the intended storage reservoir had too little storage capacity. Interestingly, a key suggestion from that project was that storage capacity estimates should be based on long-term, dynamic well testing.8 While most storage demonstrations to date have been largely successful, notably the Sleipner project9 which has now injected over 15 million tonnes of CO2, the total stored volume is small compared to the volume necessary to meaningfully impact global CO2 emissions. Uncertainty about storage capacity and allowable injection rate remains a major technical hurdle for commercialization of CCS.10
Many pressure-management studies have considered removing brine from saline reservoirs to moderate the degree to which pressure builds up due to CO2 injection.11–16 Most of these studies consider large multi-well fields in laterally homogeneous reservoirs with large storage capacity, where the wells used to produce brine are different from those used to inject CO2. But, many reservoirs, like the Tubåen Fm. at Snøhvit, are compartmentalized and laterally heterogeneous4,17 and the limited hydraulic communication between injection and production wells can reduce how effective brine removal is in relieving pressure at injection wells.18 In addition, early CO2 breakthrough at the brine production well can limit how long it can be used for pressure relief.18 Finally, well costs can drive project design, particularly in an offshore storage environment where wells are particularly expensive. To address these issues, recent studies consider using the same well to produce brine before injecting CO2.18,19 Here, we also demonstrate that pre-injection brine production can be used to augment site characterization, essentially providing a long-term pressure falloff test. This data can reduce uncertainty about storage capacity, and be used to plan future operations, prior to injecting CO2.
The Snøhvit CO2 storage project is the second-largest offshore CCS project to date.2,4,5,17 In this paper, we use down-hole pressure gauge data and geophysical monitoring data to constrain a reservoir model of the Tubåen Fm., accurately reproducing the observed pressure buildup due to injection. With confidence that the reservoir model provides a good representation of the geologic system, we performed a retrospective modeling study to test the efficacy of different pressure management strategies. Because of the small size of the reservoir compartment (determined to be 220 × 2300 m in this study), pre-injection brine production can be highly efficient, with rapid pressure drawdown over a limited time frame. Several production options are considered, including removing brine volumes equal to the injected CO2 volume and twice that volume prior to CO2 injection. We also consider cases that add a second hypothetical well, to produce brine during CO2 injection in a standard active management scheme. This work shows that removing brine can efficiently limit the magnitude and duration of overpressure, and provide data with which to estimate the storage capacity prior to CO2 injection. CO2 injection at the Snøhvit site continues as part of this industrial-scale CCS project,4,5 and brine production solutions in the offshore setting are unlikely to be a realistic option at this site. However, our analysis, based on this quantitative case study, illustrates the efficacy of pre-injection brine production for future CCS projects.
2 Pre-injection brine production
Producing brine from a storage reservoir can provide multiple benefits for industrial-scale CCS. First, brine removal opens more pore space in the reservoir for CO2 storage, resulting in less overpressure, a smaller area of review (AoR), and less post-injection monitoring for a given quantity of stored CO2.13 In addition, more CO2 can be injected without displacing brine to nearby subsurface operations (e.g., other CCS sites and water-supply aquifers).Second, when brine is produced before CO2 is injected, the resulting pressure drawdown provides direct information about overpressure that will result from CO2 injection.18 Hence, operational experience with producing brine reduces uncertainty about storage capacity and permanence, compared to when the first major well operation is CO2 injection itself. This benefit is valuable for both site selection and characterization. Reducing storage uncertainty could be necessary prior to final financing of CCS infrastructure.10
Third, brine removal maximizes resource utilization. Because brine removal increases storage capacity, it can allow an individual sink to store CO2 from multiple sources; thus, fixed development costs for that site (e.g., permitting, characterization, monitoring) are leveraged for multiple sources, reducing storage cost.20
Fourth, produced brine can be partially treated for industrial and saline cooling-water applications or desalinated to produce freshwater.21 However, brine that is produced from the deep aquifers suitable for CO2 storage contains more dissolved solids and impurities than groundwater in shallow aquifers. Brine from saline aquifers is not usable without treatment. The cost of treating formation brine primarily depends on total dissolved solids (TDS) and intended beneficial use (freshwater or cooling water), and there are deep saline aquifers where TDS may be too high for beneficial consumptive use to be a practical option. At the storage site, re-injection of produced brine, or residual brine from a treatment process, into an overlying formation might also be used to reduce or even reverse the overpressure gradient in the caprock above the storage formation, reducing the drive for CO2 leakage.14 Even if the produced brine cannot be used and therefore must be re-injected elsewhere for disposal purposes, this process has fewer constraints and is typically cheaper than CO2 disposal.
While the cost of handling large quantities of brine can be substantial, they may be offset by other savings (fewer wells, less monitoring, lower insurance costs), as well as by the permitting advantages that arise from reducing uncertainty before CO2 is injected. All of these factors should be included in a cost-benefit analysis of pre-injection brine production for a prospective CO2 storage site.
For storage operations, pre-injection brine production (Fig. 1) has three objectives: (1) minimize the number of wells required for storage, (2) maximize overpressure reduction per unit of removed brine, and (3) acquire pre-injection information on the reservoir from measuring pressure drawdown. When the same well is used first to produce brine and then to inject CO2, pressure drawdown and the information gathered are greatest where needed most – the center of CO2 storage.18 Measuring pressure drawdown in an adjoining deep monitoring well (Fig. 1a) provides additional information about the degree of reservoir compartmentalization and storage capacity. Measuring drawdown in a shallow monitoring well (Fig. 1a) provides important information about the potential for CO2 leakage through the caprock and, hence, storage permanence.
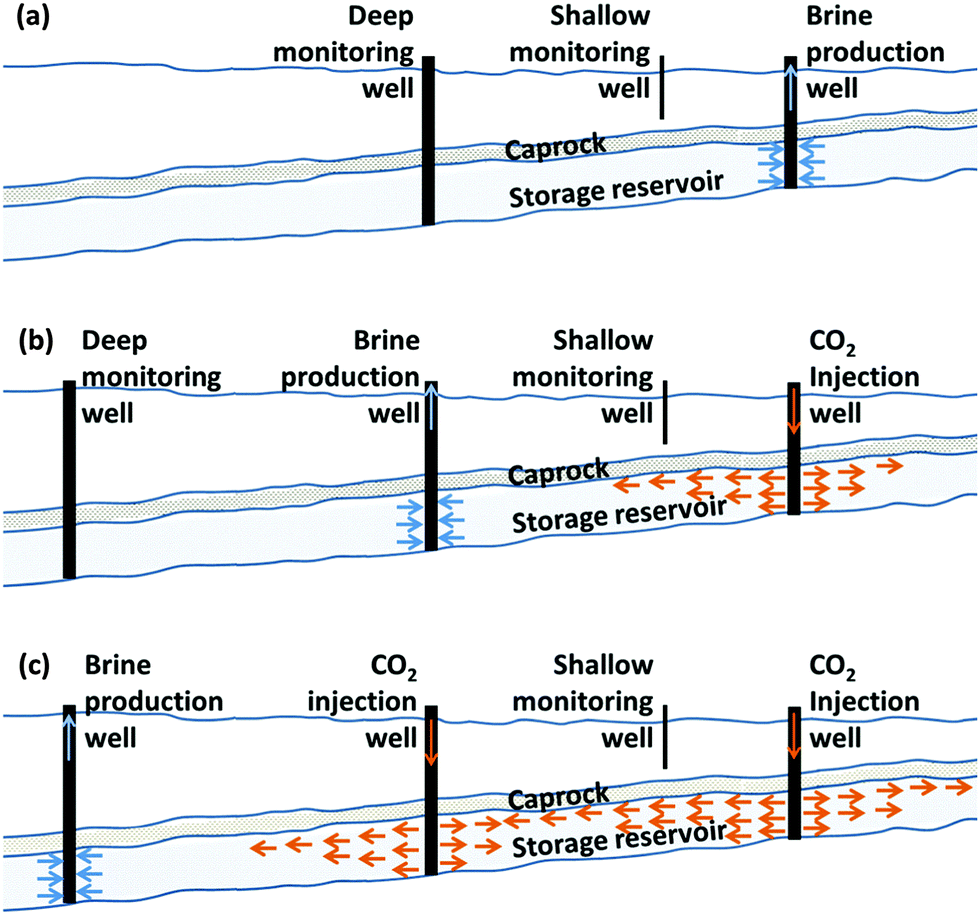 | ||
| Fig. 1 Staged pre-injection brine production is shown for multiple wells. (a) Pre-injection brine production results in pressure drawdown, making room for CO2 storage. (b) The brine-production well in (a) is repurposed for CO2 injection and the deep monitoring well is repurposed for brine production. (c) The brine-production well in (b) is repurposed for CO2 injection and brine production is moved to a third deep well, which could continue after CO2 injection has ceased.18 | ||
CO2 injection begins where pressure drawdown is greatest, which is where the brine was initially produced (Fig. 1b). In a multi-well operation, a second brine-production well can operate until CO2 from the first well reaches the second well, at which time the second may be repurposed for CO2 injection (Fig. 1c). Brine production may continue at a third deep well (Fig. 1c), depending on the CO2 storage goals. Brine production could continue long after CO2 injection has ceased to nullify post-injection overpressure, limit pore-space competition with neighbors, and reduce the time required for post-injection monitoring to assure storage integrity.
3 Method for evaluation
3.1 Snøhvit CO2 storage project
The Snøhvit field, operated by Statoil, is located in an E–W trending fault-block system in the Hammerfest basin in the Barents Sea (Fig. 2), 150 km north of the coast of Norway.4 CO2 is separated from the production gas at an onshore processing plant (Melkøya) and transported back to the offshore gas fields via a 150 km pipeline and injected into saline formations adjacent to the gas fields. From April 2008 until April 2011, 1.09 million tonnes of CO2 was injected into the Tubåen Fm. (Fig. 2), a saline aquifer 2600–2700 m below sea level.17 The Tubåen Fm. is a deltaic to fluvial sandstone sequence, deposited in the Early Jurassic. This depositional environment leads to high-permeability fluvial channels and bars interbedded with siltstones and mudstones.4 Overlying this sequence is a caprock (Fig. 2a) of mud-rich deposits of the Nordmela Fm. The caprock, in turn, is overlain by the Stø Fm. sandstones (Early to Middle Jurassic), deposited in a shallow marine environment. The Stø Fm. is also the main Snøhvit gas reservoir and where the source of CO2 resides. Maintaining the seal integrity of the Nordmela Fm. caprock requires reservoir pressure staying below the hydraulic fracturing threshold. A related concern is overpressure developing along one of the major faults, which could reactivate and create a leakage pathway.2,4,22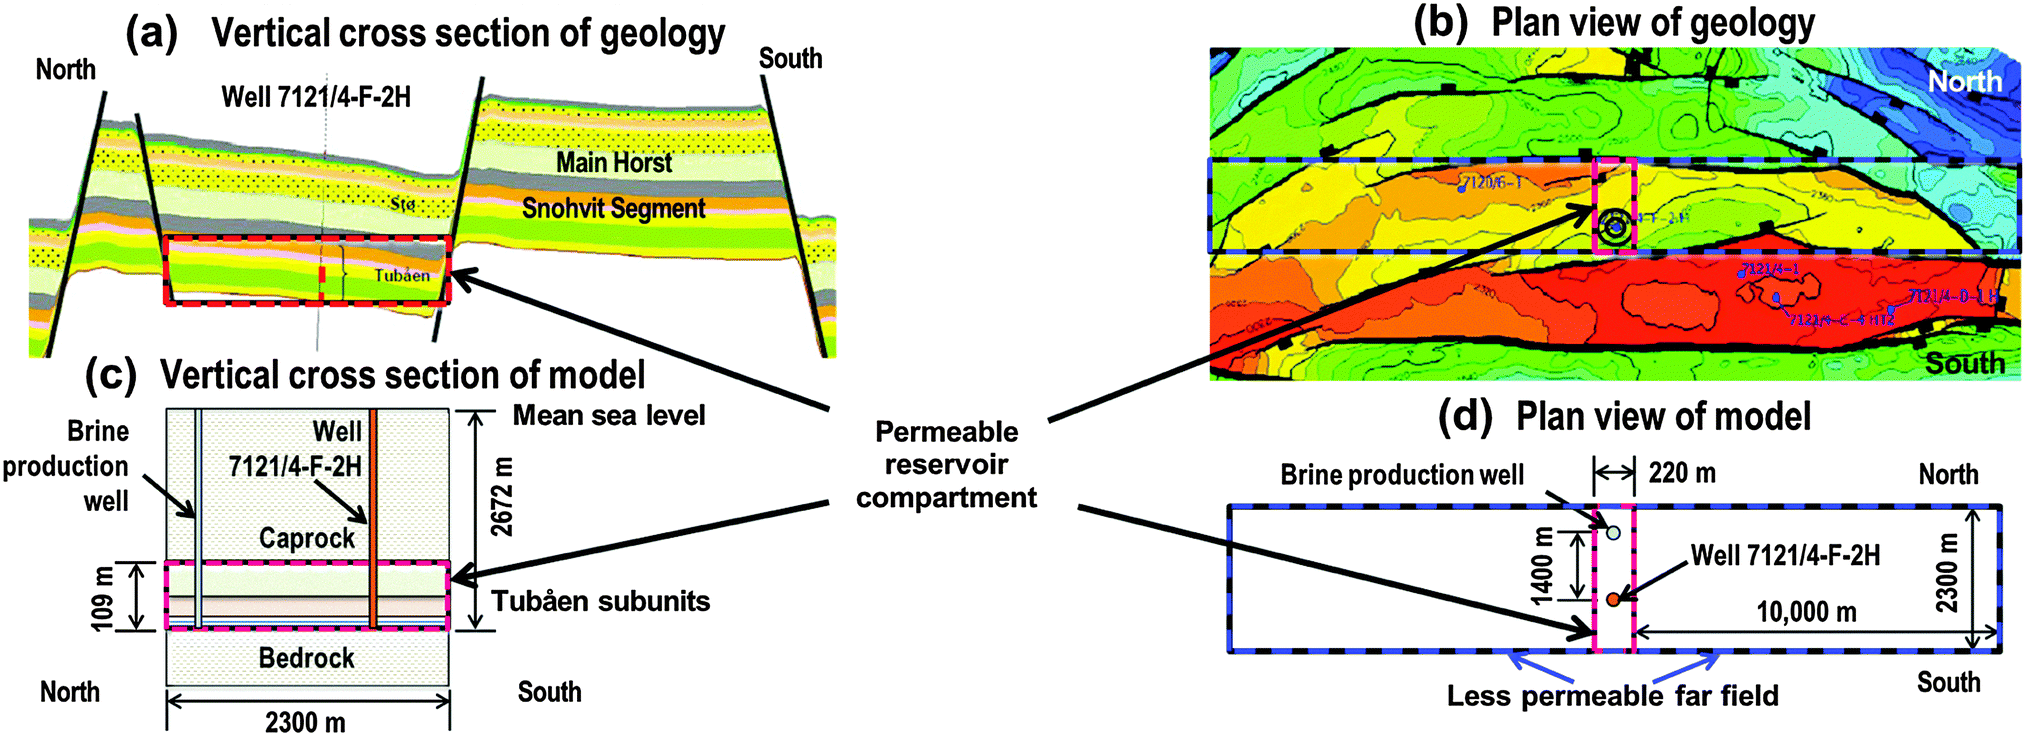 | ||
| Fig. 2 Geology map of Snøhvit site (a & b) and corresponding reservoir model (c & d). | ||
The highly faulted structure and dominance of distributary channel facies in the Tubåen Fm. causes the reservoir to be very compartmentalized, with a high prevalence of lateral and vertical permeability barriers. The injection-well pressure history at Snøhvit4,17 indicated that the expected storage capacity of the Tubåen Fm. was not realized because lateral permeability barriers restricted hydraulic communication. Over the three years of injection, reservoir pressure built up, eventually approaching the proscribed hydraulic fracturing threshold. Operations were temporarily suspended while the injection well was recompleted in the shallower Stø Fm. This unit has more favorable injection conditions, and the CO2 storage operation has continued successfully to the present date.
3.2 Model calibration
A reservoir analyses of the Snøhvit CCS project was conducted with the nonisothermal unsaturated flow and transport (NUFT) code, which simulates multi-phase heat and mass flow and reactive transport in porous media.23 NUFT has been used extensively in studies of CCS.1,13,14,18,27,28 The two-phase flow of CO2 and water was simulated with the density and compressibility of supercritical CO2 determined by the correlation of Span and Wagner24 and viscosity determined by the correlation of Fenghour et al.25 The values of pore and water compressibility are 3.72 × 10⁻¹⁰ and 3.5 × 10⁻¹⁰ Pa−1, respectively. Water density is determined by the ASME steam tables.26 A geothermal gradient of 37.5 °C km−1 results in an initial temperature of 101.3 °C at the bottom of the reservoir, assuming an average surface temperature of 14.5 °C. The temperature of the injected CO2 is 25 °C at reservoir conditions.The reservoir model was developed using characterization data collected by Statoil, which included the thickness, porosity, and permeability determined from the well 7121/4-F-2H perforation intervals (Fig. 2). We chose mid-range values of permeability for the three permeable subunits in the Tubåen Fm. (Table 1) that result in 80% of the transmissivity residing in the lowermost (Tubåen-3) subunit, consistent with pressure logging tool (PLT) data that showed 80% of the injection going into the lower perforated zone.4 The conceptual geometry was developed based on the known structural geology and a 4-D seismic difference amplitude map, which show overpressure and CO2 migration being controlled by long fluvial channels in the Tubåen (Fig. 2). The injection well (7121/4-F-2H) is located about one-third of the way from the southern boundary of a narrow permeable compartment, which became evident via time-lapse seismic imaging and which was initially estimated to be 220 m wide by 2000 m long (Fig. 2) using well-test data. During the model-calibration process (see Appendix), the length of the compartment was increased to 2300 m, which improved the agreement between modeled and measured bottom-hole pressure. The boundaries on the northern and southern sides of the model domain are formed by vertically offset sealing (i.e., impermeable) faults (Fig. 2). The lateral boundaries correspond to where the permeable facies are bounded by less permeable “far field” siltstone and mudstone facies (Fig. 2). During model calibration, the lateral extent of the far field was varied from 10![[thin space (1/6-em)]](https://www.rsc.org/images/entities/char_2009.gif) 000 to 40000 m. Because modeled overpressure at the injection well was found to be insensitive to this parameter over this range, we assume the far-field extends 10000 m to the east and west of the permeable compartment.
000 to 40000 m. Because modeled overpressure at the injection well was found to be insensitive to this parameter over this range, we assume the far-field extends 10000 m to the east and west of the permeable compartment.
| Unit | Thickness (m) | Porosity (%) | Permeability (mD) |
|---|---|---|---|
| Overburden | >2000 | 12 | 0.001 |
| Tubåen-3 | 59.3 | 14 | 200 |
| Tubåen-2 | 37.1 | 10 | 30 |
| Tubåen-1 | 12.6 | 20 | 4000 |
| Underburden | >800 | 12 | 0.001 |
In the far field outside of the permeable compartment, permeability values in the respective Tubåen Fm. subunits are multiplied by a reduction factor determined during model calibration. We applied the same factor to each of the three subunits, which quantifies the leakiness of the lateral boundaries of the permeable compartment. A factor of 0.01 was found to provide the best fit during model calibration. The permeability of the caprock and bedrock seal units is assumed to be 0.001 mD, a typical value used in CCS studies.12–14,18
The calibrated model agrees closely with the entire overpressure trend (Fig. 3a), with the exception of spikes caused by near wellbore salt precipitation that reduced well injectivity primarily during the first year of injection.4 These early spikes reflect a near-well clogging effect and are ignored in the reservoir-scale analysis. This study considers 3-, 6-, 12- and 30-year injection periods. For injection periods greater than three years, the actual 3-year injection-rate schedule was repeated during the simulated years following the end of the real injection phase. For cases with 3- and 6-year injection periods, the simulation was continued to 100 years to track post-injection pressure decline. For cases with a 12- and 30-year injection period, the post-injection period was not simulated; the purpose of those cases was to investigate how persistent the influence of pre-injection brine production is on long-term overpressure.
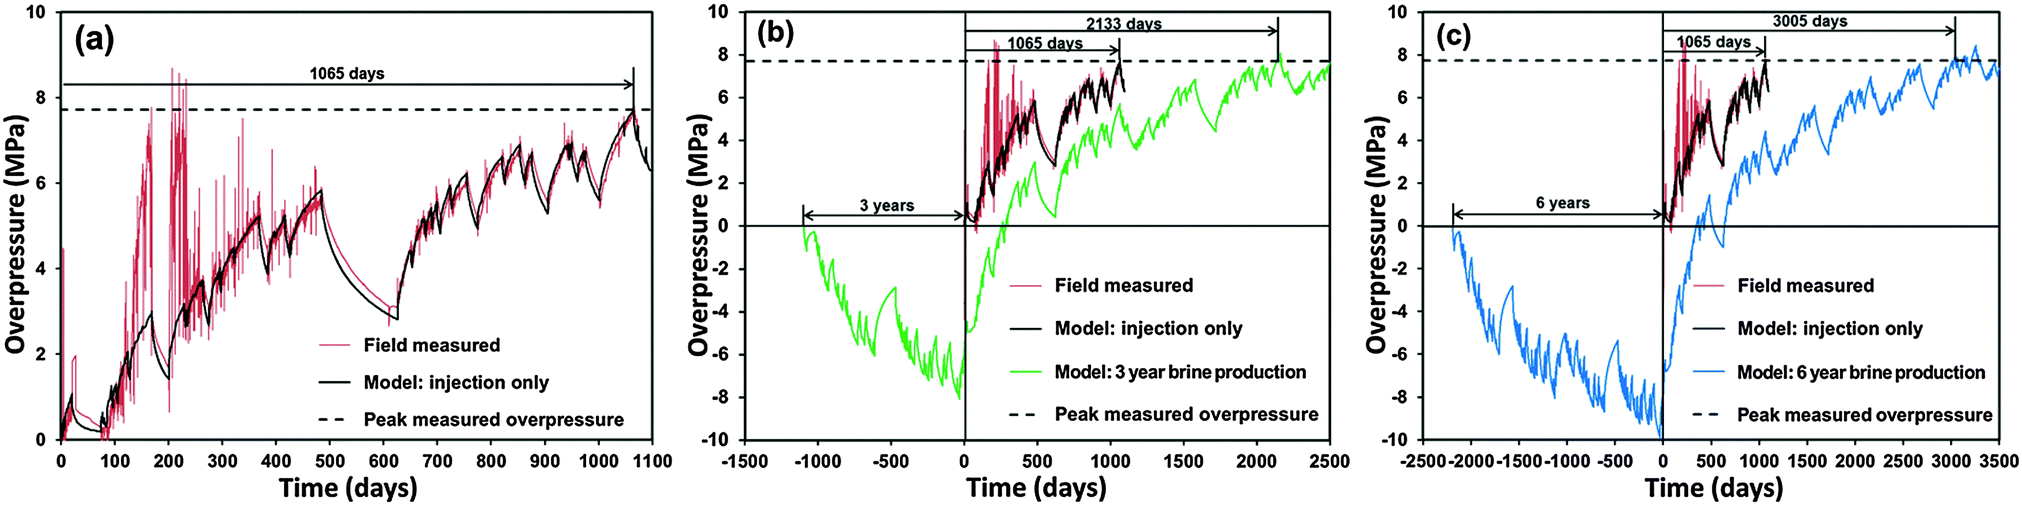 | ||
| Fig. 3 Injection-well bottom-hole overpressure in the Tubåen Fm. at Snøhvit. (a) Comparison of measured and modeled values during the 3-year injection phase. Comparison of injection-only case with (b) 3-year pre-injection brine-production case and (c) 6-year pre-injection brine-production case. | ||
4 Results and discussion
4.1 Increasing CO2 storage capacity
Pressure-management cases were considered for three years of pre-injection brine production, which removed a volume of brine equal to the volume of CO2 (1.56 million m3) injected during the 3-year injection phase, as well as six years of pre-injection brine production that removed twice that volume. For pre-injection brine production, brine is removed at the same volumetric rate as CO2 injection, using the same time-varying schedule; for six years of brine production, the 3-year schedule is repeated. Co-injection brine production was also considered, using a hypothetical second well, 1400 m to the north of the CO2 injection well (Fig. 2c and d) to remove brine during CO2 injection. For co-injection brine production, a constant rate was used, based on the 3-year average volumetric rate for CO2 injection. Because of the small size of the reservoir compartment, co-injection brine production was ceased at 1.1 years, after producing 0.57 million m3 of brine, to prevent producing CO2 that had reached the second well. Note that there is no second well at the actual site.Actual injection into the Tubåen Fm. was ceased after 3 years, when the overpressure reached 7.63 MPa (Fig. 3a), due to concerns that the injection-well pressure was approaching the fracture pressure of the storage formation.4 Since that time, injection has been diverted into the overlying Stø Fm. For this study, the storage capacity of the Tubåen Fm. is taken to be the quantity of CO2 injected until this value of overpressure is attained. Four pressure-management cases were considered in the study of storage capacity (Table 2).
| CO2 injection duration | Brine production duration | Total extracted brine | When ΔP = 7.63 MPa threshold is reacheda | Volume-per-volume production effectiveness | |||
|---|---|---|---|---|---|---|---|
| Pre-injection | Co-injection | Time | Total stored CO2 | Storage benefit | |||
| (Years) | (Years) | (Years) | (Million m3) | (Days) | (Million tonnes) | (Million tonnes) | (%) |
| a Peak overpressure ΔP measured during the actual injection at Snøhvit. | |||||||
| 30 | 0 | 0 | 0 | 1065 | 1.09 | — | — |
| 30 | 3 | 0 | 1.56 | 2133 | 2.12 | 1.03 | 94.4 |
| 12 | 3 | 1.1 | 2.13 | 2554 | 2.53 | 1.44 | 96.5 |
| 30 | 6 | 0 | 3.12 | 3005 | 3.02 | 1.93 | 88.9 |
| 12 | 6 | 1.1 | 3.69 | 3614 | 3.55 | 2.46 | 95.5 |
After three years of pre-injection brine production, the time to reach an overpressure of 7.63 MPa is predicted to increase from 1065 to 2133 days (Fig. 3b) when the cumulative injected CO2 mass is 2.12 tonnes, an increase of 1.03 million tonnes compared to injection-only (Table 2). On a volume-per-volume basis, the effectiveness of brine removal is 94.4%. After six years of pre-injection brine production, the time to reach an overpressure of 7.63 MPa is increased from 1065 to 3005 days (Fig. 3c) when the cumulative injected CO2 mass is 3.02 million tonnes, an increase of 1.93 million tonnes, corresponding to a brine-removal effectiveness of 88.9% (Table 2). Thus we predict that pre-injection brine production in the compartmentalized system produces almost a one-for-one benefit in storage capacity and pressure. Pre-injection brine removal effectiveness is slightly less than 100% due to the pressure-reduction benefit being slightly diminished as a result of brine being drawn into the reservoir from the caprock prior to CO2 injection. For six years of pre-injection brine production, more brine is drawn in, reducing the benefit somewhat more than it is for three years of pre-injection brine production.
We then considered the impact of adding co-injection brine production on brine-removal effectiveness and storage capacity. When brine is produced for an additional 1.1 years, for a total of 4.1 years (Fig. 4a), the time to reach an overpressure of 7.63 MPa is predicted to increase from 1065 to 2554 days, and storage capacity is increased by 1.44 million tonnes, compared to injection-only (Table 2). The additional 1.1 years of brine production improved brine-removal effectiveness from 94.4 to 96.5% and increased storage capacity by 0.41 million tonnes. When brine is produced for an additional 1.1 years, for a total of 7.1 years (Fig. 4b), the time to reach an overpressure of 7.63 MPa is increased from 1065 to 3614 days, and CO2 storage capacity is increased by 2.46 million tonnes, compared to injection only (Table 2). The additional 1.1 years of brine production improved brine-removal effectiveness from 88.9 to 95.5% and increased storage capacity by 0.53 million tonnes.
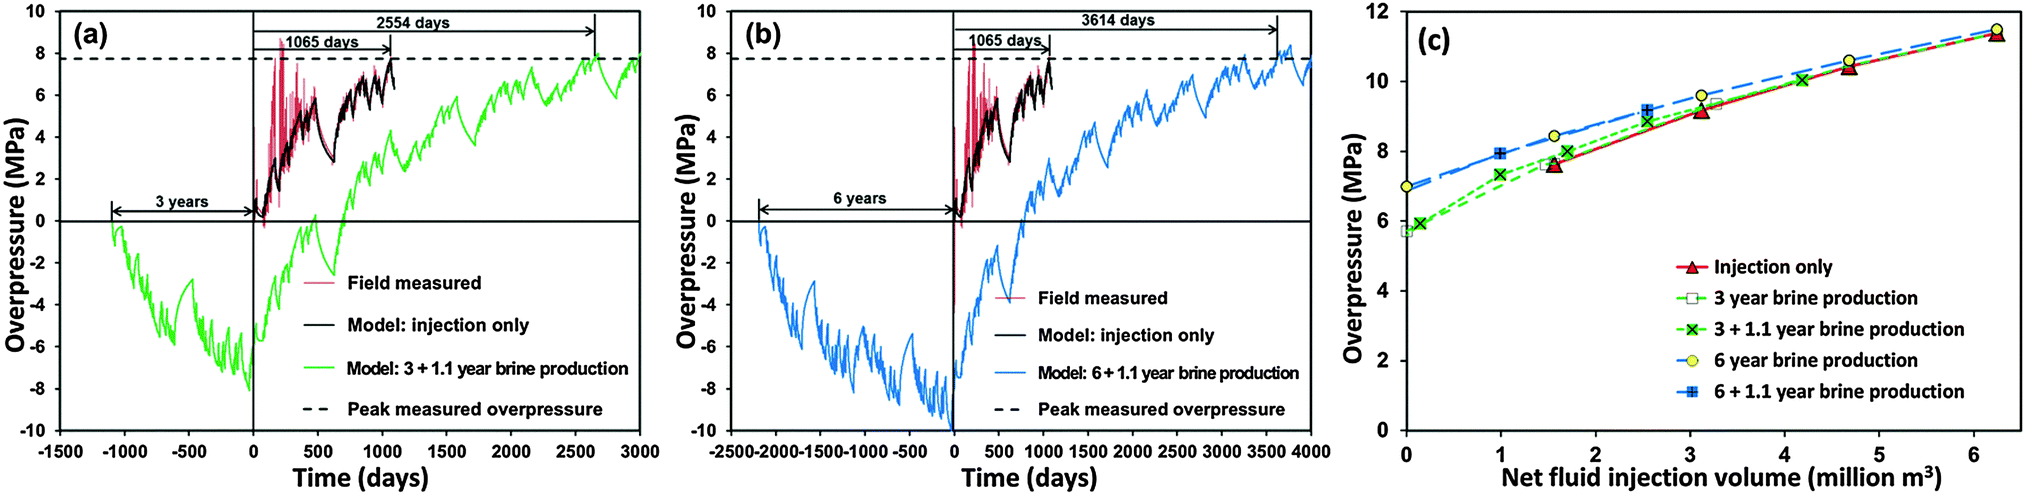 | ||
| Fig. 4 Injection-well bottom-hole overpressure in the Tubåen Fm. at Snøhvit. (a) Same as Fig. 3b, except that in addition to 3 years of pre-injection brine production, brine is produced from a second well for the first 1.1 years of CO2 injection. (b) Same as Fig. 3c, except that in addition to six years of pre-injection brine production, brine is produced from a second well for the first 1.1 years of CO2 injection. (c) The relationship between overpressure and net fluid injection volume is plotted for injection only and the pressure management cases in Fig. 3b, c, 4a and b. | ||
For the relationship between overpressure and net fluid injection volume (Fig. 4c), the trend gradually changes with increasing net fluid injection (Fig. 4c). Storage capacity depends on the accessible pore volume in the reservoir and fluid compressibility, with CO2 being a much more compressible fluid than formation brine. Because the influence of compressibility increases with CO2 volume, overpressure increases less steeply with net fluid injection as net fluid injection increases. Pre-injection brine production is beneficial because it allows more CO2 to be stored prior to reaching a threshold overpressure, which takes greater advantage of CO2 compressibility on storage capacity. A key finding is that the dependence of overpressure on net fluid injection is nearly the same for the brine-production cases as it is for injection-only (Fig. 4c); thus, the benefit of pre-injection brine production is permanent, indicating this strategy is an effective means of limiting the magnitude of overpressure.
We find that a combination of pre- and co-injection brine production is effective at increasing storage capacity. The benefit of pre-injection brine production is to delay overpressure, so pressure relief from a second brine production well has time to affect pressure at the CO2 injection well. If an overpressure of 7.63 MPa were the metric determining the storage capacity of this reservoir, then storage capacity is increased anywhere from a factor of 1.94 to 3.26 for these four pressure-management cases (Table 2).
4.2 Limiting overpressure duration
The potential for CO2 leakage and other pressure-driven risks will not only depend on the magnitude of overpressure, it will also depend on how long overpressure lasts. Hence, the duration of post-injection monitoring may depend on the duration of significant overpressure. To address this issue, we examined the influence of brine production on post-injection overpressure decline (Fig. 5). Because our model predicts three years of CO2 injection at Snøhvit resulting in an overpressure of 0.4 MPa at 100 years, we use this value as a metric for comparison (Table 3). For three years of pre-injection brine production, overpressure is predicted to decline to 0.4 MPa in just 8.14 years (Fig. 5a). When 1.1 years of co-injection brine production is added, it takes only 4.7 years to reach this threshold. Because net fluid injection is negative (−0.57 million m3), it takes only 6.4 years for overpressure to be reduced to zero; thereafter, it is negative, with a value of −0.23 MPa at 30 years (Fig. 5a). For six years of pre-injection brine production plus 1.1 years of co-injection brine production (Fig. 5b), it is possible to double CO2 injection, while reducing peak overpressure from 7.63 to 6.02 MPa, and crossing below the overpressure trend for the 3-year injection-only case at 8.5 years. This case has a slight negative overpressure (−0.06 MPa) at 30 years. Leaving a CO2 storage reservoir in a state of underpressure should provide additional assurance of storage permanence, and possibly reduce the required duration of post-injection monitoring.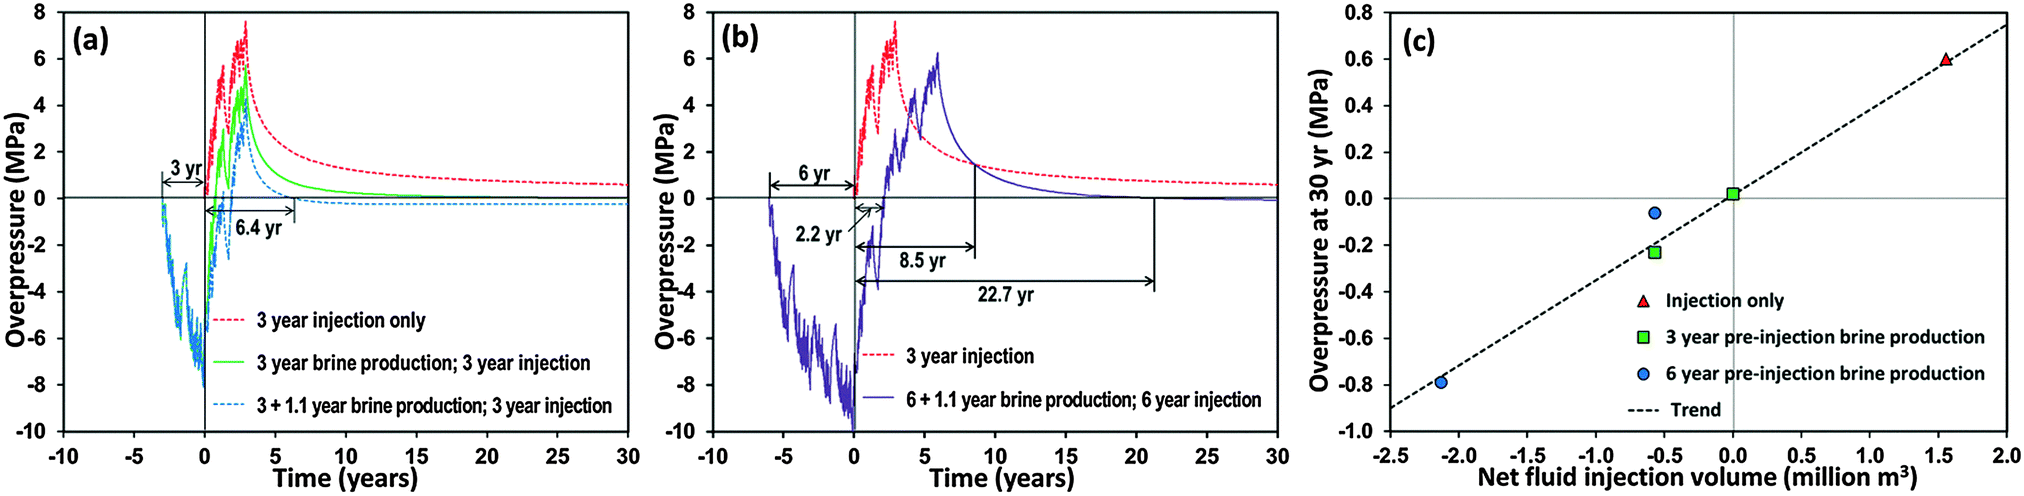 | ||
| Fig. 5 Injection-well bottom-hole overpressure in the Tubåen Fm. at Snøhvit. (a) For three years of CO2 injection, the injection-only case is compared with cases with three years of pre-injection brine production, including 1.1 years of co-injection brine production from a second well. (b) The injection-only case for three years of CO2 injection is compared with a case with six years of CO2 injection, six years of pre-injection brine production plus 1.1-year of co-injection brine production. (c) The relationship between post-injection overpressure at 30 years and net fluid injection volume. | ||
| CO2 injection duration | Brine production duration | Total injected CO2 | Total extracted brine | Net fluid injection | Peak ΔP | ΔP at 30 years | Time for ΔP to decline to 0.4 MPa | |
|---|---|---|---|---|---|---|---|---|
| Pre-injection | Co-injection | |||||||
| (Years) | (Years) | (Years) | (Million m3) | (Million m3) | (Million m3) | (MPa) | (MPa) | (Years) |
| 3 | 0 | 0 | 1.56 | 0 | 1.56 | 7.63 | 0.6 | 100 |
| 3 | 3 | 0 | 1.56 | 1.56 | 0.00 | 5.73 | 0.02 | 8.14 |
| 3 | 3 | 1.1 | 1.56 | 2.13 | −0.57 | 4.31 | −0.23 | 4.70 |
| 3 | 6 | 1.1 | 1.56 | 3.69 | −2.13 | 2.40 | −0.78 | 3.43 |
| 6 | 6 | 1.1 | 3.12 | 3.69 | −0.57 | 6.02 | −0.06 | 12.91 |
The relationship between overpressure and net fluid injection volume was determined for post-injection overpressure (Fig. 5c). The most important finding is that net fluid injection of zero or less nullifies long-term overpressure, indicating that producing brine is an effective means of limiting the duration of significant overpressure.
4.3 Estimating CO2 storage capacity
Our study using a calibrated model of CO2 injection at the Snøhvit site also illustrates the value of pre-injection brine production for site characterization. Pressure drawdown history due to brine production is the mirror image of the overpressure history due to CO2 injection (Fig. 3b). The magnitude of pressure drawdown after 3 years of brine production (8.10 MPa) is nearly the same as that of overpressure after three years of CO2 injection (7.63 MPa) (Fig. 3b). Had we accounted for pressure-sensitive permeability in our model, the resulting reduction in permeability could have increased the predicted magnitude of pressure drawdown by up to 10%, according to studies for sandstone reservoirs.29 Nonetheless, our results indicate that pre-injection brine production is a good diagnostic of overpressure that will result from CO2 injection, which is essential for estimating CO2 storage capacity. When pre-injection brine production is interrupted, pressure rapidly builds up in a manner that mirrors the pressure falloff that occurs when CO2 injection is interrupted (Fig. 3b). In much the same manner that the CO2-injection driven pressure history at Snøhvit allowed us to calibrate our reservoir model, had we obtained pressure drawdown data for three years of brine production, we would have been equally successful at calibrating a reservoir model of the Snøhvit reservoir. Falloff testing is commonly used for reservoir characterization, but such tests typically have durations of a few hours to days. They therefore only provide information about the near wellbore environment. Long-term brine production can be thought of as a highly-extended falloff test, allowing the pressure perturbation to propagate kilometers from the well and provide information about large-scale reservoir effects. Note that three years of pre-injection brine production falls within the typical 5- to 10-year timeframe attributed to site characterization.105 Conclusions
Because overpressure is the primary metric influencing the risks of induced seismicity, caprock fracture, and CO2 leakage, managing pressure is central to safe and secure CO2 storage. Besides compartment size and permeability, net fluid injection volume is the key variable affecting overpressure. Our study using a calibrated model of CO2 injection at the Snøhvit CO2 storage project shows that removing brine from a CCS reservoir allows nearly an equivalent volume of additional CO2 to be injected with the same overpressure outcome, which increases storage capacity. If net fluid injection is zero or less, the magnitude and duration of overpressure is minimized, and it will eliminate potential interference with neighboring users of subsurface pore space. By producing brine from the same well used to inject CO2, the pressure reduction benefit is maximized per unit of removed brine, and per total number of wells.For any pressure management strategy it may be necessary to find consumptive uses for produced brine (e.g., saline cooling water), which will reduce the quantity of residual brine that will need to reinjected in either the same or nearby formation. The cost of treating formation brine primarily depends on total dissolved solids and intended use, and thus may become a key factor in determining the techno-economic feasibility of a prospective CCS site.13,21 A related factor is whether a prospective CCS site is in a region of water scarcity, where water resources have greater value. Re-injecting residual brine in an overlying formation can also help by reducing or reversing the overpressure gradient in the caprock overlying the storage formation, reducing the driving force for CO2 leakage.14
Pre-injection brine production can also play a key role for site selection and characterization. It could be applied to several potential CCS sites to help identify the one with the best combination of storage capacity, permanence, and efficiency. Brine production could then continue at the selected site until enough pressure data is collected and analyzed to assure investors, insurers, and, most importantly, the public that uncertainty and risk have been sufficiently reduced. Even a relatively short brine-production period, of a few weeks to months, could provide significant characterization data.
Appendix
Parameter sensitivity
The model calibration process considered five parameters: (1) reservoir compartment length, (2) reservoir compartment width, (3) reservoir compartment (near-field) permeability, (4) far-field permeability, and (5) caprock and bedrock permeability. Because the thicknesses of the reservoir compartment and respective Tubåen Fm. subunits are constrained by well logs, they were not varied during model calibration. Tables 4–6 show the sensitivity of peak overpressure at the injection well to combinations of the five parameters.| Width, m | Length, m | ||
|---|---|---|---|
| 2000 | 2300 | 2500 | |
| 200 | 7.72 | ||
| 220 | 8.64 | 7.63 | 7.09 |
| 240 | 7.57 | ||
| Near-field factor | Far-field factor | ||||
|---|---|---|---|---|---|
| 0.0005 | 0.0009 | 0.0010 | 0.0011 | 0.0020 | |
| 0.5 | 7.82 | ||||
| 0.9 | 7.67 | ||||
| 1.0 | 10.19 | 7.98 | 7.63 | 7.31 | 5.67 |
| 1.1 | 7.60 | ||||
| 2.0 | 7.52 | ||||
| Permeability, mD | 0.0005 | 0.0009 | 0.0010 | 0.0011 | 0.0020 |
| Overpressure, MPa | 8.08 | 7.71 | 7.63 | 7.56 | 7.10 |
Overpressure at the injection well is strongly influenced by how quickly fluid (brine and CO2) can leak out of the six sides of the reservoir compartment. Because the north and south sides of the compartment correspond to vertically offset sealing faults (i.e., assumed impermeable), they do not contribute to leakage. Vertical leakage into the caprock and bedrock is primarily influenced by the compartment length and width and by the caprock and bedrock permeability, whereas lateral leakage is influenced primarily by the compartment length and far-field permeability. Because far-field permeability is several orders of magnitude greater than caprock and bedrock permeability, lateral leakage is much greater than vertical leakage. Consequently, the two most influential parameters controlling the rate of leakage out of the reservoir compartment are the reservoir compartment length, followed closely by the far-field permeability. Accordingly, these two parameters exert the greatest influence on overpressure at the injection well. Reservoir compartment width and caprock and bedrock permeability exert the same influence on compartment leakage and overpressure, but they are much less important than the first two parameters. Finally, because the reservoir compartment (near-field) permeability is found to be two orders of magnitude greater than the far-field permeability, the pressure gradient within the narrow reservoir compartment is much less than it is in the far field. Accordingly, peak overpressure at the injection well is relatively insensitive to reservoir compartment (near-field) permeability, which is the least important of the five parameters.
Having ranked the order of influence of the five key parameters, the calibration process focused on adjusting the two most influential parameters: reservoir compartment length and far-field permeability reduction factor. The reservoir compartment length was constrained by the known structural geology and 4-D seismic, providing an initial estimate of 2000 m. During calibration, it was necessary to adjust this value by only 15% to 2300 m to obtain very good agreement between modeled and measured overpressure at the injection well.
Acknowledgements
We gratefully acknowledge Statoil and the Snøhvit Production License for use of data from the Snøhvit CO2 Storage Project. We thank Philip Ringrose and Yunwei Sun for useful discussions and review comments. This work was sponsored by the US Department of Energy, Office of Fossil Energy, Carbon Storage Program, managed by Traci Rodosta and Andrea McNemar. This work was performed under the auspices of the US DOE by Lawrence Livermore National Laboratory under contract DE-AC52-07NA27344.References
- C. Lu, et al., Uncertainty quantification of CO2 leakage through a fault with multiphase and nonisothermal effects, Greenhouse Gases: Sci. Technol., 2012, 2, 445–459 CrossRef CAS.
- L. Chiaramonte, J. A. White and W. Trainor-Guitton, Probabilistic geomechanical analysis of compartmentalization at the Snøhvit CO2 sequestration project, J. Geophys. Res.: Solid Earth, 2015, 120(2), 1195–1209 CrossRef.
- M. D. Zoback and S. M. Gorelick, Earthquake triggering and large-scale storage of carbon dioxide, Proc. Natl. Acad. Sci. U. S. A., 2012, 109(26), 10164–10168 CrossRef CAS PubMed.
- O. Hansen, et al., Snøhvit: The history of injecting and storing 1 Mt CO2 in the fluvial Tubåen Formation, Energy Procedia, 2013, 37, 3565–3573 CrossRef CAS.
- R. J. Pawar, et al., Recent advances in risk assessment and risk management of geologic CO2 storage, Int. J. Greenhouse Gas Control, 2015, 40, 292–311 CrossRef CAS.
- J. A. White, et al., Geomechanical behavior of the reservoir and caprock system at the In Salah CO2 storage project, Proc. Natl. Acad. Sci. U. S. A., 2014, 111(24), 8747–8752 CrossRef CAS PubMed.
- A. Rucci, D. W. Vasco and F. Novali, Monitoring the geologic storage of carbon dioxide using multicomponent SAR interferometry, Geophys. J. Int., 2013, 193(1), 197–209 CrossRef CAS.
- A. J. Garnett, C. R. Greig and M. Oettinger, ZeroGen IGCC with CCS: A case history, The Univerisity of Queensland, 2014, http://www.uq.edu.au/energy/docs/ZeroGen.pdf, accessed 1 October 2015 Search PubMed.
- R. J. Cavanagh, S. Haszeldine and B. Nazarian, Sleipner CO2 storage site: Using a basin model to understand reservoir simulations of plume dynamics, First Break, 2015, 33(6), 61–68 Search PubMed.
- U.S. National Coal Council, Fossil forward: Revitalizing CCS bringing scale and speed to CCS deployment, 2015, http://www.nationalcoalcouncil.org/studies/2015/Fossil-Forward-Revitalizing-CCS-NCC-Approved-Study.pdf. Accessed 1 October 2015.
- P. E. S. Bergmo, A.-A. Grimstad and E. Lindeberg, Simultaneous CO2 injection and water production to optimise aquifer storage capacity, Int. J. Greenhouse Gas Control, 2011, 5, 555–564 CrossRef CAS.
- J. T. Birkholzer, A. Cihan and Q. Zhou, Impact-driven pressure management via targeted brine extraction: Conceptual studies of CO2 storage in saline formations, Int. J. Greenhouse Gas Control, 2012, 7, 168–180 CrossRef CAS.
- T. A. Buscheck, et al., Active CO2 reservoir management for carbon storage: Analysis of operational strategies to relieve pressure buildup and improve injectivity, Int. J. Greenhouse Gas Control, 2012, 6, 230–245 CrossRef CAS.
- T. A. Buscheck, et al., Integrated geothermal-CO2 reservoir systems: Reducing carbon intensity through sustainable energy production and secure CO2 storage, Energy Procedia, 2013, 37, 6587–6594 CrossRef CAS.
- A. Cihan, J. T. Birkholzer and M. Bianchi, Optimal well placement and brine extraction for pressure management during CO2 sequestration, Int. J. Greenhouse Gas Control, 2015, 42, 175–187 CrossRef CAS.
- E. Heath, et al., Multiwell CO2 injectivity: Impact of boundary conditions and brine extraction on geologic CO2 storage efficiency and pressure buildup, Environ. Sci. Technol., 2014, 48(2), 1067–1074 CrossRef PubMed.
- J.-Q. Shi, et al., Snøhvit CO2 storage project: Assessment of CO2 injection performance through history matching of the injection well pressure over a 32-month period, Energy Procedia, 2013, 37, 3267–3274 CrossRef CAS.
- T. A. Buscheck, et al., Pre-injection brine production for managing pressure in compartmentalized CO2 storage reservoirs, Energy Procedia, 2014, 63, 5333–5340 CrossRef CAS.
- D. Dempsey, S. Kelkar and R. Pawar, Passive injection: A strategy for mitigating reservoir pressurization, induced seismicity, and brine migration in geologic CO2 storage, Int. J. Greenhouse Gas Control, 2014, 28, 96–113 CrossRef CAS.
- R. Middleton and J. M. Bielicki, A scalable infrastructure model for carbon capture and storage: SimCCS, Energy Policy, 2009, 37, 1052–1060 CrossRef.
- W. L. Bourcier, et al., A preliminary cost and engineering estimate for desalinating produced formation water associated with carbon dioxide capture and storage, Int. J. Greenhouse Gas Control, 2011, 5, 1319–1328 CrossRef CAS.
- A. Torabi, et al., Strain location in sandstone and its implication for CO2 storage, First Break, 2015, 33(7), 81–92 Search PubMed.
- Y. Hao, Y. Sun and J. J. Nitao, Overview of NUFT: A versatile numerical model for simulating flow and reactive transport in porous media, in Groundwater Reactive Transport Models, 2012, ch. 9, pp. 213–240 Search PubMed.
- R. Span and W. Wagner, A new equation of state for carbon dioxide covering the fluid region from the triple-point temperature to 1100 K at pressures up to 800 MPa, J. Phys. Chem. Ref. Data, 1996, 25, 1509–1596 CrossRef CAS.
- A. Fenghour, W. A. Wakeham and V. Vesovic, The viscosity of carbon dioxide, J. Phys. Chem. Ref. Data, 1998, 27(1), 31–44 CrossRef CAS.
- ASME, ASME Steam Tables Compact Edition, ASME. Three Park Ave, New York, NY, USA, 2006.
- J. W. Johnson, J. J. Nitao and J. P. Morris, Reactive transport modeling of caprock integrity during natural and engineered CO2 storage, Carbon Dioxide Capture Storage Deep Geol. Form.–Results CO2 Capture Proj., 2005, 2, 787–813 CAS.
- J. P. Morris, et al., A Study of Injection-Induced Mechanical Deformation at the In Salah CO2 Storage Project, Int. J. Greenhouse Gas Control, 2011, 5(2), 270–280 CrossRef CAS.
- P. M. Schutjens, et al., Compaction-induced porosity/permeability reduction in sandstone reservoirs: Data and model for elasticity-dominated deformation, SPE Reservoir Eval. Eng., 2004, 7, 202–216 CrossRef CAS.
| This journal is © The Royal Society of Chemistry 2016 |