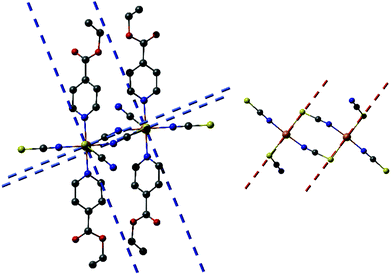
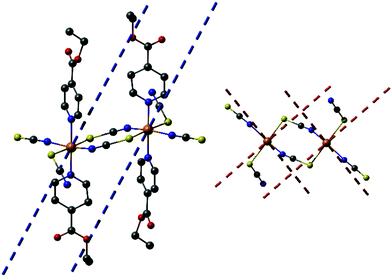
 Open Access Article
Creative Commons Attribution 3.0 Unported Licence
Synthesis, structures, magnetic, and theoretical investigations of layered Co and Ni thiocyanate coordination polymers†
Stefan
Suckert
a,
Michał
Rams
b,
Michael
Böhme
c,
Luzia S.
Germann
d,
Robert E.
Dinnebier
d,
Winfried
Plass
c,
Julia
Werner
a and
Christian
Näther
*a
aInstitut für Anorganische Chemie, Christian-Albrechts-Universität zu Kiel, Max-Eyth-Straße 2, 24118 Kiel, Germany. E-mail: cnaether@ac.uni-kiel.de
bInstitute of Physics, Jagiellonian University, Łojasiewicza 11, 30-348 Krakow, Poland
cInstitut für Anorganische und Analytische Chemie, Universität Jena, Humboldtstr. 8, 07743 Jena, Germany
dMax Planck Institute for Solid State Research, Heisenbergstraße 1, 70569 Stuttgart, Germany
First published on 24th October 2016
Abstract
Reaction of cobalt(II) and nickel(II) thiocyanate with ethylisonicotinate leads to the formation of [M(NCS)2(ethylisonicotinate)2]n with M = Co (2-Co) and M = Ni (2-Ni), which can also be obtained by thermal decomposition of M(NCS)2(ethylisonicotinate)4 (M = Co (1-Co), Ni (1-Ni)). The crystal structure of 2-Ni was determined by single crystal X-ray diffraction. The Ni(II) cations are octahedrally coordinated by two N and two S bonding thiocyanate anions and two ethylisonicotinate ligands and are linked by pairs of anionic ligands into dimers, that are connected into layers by single thiocyanate bridges. The crystal structure of 2-Co was refined by Rietveld analysis and is isostructural to 2-Ni. For both compounds ferromagnetic ordering is observed at 8.7 K (2-Ni) and at 1.72 K (2-Co), which was also confirmed by specific heat measurements. Similar measurements on [Co(NCS)2(4-acetylpyridine)2]n that exhibits the same layer topology also prove magnetic ordering at 1.33 K. Constrained DFT calculations (CDFT) support the ferromagnetic interactions within the layers. The calculated exchange constants in 2-Ni were used to simulate the susceptibility by quantum Monte Carlo method. The single-ion magnetic anisotropy of the metal ions has been investigated by CASSCF/CASPT2 calculations indicating significant differences between 2-Ni and 2-Co.
Introduction
The synthesis of new coordination compounds showing cooperative magnetic properties is still an important and challenging field in coordination chemistry.1 For their synthesis paramagnetic metal cations must be linked by small-sized anionic ligands that can mediate magnetic exchange. Among possible ligands are thio- or selenocyanato anions, that can differently coordinate to metal cations and for which an increasing number of new compounds were recently reported.2 In this context, the magnetic properties of thio- and selenocyanato coordination polymers based on the 3d cations Mn(II), Fe(II), Co(II) and Ni(II) are of special interest for us, because depending on the nature of the metal cations and the N-donor co-ligands, different magnetic properties are observed. In the course of our investigations we have reported a number of compounds with the composition M(NCX)2(L)2 (M = Mn(II), Fe(II), Co(II), Ni(II) and X = S, Se and L = monodentate N-donor co-ligand).3 In most of these compounds the metal cations are linked by pairs of thiocyanate anions into chains.3 However, depending on the N-donor co-ligand there are also a few examples where the cations build layered structures with different topologies.4 In this regard it is noted, that with 4-acetylpyridine as co-ligand two different isomers with the composition Co(NCS)2(4-acetylpyridine)2 are obtained. Interestingly, one isomer shows a chain structure, whereas the second consists of Co(NCS)2 dimers which are further linked by single thiocyanate anions into layers.5 The chain compound is a quasi 1D ferromagnet, which shows a slow relaxation of the magnetization, whereas the susceptibility curves of the layered compound indicate paramagnetic behavior. It is noted that the 2D compound represents the thermodynamic stable form at room temperature and is obtained either from solution or by thermal decomposition of Co(NCS)2(4-acetylpyridine)4.5 In contrast, the chain isomer is thermodynamically metastable and only accessible by careful thermal annealing of the hydrate precursor Co(NCS)2(4-acetylpyridine)2(H2O)2 at elevated temperatures.In the course of our systematic investigations we became interested in ethylisonicotinate as co-ligand. In this context the question arises whether compounds with μ-1,3 bridging thiocyanate anions can be prepared and if they will consist of chained or layered structures. The crystal structure of two compounds with the composition Co(NCS)2(ethylisonicotinate)4 (1-Co) and Ni(NCS)2(ethylisonicotinate)4, (1-Ni) were already reported in the literature.6 These compounds consist of discrete complexes and might be used as precursors for the synthesis of the desired compounds with bridging anionic ligands. 1-Co and 1-Ni crystallize both in two different modifications, with comparable lengths of the a- and b-axis, whereas the c-axis is doubled for 1-Ni compared to that in 1-Co. Moreover, there is also a compound reported, in which the co-ligand is protonated ([ethylisonicotinate-H]+[Cu(I)(NCS)2]−) and thus, does not participate in the metal coordination.7 It is noted that two compounds with azide ligands are published, which exhibit a similar coordination to that of our desired thiocyanate compounds. In [Mn(N3)2(ethylisonicotinate)2]n, the Mn(II) cations are linked by the azido anions into layers, whereas in [Cu(N3)2(ethylisonicotinate)2]n, the Cu(II) cations are linked into chains.8
Experimental section
Syntheses
Co(NCS)2, NiSO4·6H2O and KNCS were obtained from Merck, Ba(NCS)2·3H2O and ethylisonicotinate were obtained from Alfa Aesar. Ni(NCS)2 was prepared by the reaction of equivalent amounts of Ba(NCS)2·3H2O and NiSO4·6H2O in water. The precipitate of BaSO4 was filtered off and the solvent was removed from the filtrate using a rotatory evaporator. All solvents and reactants were used without further purification. Crystalline powders were synthesized by stirring the reactants in the respective solvents at room temperature. The residues were filtered off and washed with the used solvent and dried in air. The phase purity of all compounds was verified by X-ray powder diffraction (XRPD) and elemental analysis.Elemental analysis
CHNS analysis was performed using an EURO EA elemental analyzer, fabricated by EURO VECTOR Instruments.IR spectroscopy
All IR data were obtained using an ATI Mattson Genesis Series FTIR Spectrometer, control software: WINFIRST, from ATI Mattson.Differential thermal analysis and thermogravimetry (DTA-TG)
DTA-TG measurements were performed in a dynamic nitrogen atmosphere (purity: 5.0) in Al2O3 crucibles using a STA-409CD thermobalance from Netzsch. The instrument was calibrated using standard reference materials. All measurements were performed with a flow rate of 75 mL min−1 and were corrected for buoyancy.Single-crystal structure analyses
Data collections were performed with an imaging plate diffraction system (IPDS-2) from STOE & CIE using Mo-Kα-radiation. A numerical absorption correction was applied using programs X-RED and X-SHAPE of the program package X-Area.9 The crystal structure solution was performed with SHELXT10 and structure refinement was performed against F2 using SHELXL-2014.11 All non-hydrogen atoms were refined with anisotropic thermal displacement parameters. All hydrogen atoms were positioned with idealized geometries and were refined isotropic with Uiso(H) = −1.2Ueq(C) using a riding model. One ethylisonicotinate ligand was found to be disordered with two orientations in 1-Ni and 2-Ni. The disorder was refined with a split model with side occupancies of 75![[thin space (1/6-em)]](https://www.rsc.org/images/entities/char_2009.gif) :
:![[thin space (1/6-em)]](https://www.rsc.org/images/entities/char_2009.gif) 25 and using same angle and distance restraints. The absolute structure of 1-Ni was determined (Flack x parameter = 0.003(11) by classical fit to all intensities and 0.003(5) from 3405 selected quotients (Parsons’ method). Selected crystal data and details of the structure refinements are given in Table S1 in the ESI†).
25 and using same angle and distance restraints. The absolute structure of 1-Ni was determined (Flack x parameter = 0.003(11) by classical fit to all intensities and 0.003(5) from 3405 selected quotients (Parsons’ method). Selected crystal data and details of the structure refinements are given in Table S1 in the ESI†).
CCDC 1506855 (1-Ni) and 1506856 (2-Ni) contain the supplementary crystallographic data for this paper.
X-Ray powder diffraction (XRPD)
The measurements were performed using (1) a Stoe Transmission Powder Diffraction System (STADI P) with Cu Kα1 radiation (λ = 1.540598 Å) equipped with a MYTHEN 1K detector and a Johann Ge(111) monochromator and 2) a Stoe Stadi-P machine (Mo Kα1 radiation, λ = 0.7093 Å), equipped with a MYTHEN 1K detector and a Johann Ge(111) monochromator in Debye Scherrer geometry. Rietveld refinements12 of 2-Co and 2-Ni were performed using TOPAS 5.0![[thin space (1/6-em)]](https://www.rsc.org/images/entities/char_2009.gif) 13 starting from the crystallographic data of 2-Ni determined by single crystal structure analysis. The profile function was described in both cases with the fundamental parameter approach, while the background was modelled by Chebychev polynomials. For both compounds the hydrogen atoms were fixed at geometric calculated positions and an overall isotropic thermal displacement parameter was used for all non-H atoms and for hydrogen atoms a Uiso(H) = −1.2Ueq(C) of the corresponding parent atom. For refining the atomic positions distance and angle restrains were used.
13 starting from the crystallographic data of 2-Ni determined by single crystal structure analysis. The profile function was described in both cases with the fundamental parameter approach, while the background was modelled by Chebychev polynomials. For both compounds the hydrogen atoms were fixed at geometric calculated positions and an overall isotropic thermal displacement parameter was used for all non-H atoms and for hydrogen atoms a Uiso(H) = −1.2Ueq(C) of the corresponding parent atom. For refining the atomic positions distance and angle restrains were used.
The high temperature XPRD measurements were performed on a Bruker D8 diffractometer (Mo Kα1 equipped with a primary Ge(220)-Johann monochromator and a LynxEye position sensitive detector) in Debye–Scherrer geometry using a water cooled capillary furnace (mri Physikalische Geräte GmbH). 1-Ni was heated from room temperature to 150 °C in 20 °C steps and then up to 350 °C in 5 °C steps (heating rate 0.5 °C s−1). 1-Co was heated from room temperature to 150 °C in 20 °C steps and then up to 350 °C in 5 °C steps (heating rate 0.5 °C s−1). Selected crystal data and details of the Rietveld refinements are given in Table S2 in the ESI†).
Magnetic measurements
Magnetic measurements were performed using a MPMS SQUID magnetometer from Quantum Design. Powders were pressed inside a small PTFE bag to form rigid pellets and immobilize sample grains. The diamagnetic contributions of the sample holder and the core diamagnetism were subtracted, using measured and calculated values, respectively.Specific heat measurements
Specific heat was measured by the relaxation technique using a Quantum Design PPMS. Powders were pressed into a pellet with a diameter of 2 mm. Apiezon N grease was used to ensure thermal contact of the samples with the microcalorimeter. The heat capacity of the grease was measured before each run and subtracted from the measured data.Computational details
Single-crystal (2-Ni) and Rietveld refined atomic positions (2-Co) have been taken as initial molecular structures for the different computational models (for details see Computational studies). Hydrogen atoms were optimized with the Turbomole 6.6 package of programs14 at RI-DFT15/BP8616/def2-SVP17 level of theory. Co(II) and Ni(II) ions have been replaced by diamagnetic Zn(II) ions within these optimizations to save computational time. In case of 2-Ni and 2-Co the magnetic coupling constants have been calculated within the constrained DFT (CDFT)18 approach. The B3LYP hybrid functional16a,19 in combination with def2-TZVPP (Co, Ni), def2-TZVP (N, S), and def2-SVP (remaining atoms) basis sets17 were used. CDFT calculations have been performed with NWChem 6.6![[thin space (1/6-em)]](https://www.rsc.org/images/entities/char_2009.gif) 20 in which two spin constraints, that contained the specific 3d metal ion and its six donor atoms, were applied to perform the high-spin and broken-symmetry state calculations. Subsequently, the magnetic coupling constant J was calculated by eqn (1) (2-Ni: SA = SB = 2; 2-Co: SA = SB = 3) for a Heisenberg Hamiltonian (H = −JS1S2).
20 in which two spin constraints, that contained the specific 3d metal ion and its six donor atoms, were applied to perform the high-spin and broken-symmetry state calculations. Subsequently, the magnetic coupling constant J was calculated by eqn (1) (2-Ni: SA = SB = 2; 2-Co: SA = SB = 3) for a Heisenberg Hamiltonian (H = −JS1S2). | (1) |
Ab initio calculations for 2-Ni and 2-Co have been performed with Molcas 8.0 SP1.21 In case of 2-Co and 2-Ni CASSCF calculations with 7 and 8 electrons, respectively, in 10 orbitals (3d and 4d shells) were carried out. In case of 2-Co 10 quartet states (4F, 4P) and 40 doublet states (2G, 2P, 2H, 2D, 2D, 2F) were included, whereas for 2-Ni 10 triplet (3F, 3P) and 15 singlet states (1D, 1G, 1S) were considered. Additionally, scalar relativistic effects were employed with a second-order Douglas–Kroll–Hess Hamiltonian in combination with ANO-RCC basis sets (Co, Ni, and donor atoms: ANO-RCC-VTZP; other atoms: ANO-RCC-VDZ).22 Subsequently, dynamic correlation for 2-Co was treated with CASPT2 on the basis of the CASSCF wave functions for 10 quartet and the 12 lowest doublet states, whereas in case of 2-Ni all 10 triplet and 15 singlet states were included. The RASSI-SO method was employed to treat mixing of states with different multiplicities and to include spin–orbit coupling. Finally, the SINGLE_ANISO module on basis of the RASSI-SO wave function was used to obtain single-ion anisotropy.
Results and discussion
Synthetic and structural investigations
Reaction of different molar ratios of Ni(NCS)2 and Co(NCS)2 with ethylisonicotinate in water or ethanol leads to the formation of four different crystalline phases, which were investigated by elemental analysis, IR-spectroscopy and XRPD. With a higher metal to ligand ratio the known compounds Co(NCS)2(ethylisonicotinate)4 (1-Co) and Ni(NCS)2(ethylisonicotinate)4 (1-Ni) formed, which were identified by comparison of the experimental and calculated XRPD pattern (Fig. S1 and S2 in the ESI†). By reducing the used amount of ethylisonicotinate during synthesis, two previously unknown coordination polymers with the composition Co(NCS)2(ethylisonicotinate)2 (2-Co) and Ni(NCS)2(ethylisonicotinate)2 (2-Ni) were obtained. 2-Co and 2-Ni are isomorphic, according to the Rietveld refinements. The IR bands at 2104 cm−1 for 2-Co and of 2117 cm−1 for 2-Ni are attributed to the asymmetric CN-stretch vibrations indicating that in these crystalline phases the metal cations are linked by bridging thiocyanate anions (Fig. S3 and S4 in the ESI†). For terminal N-bonded thiocyanate anions they are shifted to lower values, as it is the case for the discrete complexes 1-Co (νasCN = 2054 and 2074 cm−1) and 1-Ni (νasCN = 2066 and 2084 cm−1; Fig. S5 and S6 in the ESI†). It is noted, that we redetermined the lattice parameters of 1-Co and 1-Ni at room-temperature to have a better comparison between the experimental and calculated XRPD pattern. Surprisingly, for 1-Ni a unit cell was obtained, in which the c-axis is only half of that reported in literature.6b In this case lattice parameters of the smaller unit cell are very similar to those reported for 1-Co, which indicates that both compounds are isotypic. It is noted, that the structure of 1-Ni reported in literature was determined at 100 K and therefore, it is likely that this compound shows a phase transition on cooling. To investigate this in more detail, we determined this structure at 170 K, where no changes of the unit cell parameters were detected and careful inspection of the reciprocal space does not show any super structure reflection. However, our structure is comparable to that reported and therefore, no further discussion is needed.The structure of 2-Ni was determined by single crystal X-ray diffraction analysis. 2-Ni crystallizes in the monoclinic space group P21/c with 4 formula units in the unit cell and all atoms located in general positions. The Ni(II) cations are octahedrally coordinated by two N and two S bonded thiocyanate anions and two ethylisonicotinate ligands, all of them in trans-position (Fig. 1). All M–N and M–S bond lengths are comparable to those in related compounds (Table S3 in the ESI†). The angles slightly deviate from the ideal values and the coordination polyhedral around the Ni(II) cations can be described as a slightly distorted elongated octahedra.
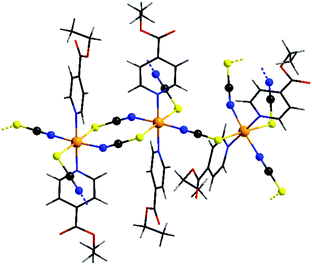 | ||
| Fig. 1 Crystal structure of 2-Ni with view of the coordination sphere of the Ni(II) cations. The disorder of one of the ethylisonicotinate ligands is not shown for clarity and an Ortep plot of 2-Ni is shown in Fig. S7 in the ESI.† | ||
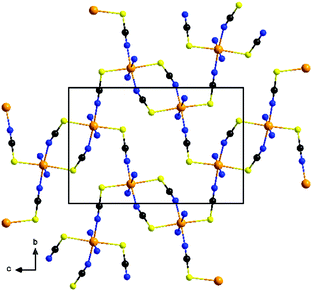
Each two cations are linked by pairs of anionic ligands into dimers that are further linked to four different Ni cations by single bridging thiocyanate anions (Fig. 1). From this arrangement, layers are formed, in which the cations are linked by alternating single and double thiocyanate bridges (Fig. 2). The Ni⋯Ni distance along the double bridges of 5.617(1) Å is significant shorter that along the single bridge of 5.829(1) Å. It is noted, that the layer topology is identical to that in the 2D isomer of [Co(NCS)2(4-acetylpyridine)2]n recently reported.5
The experimentally obtained lattice parameter of 2-Ni show some deviation between single crystal X-ray data (200 K) and XRPD data (293 K) (Tables S1 and S2 in the ESI†). The deviations remain even though the single crystal experiment was repeated at room temperature the calculated powder pattern compared to the measured one (Fig. S8 in the ESI†). The small change in the lattice parameters of 2-Ni (Tables S1 and S2 in the ESI†) is due to a change of one torsion angle of the ethyl group of the ethylisonicotinate ligand leading to a slightly different packing of the layers. It is noted, that the topology of the thiocyanate network is not affected.
No single crystals were obtained for 2-Co and therefore its crystal structure was determined and refined by Rietveld analysis, starting with the crystal structure of 2-Ni (Fig. S9 and S10 in the ESI†). According to the conducted Rietveld analysis, both 2-Co and 2-Ni are isostructural as bulk material. If the experimental XRPD patterns of the batches used for magnetic measurements are compared with those calculated from the Rietveld analysis it is obvious that both compounds were obtained as phase pure materials (Fig. S8 and S11 in the ESI†).
As expected for isostructural compounds, very similar intralayer and interlayer M⋯M distances are observed for 2-Co and 2-Ni (Table 1). Moreover, the M⋯M distance within the dimers is much shorter than that of the single bridge that connects the dimers (Table 1).
| Compound | 2-Ni (single crystal) | 2-Ni (Rietveld) | 2-Co (Rietveld) |
|---|---|---|---|
| M⋯M (double bridge) | 5.617(1) | 5.581(5) | 5.652(6) |
| M⋯M (single bridge) | 5.829(1) | 5.850(5) | 5.887(6) |
| M⋯M (interlayer) | 13.923(2) | 14.279(6) | 14.089(6) |
| 14.791(2) | 15.020(7) | 14.948(7) |
Thermoanalytical investigations
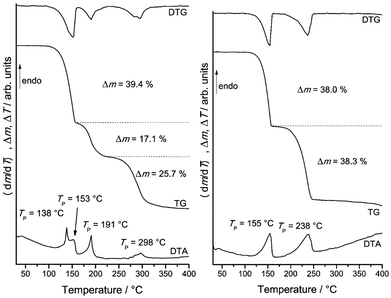
As mentioned above, 1-Co and 1-Ni might be useful precursors for the preparation of ligand deficient compounds by thermal decomposition. In this case the question rises if compounds of composition M(NCS)2(ethylisonicotinate)2 (M = Co, Ni) can be obtained and if they will correspond to the layered compounds 2-Co and 2-Ni or if different crystalline phases are observed, as it is the case, e.g., for the compounds with acetylpyridine as ligand.51-Co shows three mass loss steps in the TG curve, which are accompanied by endothermic events in the DTA curve (Fig. 3 and S12 in the ESI†). The observed experimental mass loss of 39.4% in the first mass step is in good agreement with that calculated for the removal of two ethylisonicotinate ligands (Δmcalc. = 38.8%). On further heating an additional mass step is observed, indicating the formation of a further crystalline phase with less ligand. The residue obtained after the first and second mass step were isolated and investigated by XRPD. Rietveld refinements of the residue obtained in the first mass step as well as temperature dependent XRPD measurements confirmed the formation of 2-Co (Fig. S13 and S16 in the ESI†). XRPD investigations of the residue obtained after the second TG step showed that an amorphous sample was obtained (Fig. S14 in the ESI†). This was confirmed by temperature dependent XRPD measurements, where no intensity above 180 °C was observed (Fig. S16 in the ESI†). The asymmetric CN stretching vibration is observed at 2051 cm−1, which indicates the presence of only terminal anionic ligands (Fig. S15 in the ESI†). To investigate the thermal reactivity of 1-Co in more detail, heating rate dependent measurements were performed (Fig. 3). In this case several mass steps were observed, for which the mass loss depends on the actual heating rate, indicating for a more complex reaction. This is typical for reactions where kinetic effects have a large impact on the product formation as already observed for, e.g., Cu(II) coordination polymers.23
TG measurements for 1-Ni show two mass steps that are each accompanied with the removal of half of the ethylisonicotinate ligands and that there is no influence of the actual heating rate (Fig. 3 and S17 in the ESI†). The first mass step (Δm = 38.0%) corresponds to the loss of two ethylisonicotinate ligands and thus to the transformation of 1-Ni into 2-Ni (Fig. S18 in the ESI†). This in good agreement with the temperature dependent XRPD measurements, where 2-Ni was the only phase above 150 °C (Fig. S19 in the ESI†), which is around 5 °C below the transition temperature, detected by DTA measurements. The second mass step (Δm = 38.3%) corresponds to the loss of the remaining ethylisonicotinate ligands.
Magnetic investigations on 2-Co and 2-Ni
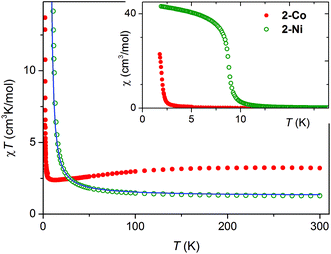
For 2-Co and 2-Ni the temperature dependence of the susceptibility was measured in field of 1 kOe (Fig. 4: inset). For 2-Co the χ vs. T curve indicates paramagnetic behavior as already observed for [Co(NCS)2(4-acetylpyridine)2]n. In contrast, for 2-Ni the susceptibility increases significantly and at very low temperatures saturation is observed, which is indicative for a ferromagnetic transition below 10 K (Fig. 4: inset).For 2-Co a room-temperature value of the χT product of 3.23 cm3 K mol−1 is observed, which is in agreement with those commonly reported for Co(II) compounds in an octahedral ligand field.24
The gradual drop of χT at lower temperatures is mainly due to the change of the effective magnetic moment caused by the spin–orbit coupling of single Co(II) cations (Fig. 4). Without any magnetic interaction a drop to 1.6–1.8 cm3 K mol−1 in the limit of zero temperature would be expected. Thus, the rise of χT observed below 12 K is the effect of a ferromagnetic exchange through the anionic ligands.
For 2-Ni the measured value of χT at room temperature is 1.26 cm3 K mol−1, which corresponds to a g factor equal 2.25 for the spin S = 1 (Fig. 4). Similar values are reported in other Ni(II) compounds.25 However, for Ni(II) cations in an N4S2 coordination sometimes slightly higher values are obtained as it is the case for the 2D compounds [Ni(NCS)2(4-tert-butylpyridine)2]n, and [Ni(NCS)2(2-methylpyrazine)2]n![[thin space (1/6-em)]](https://www.rsc.org/images/entities/char_2009.gif) 4c and in the chain compound [Ni(NCS)2(pyridine)2]n.26 The gradual increase of χT with decreasing temperature is a sign for dominating ferromagnetic exchange interactions.
4c and in the chain compound [Ni(NCS)2(pyridine)2]n.26 The gradual increase of χT with decreasing temperature is a sign for dominating ferromagnetic exchange interactions.
The magnetization measured at 1.8 K is shown in Fig. 5. For 2-Ni a hysteresis loop is clearly visible pointing to a ferromagnetic ground state, as indicated by the susceptibility measurements. The M(H) curve measured for 2-Co at 1.8 K is clearly nonlinear already at low fields. In both cases a significant anisotropy is present, as the magnetization at 50 kOe is still not saturated (Fig. 4).
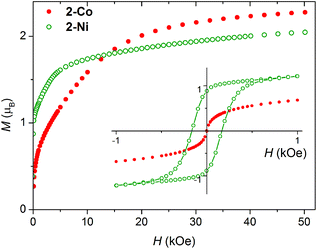 | ||
| Fig. 5 Magnetization of 2-Co and 2-Ni measured at T = 1.8 K. Inset: Low field magnetization hysteresis loop. | ||
Low field susceptibility data are presented in Fig. 6 and 7. The sudden increase of χ observed for 2-Ni around Tc = 8.7 K is accompanied by the divergence of zero-field cooled and field cooled measurement. Simultaneously, below Tc the susceptibility becomes field dependent leading to a larger divergence with decreasing field, typical for a ferromagnet. This, experiment together with the shape of the hysteresis loop, allows drawing the conclusion that a ferromagnetic ordering takes place. Similar measurements for 2-Co show only a significant increase of susceptibility below 2 K and a strong field dependence of χ (Fig. 7).
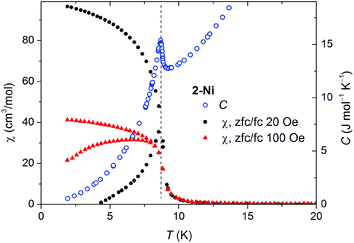 | ||
| Fig. 6 Zero-field cooled and field cooled susceptibility measured at two low fields for 2-Ni (black and red points). The specific heat (blue open symbols) shows a peak at 8.70 K. | ||
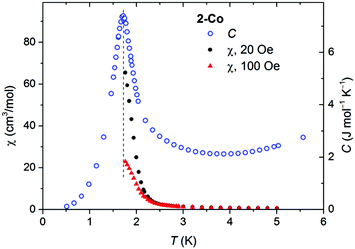 | ||
| Fig. 7 Susceptibility measured at two small fields (black and red points), shown together with the specific heat C(T) of 2-Co. | ||
For both compounds, additional AC susceptibility measurements were performed as function of temperature at different frequencies for 2-Ni the in-phase χ′ and the out-of-phase component χ′′ shows a maximum and the lack of any significant frequency dependence is typical for a ferromagnet (Fig. S20 and S21 in the ESI†).
For 2-Co similar AC measurements show a maximum in the in-phase component χ′, which is not visible in the out-of-phase signal (Fig. S21 in the ESI†). However, a closer look indicates that even χ′ might pass a maximum at lower temperatures, indicating a ferromagnetic transition, which is not visible because the magnetic measurements can only be performed down to 1.75 K.
Specific heat measurements on 2-Co and 2-Ni
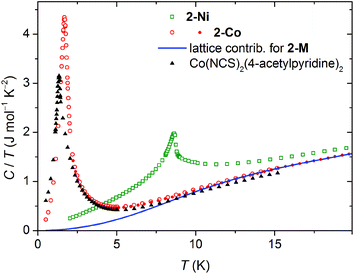
Because of the limited temperature range in the bulk magnetic measurements we were not able to prove a possible magnetic ordering of 2-Co. For this reason, we measured the specific heat C(T) for 2-Co and 2-Ni, which was feasible down to 0.4 K. The temperature dependency of the specific heat superimposed on low-field magnetic susceptibility data are shown in Fig. 6 and 7.For 2-Ni a distinct peak in C(T) is present at 8.70 K. Its position precisely corresponds to the temperature where the low-field susceptibility has the maximum slope (see Fig. 6). The peak has a lambda-type shape, which is characteristic for second order phase transitions. This confirms that the magnetic moments in 2-Ni undergo a long range ordering at Tc = 8.7 K. The peak is sharp and no further peaks are present, which shows that the magnetic behavior of the studied sample is homogenous.
Specific heat measurement for 2-Co shows a pronounced peak at 1.72 K, which is much lower than for 2-Ni. The observation of this peak definitely confirms the impression from the magnetic measurements, that a magnetic ordering takes place in 2-Co at very low temperatures.
The observed peaks of the specific heat are on the background that originates mainly from the crystal lattice vibrations. The analysis of the entropy change related to the ordering transition requires good estimation of this background, which is not always straightforward. This particular case is fortunate, because Ni and Co have almost identical molar masses and therefore, the identical lattice contribution Clattice can be assumed for the two isostructural compounds. The data measured up to 60 K confirms very similar specific heat for 2-Ni and 2-Co above 20 K.
To quantitative model the lattice contribution we used the linear combination of the Debye and Einstein models of the phonon density of states to account for both, acoustic and optical phonon bands. Below 40 K it was enough to assume a single acoustic branch described by θE and a single optical branch described by θD.
| Clattice = ADCDebye(T,θD) + AECEinstein(T,θE) |
Such an approach is supported by our earlier analysis of the specific heat of diamagnetic Cd(NCS)2(pyridine)2, where such approximation works at least up to 40 K. In the present case, fitting this model to the specific heat of 2-Ni in the range 10–40 K leads to values θD = 75.3(7) K, θE = 147.5(1.5) K, AD = 1.98(3), AE = 5.69(7) J (mol K)−1. The Clattice, extrapolated to lower temperature, as shown in Fig. 7, was then subtracted to estimate the remaining contributions to the specific heat and integrate C/T to obtain the entropy change ΔS related to the ordering. For 2-Co, ΔS = 5.8 J (mol K)−1 in the range 0.5–15 K, very close to the R·ln![[thin space (1/6-em)]](https://www.rsc.org/images/entities/char_2009.gif) 2 = 5.76 J (mol K)−1 expected for a ground state Kramers doublet (KD) of Co(II). For 2-Ni, integrated ΔS = 8.0 J (mol K)−1 from 2 to 30 K, which is a bit lower than R·ln
2 = 5.76 J (mol K)−1 expected for a ground state Kramers doublet (KD) of Co(II). For 2-Ni, integrated ΔS = 8.0 J (mol K)−1 from 2 to 30 K, which is a bit lower than R·ln![[thin space (1/6-em)]](https://www.rsc.org/images/entities/char_2009.gif) 3 = 9.13 J (mol K)−1 anticipated for ordering of spins S = 1.
3 = 9.13 J (mol K)−1 anticipated for ordering of spins S = 1.
Investigations on [Co(NCS)2(4-acetylpyridine)2]n
The crystal structures of 2-Co and 2-Ni are very similar to that of the 2D isomer [Co(NCS)2(4-acetylpyridine)2]n reported recently, that exhibits the same topology of the thiocyanate coordination network.5 For this compound a preliminary DC magnetic measurements down to 2.4 K were performed, that looked like that for a simple paramagnet.5 This seems to be a bit unusual because some magnetic ordering would be expected and based on the results for 2-Co, it is indicated that even this compound might show magnetic ordering presumably at lower temperatures. Therefore, the magnetic properties of the 4-acetylpyridine compound were reinvestigated in more detail. In this context it is noted that it was prepared according literature procedure and XRPD as well as IR measurements show that it was obtained as a pure crystalline phase (Fig. S23 and S24 in the ESI†).DC measurements down to 1.8 K look similar to that already reported and gave no hint for a, e.g. saturation of the susceptibility but it is noted that the χT versus temperature curve looks similar to that of 2-Co (Fig. S25 in the ESI†). AC susceptibility measurements show increasing values of the in-phase susceptibility whereas for the out-of-phase component no signal was observed (Fig. S26 in the ESI†). Magnetization measurements show no saturation even at 50 kOe but look very similar to that of 2-Co (Fig. S27 in the ESI†). However, to definitely prove whether this compound shows any magnetic ordering at lower temperatures, specific heat measurements down to 0.4 K were performed. The presence of a distinct peak at 1.33 K proves that even this compound shows magnetic ordering at very low temperatures (see Fig. 8). The transition temperature is significantly lower than that of 2-Co, which explains why there was no hint for a transition in the magnetic measurements.
The fact that 2D [Co(NCS)2(4-acetylpyridine)2]n orders at lower temperatures compared to [Co(NCS)2(ethylisonicotinate)2]n (2-Co) is somehow surprising because similar intralayer distances are observed but the interlayer distances for the acetylpyridine compound 12.6774(6) and 13.0169(6) Å are significantly shorter than that for 2-Co (compare Table 1). However, the packing of the layers is completely different, because in 2-Co they are perfectly stacked onto each other, whereas in the 4-acetylpyridine compound they are shifted (Fig. S28 in the ESI†).
Computational studies
For 2-Ni and 2-Co the intra-layer magnetic interactions were studied by quantum mechanical methods utilizing dinuclear model structures representing the different possible exchange pathways through the bridging thiocyanate ligands. Two structural models are required to describe the bridging modes observed in the crystal structure. Both models are appropriate cutouts of the polymeric structure, where [M2(NCS)6(4-ethylisonicotinate)4]2− represents the dimeric units with the two bridging anions, whereas the fragment [M2(NCS)7(4-ethylisonicotinate)4]3− was used to approximate the single bridged interactions (M = Ni for 2-Ni and Co for 2-Co, see Fig. S29 in the ESI†). However, as the compounds 2-Ni and 2-Co are neutral, the negative charge of the model fragments, arising from the terminating anionic ligands, need to be balanced in order to adequately describe the overall charge distribution. Hence, formal point charges of +0.5 and +1.0 were placed at the terminating positions of both model fragments for the singly and doubly bridging situation, respectively.Constrained DFT (CDFT) calculations for the model systems, which are based on the geometry of the single crystal structure of 2-Ni, predict for both bridging modes a ferromagnetic ground state (Table S4 in the ESI;† spin densities are depicted in Fig. S30 in the ESI†). This is in agreement with the low-temperature ferromagnetic ordering observed for 2-Ni. Although no large difference between the two possible exchange pathways is obtained, the coupling constant for the case with the single thiocyanate bridge (J1 = 10.5 K) is somewhat larger than the one found for the doubly bridged case (J2 = 7.7 K). This might be reasonable because for the chain compound [Ni(tppz)(NCS)(μ-1,3-NCS)]n that contains single NCS bridges a value of 7.82 cm−1 (11.2 K) was observed,2a whereas for the dimeric compound [Ni(terpy)(NCS)2]2, in which the Ni cations are linked by a thiocyanate double bridge a value of 4.9 cm−1 (7.0 K) was reported.27 However, the calculated exchange coupling constants are in good agreement with the experimentally observed transition at 8.7 K (see Fig. 6). We also performed calculations for which the structural parameters of the model systems were based on the Rietveld refined structure of 2-Ni. In this case the singlet state is found to be stabilized for both model fragments even leading to a weak ferromagnetic coupling for the single thiocyanate bridge (J1 = 3.2 K) and an antiferromagnetic coupling for the doubly bridged situation (Table S4 in the ESI†). This clearly shows that the calculated magnetic exchange coupling is very sensitive to the structural parameters used for the employed model systems, indicating the need for reliable high quality structural data as a basis for the corresponding calculations.
Finally, the exchange constants J1 = 10.5 K and J2 = 7.7 K calculated for 2-Ni by CDFT, were tested against the experimental data. Due to the complex topology of the layers, where the exchange paths create the deformed chicken-wire lattice (Fig. S36†), and therefore lack of an analytically solved model, we used quantum Monte-Carlo (QMC) simulations to accurately calculate the magnetic susceptibility. The looper code from the ALPS library was applied for this purpose.28 The simulated system consisted of the single layer of S = 1 spins and comprised 50 × 50 units marked in Fig. 2, with periodic boundary conditions. The isotropic average g factor of 2.25 was used. The calculated χT(T) curve is presented in Fig. 4, and closely follows the experimental points above 15 K, which is the experimental confirmation of the calculated values for J1 and J2. At lower temperature the calculated susceptibility is underestimated. This is related to the fact that the used two dimensional model cannot reproduce the magnetic ordering, because, according to the Mermin–Wagner theorem, no spontaneous symmetry breaking can occur at finite T for the isotropic two dimensional system.29 Therefore, the exact modelling of the ordering transition would require accounting of either the Ni(II) ion anisotropy, or the dipolar inter-layer interaction.
In case of 2-Co only the Rietveld refined atomic positions were available to generate the required model systems. CDFT calculations for both coupling pathways lead to rather large ferromagnetic interactions (Table S4 in the ESI† and for spin densities see Fig. S31 in the ESI†). However, these values clearly overestimate the experimental observation, which indicates the presence of a ferromagnetic ordering just below 2 K (see Fig. 7 and 8). In addition, we also performed calculations for a model system of 2-Co in which the atomic positions of the 2-Ni single crystal structure were used while replacing the Ni(II) by Co(II) ions. With this approach even a wrong antiferromagnetic ground state is predicted for both exchange interactions (Table S4 in the ESI†), which clearly contradict the experimental results (see Fig. 4). This again stresses the point that reliable structural data is required for adequate description, which for the lower energy differences in the case of Co(II) becomes even more evident.
The single-ion magnetic anisotropy of the metal centers in 2-Ni and 2-Co have been investigated by multi-reference ab initio CASSCF/CASPT2 calculations. However, these calculations are demanding in terms of computational effort and thus only molecular fragments with one 3d metal center can be investigated. The relevant computational models were generated following the concept described for the construction of the dinuclear model systems. Along this line the corresponding mononuclear fragments [M(NCS)4(4-ethylisonicotinate)2]2− (M = Ni for 2-Ni and Co for 2-Co) were terminated by appropriate point charges at the positions defined by adjacent metal centers in the polymeric structure (see Fig. S32 in the ESI†). The geometries of the model structures for 2-Ni and 2-Co are based on the available single-crystal and Rietveld analysis, respectively.
In general, high-spin Ni(II) ions in an octahedral geometry possess a 3A2g ground state (electronic configuration: [Ar] 3d8 with S = 1) which is primarily responsible for their magnetic properties due to considerable energy gaps to higher triplet (3T2g, 3T1g (both 3F), 3T1g (3P)) and singlet states (1D, 1G, 1S). Nevertheless, the latter states have a slight influence on the electronic ground state and, hence, have to be taken into account for a proper description. Table S5 in the ESI† shows the corresponding CASSCF and CASPT2 obtained energies for all 10 triplet and 15 singlet states in 2-Ni. With the essential treatment of dynamic correlation (CASPT2) a significant lowering of all singlet states as well as the 3P term can be observed, whereas the remaining 3F states (3T2g, 3T1g) are shifted to higher energies with respect to the 3A2g ground state. As a consequence, in case of 2-Ni the lowest singlet state can be found at 14![[thin space (1/6-em)]](https://www.rsc.org/images/entities/char_2009.gif) 131 cm−1. However, the spin-free eigenstates are not sufficient to generate an accurate understanding of magnetic properties and, hence, RASSI-SO/SINGLE_ANISO calculations on basis of the CASPT2 wave functions have been performed. As a result, the 3A2g ground state splits into three low-lying magnetic states (0, 9.4, and 10.1 cm−1). The description of these three magnetic states by an effective spin Hamiltonian (Seff = 1) leads to a small positive axial zero-field splitting (ZFS) parameter D of 9.72 cm−1 as well as an insignificant rhombic ZFS parameter E = 0.37 cm−1 (see Table 2). Thus, an easy-plane anisotropy with a MS = 0 ground state can be assumed. Moreover, the observed low-temperature hysteresis in case of 2-Ni (see Fig. 5) is not based on single-ion anisotropy. The corresponding small g values (Seff = 1, see Table 2) are a result of the lack of spin–orbit contribution (eg2t2g6, L = 0) in case of octahedral high-spin Ni(II) ions.
131 cm−1. However, the spin-free eigenstates are not sufficient to generate an accurate understanding of magnetic properties and, hence, RASSI-SO/SINGLE_ANISO calculations on basis of the CASPT2 wave functions have been performed. As a result, the 3A2g ground state splits into three low-lying magnetic states (0, 9.4, and 10.1 cm−1). The description of these three magnetic states by an effective spin Hamiltonian (Seff = 1) leads to a small positive axial zero-field splitting (ZFS) parameter D of 9.72 cm−1 as well as an insignificant rhombic ZFS parameter E = 0.37 cm−1 (see Table 2). Thus, an easy-plane anisotropy with a MS = 0 ground state can be assumed. Moreover, the observed low-temperature hysteresis in case of 2-Ni (see Fig. 5) is not based on single-ion anisotropy. The corresponding small g values (Seff = 1, see Table 2) are a result of the lack of spin–orbit contribution (eg2t2g6, L = 0) in case of octahedral high-spin Ni(II) ions.
| 2-Ni (single crystal) | 2-Co (Rietveld) | |
|---|---|---|
| S eff | 1 | 3/2 |
| D/cm−1 | 9.72 | 122.85 |
| E/cm−1 | 0.37 | 24.61 |
| E/D | 0.04 | 0.20 |
| g x | 2.285 | 3.043 |
| g y | 2.279 | 2.006 |
| g z | 2.211 | 1.806 |
Nevertheless, the N4S2 octahedral coordination sphere leads to a slight anisotropy due to the different electronic influence of N and S donor atoms. The main anisotropy axes in 2-Ni are depicted in Fig. 9. Both easy-axes of a single Ni(II) ion are oriented within the N4 coordination plane (angle between planes: 2.5°). The corresponding hard-axis shows a nearly parallel alignment with the S–S vector of the thiocyanates (angle between both axes: 2.4°). In accordance with the positive ZFS parameter D (easy-plane anisotropy) slightly higher gx and gy as compared to gz are obtained leading to an average g value of 2.26. To improve the single-ion anisotropy in case of 2-Ni it would be necessary to stabilize an easy-axis anisotropy by a stronger axial coordination environment which underlines the importance of the two apical ligands L within the [Ni(NCS)4(L)2] repeating unit. Nevertheless, only a few mononuclear octahedral Ni(II) complexes with slow magnetic relaxation have been reported in literature.30 Thus, the task of generating a strong axial coordination environment for octahedral Ni(II) ions is expected to be challenging.
In case of 2-Co a 4T1g ground multiplet is obtained as expected for high-spin octahedral Co(II) ions (electronic configuration: [Ar] 3d7 with S = 3/2). However, as it can be seen from the CASSCF and CASPT2 relative energies in Table S5 of the ESI† both methods show a lifting of degeneracy based on the deviation of the N4S2 coordination sphere from the ideal octahedral arrangement which is evident from continuous shape measures (2-Co: S(Oh) = 1.690, 2-Ni: S(Oh) = 0.942).31 For 2-Co the RASSI-SO/SINGLE_ANISO calculations lead to a further splitting of the 4T1g term into three multiplets (J = 1/2, 3/2, 5/2) forming 6 KDs due to spin–orbit coupling (eg2t2g5, L ≠ 0). However, even at room temperature only the lowest two KDs (0 and 260 cm−1) are expected to be thermally populated due to the relative energies of the higher KD states (see Table S6 in the ESI†). Furthermore, the low-temperature magnetic properties can be described within an effective spin formalism of Seff = 1/2 and are only based on the ground state KD. The latter one shows an easy-axis anisotropy (gz > gx, gy) with a distinct gz value (7.199), whereas smaller transversal g factors are obtained (gx = 2.498, gy = 2.900). The corresponding axes of magnetization are depicted in Fig. 10. The easy-axis is located within the N4 coordination plane and tilted with respect to the N–N vector of the two apical pyridine-based co-ligands by an angle of 28.4°. The hard-plane shows a similar distortion from the N2S2 coordination plane formed by the four thiocyanate ligands (angle between planes: 30.8°). In contrast, the first excited KD of 2-Co shows an easy-plane anisotropy (gx = 3.146, gy = 2.413, gz = 0.111, Fig. S33 in the ESI†) with an almost parallel alignment of the easy-plane compared to the N4 coordination plane (angle between planes: 6.7°). Thus, within an effective spin formalism of Seff = 3/2 a positive ZFS parameter D of 122.85 cm−1 together with a significant rhombic distortion E = 24.61 cm−1 is obtained (see Table 2). The corresponding main anisotropy axes are depicted in Fig. S34 in the ESI.† Although the large separation of the two lowest KDs indicates a rather high barrier for the thermal Orbach process (260 cm−1), no hysteresis could be observed (see Fig. 5). This can be attributed to a large averaged dipole transition matrix element for the ground KD (![[small mu, Greek, macron]](https://www.rsc.org/images/entities/i_char_e0cd.gif) z = 0.900, see Fig. S35 in the ESI†) which leads to a significant quantum tunneling of magnetization.
z = 0.900, see Fig. S35 in the ESI†) which leads to a significant quantum tunneling of magnetization.
Conclusions
In the present contribution two new layered thiocyanate compounds based on ethylisonicotinate were presented, which show the same topology of the layers as [Co(NCS)2(4-acetylpyridine)2]n which was recently reported. In the magnetic measurements of the Ni compound a ferromagnetic transition is observed, whereas the magnetic measurements down to 1.8 K of the Co compound, despite the fact that both compounds are isotypic and similar interlayer distances are observed, only indicate paramagnetic behavior. However, specific heat measurements on 2-Co showed a transition at very low temperatures, indicating that the magnetic exchange of the Co compound is weaker than that in the Ni compound, which is reasonable because similar experimental observations were made in literature.2a Redetermination of the magnetic properties of [Co(NCS)2(4-acetylpyridine)2]n prove, that even this compound order ferromagnetically. The intra-layer magnetic coupling was investigated by CDFT calculations employing dinuclear fragments and confirmed the ferromagnetic ordering in case of 2-Ni. The calculated exchange constants were supported by QMC simulations of the susceptibility. For 2-Co similar calculations were performed but because of the low precision of the structural model obtained by the Rietveld refinement the exchange is wrongly predicted and unrealistic J values are obtained. However, ab initio calculations revealed an MS = 0 ground state in case of 2-Ni. In contrast, for 2-Co a ground state with easy-axis anisotropy was found. However, the calculations also revealed a significant rhombic ZFS parameter E which can lead to a significant quantum tunneling of magnetization. Due to a similar coordination environment for the metal centers in 2-Ni and 2-Co the distinct differences in their single-ion anisotropy can be directly related to the varying contributions of spin–orbit coupling.Summarizing, our investigations have shown that the combination of experimental results and theory seems to be a powerful tool to understand the magnetic properties of coordination compounds in more detail. Independent of that, to prove that ferromagnetic exchange is typical for this kind of layer topology, similar compounds must be investigated and this will be the subject of further investigations.
Acknowledgements
This project was supported by the Deutsche Forschungsgemeinschaft (Project No. Na 720/5-1) and the State of Schleswig-Holstein. We thank Prof. Dr Wolfgang Bensch for access to his experimental facilities. MR thanks for support of National Science Centre Poland (2011/01/B/ST3/00436) and support of European Regional Development Fund within the Polish Innovation Economy Operational Program (POIG.02.01.00-12-023/08). LSG thanks Christine Stefani for the support with the XRPD measurements.References
- (a) J. M. Clemente-Juan, E. Coronado and A. Gaita-Arino, Chem. Soc. Rev., 2012, 41, 7464–7478 RSC; (b) J. S. Miller, Chem. Soc. Rev., 2011, 40, 3266–3296 RSC; (c) J. S. Miller and D. Gatteschi, Chem. Soc. Rev., 2011, 40, 3065–3066 RSC; (d) S. Sanvito, Chem. Soc. Rev., 2011, 40, 3336–3355 RSC; (e) D. R. Talham and M. W. Meisel, Chem. Soc. Rev., 2011, 40, 3356–3365 RSC; (f) C. Train, M. Gruselle and M. Verdaguer, Chem. Soc. Rev., 2011, 40, 3297–3312 RSC; (g) X. Y. Wang, C. Avendano and K. R. Dunbar, Chem. Soc. Rev., 2011, 40, 3213–3238 RSC; (h) D.-F. Weng, Z.-M. Wang and S. Gao, Chem. Soc. Rev., 2011, 40, 3157–3181 RSC; (i) Y. Z. Zheng, G. J. Zhou, Z. Zheng and R. E. P. Winpenny, Chem. Soc. Rev., 2014, 43, 1462–1475 RSC; (j) M. Atanasov, D. Aravena, E. Suturina, E. Bill, D. Maganas and F. Neese, Coord. Chem. Rev., 2015, 289–290, 177–214 CrossRef CAS; (k) A. Caneschi, D. Gatteschi and F. Totti, Coord. Chem. Rev., 2015, 289–290, 357–378 CrossRef CAS; (l) K. Liu, W. Shi and P. Cheng, Coord. Chem. Rev., 2015, 289–290, 74–122 CrossRef CAS; (m) J. Mroziński, Coord. Chem. Rev., 2005, 249, 2534–2548 CrossRef; (n) S. Dhers, H. L. C. Feltham and S. Brooker, Coord. Chem. Rev., 2015, 296, 24–44 CrossRef CAS; (o) C. Näther, S. Wöhlert, J. Boeckmann, M. Wriedt and I. Jeß, Z. Anorg. Allg. Chem., 2013, 639, 2696–2714 CrossRef; (p) R. Lescouëzec, L. M. Toma, J. Vaissermann, M. Verdaguer, F. S. Delgado, C. Ruiz-Pérez, F. Lloret and M. Julve, Coord. Chem. Rev., 2005, 249, 2691–2729 CrossRef; (q) C. J. Adams, M. C. Muñoz, R. E. Waddington and J. A. Real, Inorg. Chem., 2011, 50, 10633–10642 CrossRef CAS PubMed; (r) C. Coulon, V. Pianet, M. Urdampilleta and R. Clérac, in Single-Chain Magnets and Related Systems, ed. S. Gao, Springer, Berlin, Heidelberg, 2015, vol. 164, pp. 143–184 Search PubMed.
- (a) J. Palion-Gazda, B. Machura, F. Lloret and M. Julve, Cryst. Growth Des., 2015, 15, 2380–2388 CrossRef CAS; (b) F. A. Mautner, M. Scherzer, C. Berger, R. C. Fischer, R. Vicente and S. S. Massoud, Polyhedron, 2015, 85, 20–26 CrossRef CAS; (c) R. Uhrecký, I. Ondrejkovičová, D. Lacková, Z. Fáberová, J. Mroziński, B. Kalińska, Z. Padělková and M. Koman, Inorg. Chim. Acta, 2014, 414, 33–38 CrossRef; (d) S. S. Massoud, M. Dubin, A. E. Guilbeau, M. Spell, R. Vicente, P. Wilfling, R. C. Fischer and F. A. Mautner, Polyhedron, 2014, 78, 135–140 CrossRef CAS; (e) E. Shurdha, C. E. Moore, A. L. Rheingold, S. H. Lapidus, P. W. Stephens, A. M. Arif and J. S. Miller, Inorg. Chem., 2013, 52, 10583–10594 CrossRef CAS PubMed; (f) S. S. Massoud, A. E. Guilbeau, H. T. Luong, R. Vicente, J. H. Albering, R. C. Fischer and F. A. Mautner, Polyhedron, 2013, 54, 26–33 CrossRef CAS; (g) B. Machura, A. Świtlicka, P. Zwoliński, J. Mroziński, B. Kalińska and R. Kruszynski, J. Solid State Chem., 2013, 197, 218–227 CrossRef CAS; (h) S. Wöhlert, M. Wriedt, T. Fic, Z. Tomkowicz, W. Haase and C. Näther, Inorg. Chem., 2013, 52, 1061–1068 CrossRef PubMed; (i) J. Boeckmann and C. Näther, Chem. Commun., 2011, 47, 7104–7106 RSC; (j) B. Machura, A. Świtlicka, J. Mroziński, B. Kalińska and R. Kruszynski, Polyhedron, 2013, 52, 1276–1286 CrossRef CAS; (k) E. Shurdha, S. H. Lapidus, P. W. Stephens, C. E. Moore, A. L. Rheingold and J. S. Miller, Inorg. Chem., 2012, 51, 9655–9665 CrossRef CAS PubMed; (l) J. G. Małecki, T. Groń and H. Duda, Polyhedron, 2012, 36, 56–68 CrossRef; (m) J. Boeckmann, M. Wriedt and C. Näther, Chem. – Eur. J., 2012, 18, 5284–5289 CrossRef CAS PubMed.
- (a) J. Werner, Z. Tomkowicz, M. Rams, S. G. Ebbinghaus, T. Neumann and C. Näther, Dalton Trans., 2015, 14149–14158 RSC; (b) J. Werner, M. Rams, Z. Tomkowicz and C. Näther, Dalton Trans., 2014, 43, 17333–17342 RSC; (c) S. Wöhlert, Z. Tomkowicz, M. Rams, S. G. Ebbinghaus, L. Fink, M. U. Schmidt and C. Näther, Inorg. Chem., 2014, 53, 8298–8310 CrossRef PubMed; (d) S. Wöhlert, T. Fic, Z. Tomkowicz, S. G. Ebbinghaus, M. Rams, W. Haase and C. Näther, Inorg. Chem., 2013, 52, 12947–12957 CrossRef PubMed; (e) S. Wöhlert, J. Boeckmann, M. Wriedt and C. Näther, Angew. Chem., Int. Ed., 2011, 50, 6920–6923 CrossRef PubMed; (f) S. Wöhlert, U. Ruschewitz and C. Näther, Cryst. Growth Des., 2012, 12, 2715–2718 CrossRef.
- (a) S. Wöhlert, L. Fink, M. Schmidt and C. Näther, CrystEngComm, 2013, 15, 945–957 RSC; (b) S. Wöhlert, L. Peters and C. Näther, Dalton Trans., 2013, 42, 10746–10758 RSC; (c) J. Werner, Z. Tomkowicz, T. Reinert and C. Näther, Eur. J. Inorg. Chem., 2015, 3066–3075 CrossRef CAS.
- J. Werner, M. Rams, Z. Tomkowicz, T. Runčevski, R. E. Dinnebier, S. Suckert and C. Näther, Inorg. Chem., 2015, 54, 2893–2901 CrossRef CAS PubMed.
- (a) X.-L. Feng and Y.-P. Zhang, Acta Crystallogr., Sect. E: Struct. Rep. Online, 2012, 68, m786 CAS; (b) S. M. Soliman, Z. B. Elzawy, M. A. M. Abu-Youssef, J. Albering, K. Gatterer, L. Ohrstrom and S. F. A. Kettle, Acta Crystallogr., Sect. B: Struct. Sci., 2014, 70, 115–125 CAS.
- M. A. S. Goher, Q.-C. Yang and T. C. W. Mak, Polyhedron, 2000, 19, 615–621 CrossRef CAS.
- (a) A. Escuer, R. Vicente, M. A. S. Goher and F. A. Mautner, Inorg. Chem., 1996, 35, 6386–6391 CrossRef CAS PubMed; (b) M. S. Goher and F. Mautner, Transition Met. Chem., 1999, 24, 454–458 CrossRef CAS.
- (a) X-Red, Version 1.11, Program for Data Reduction and Absorption Correction, STOE & CIE GmbH, Darmstadt, Germany, 1998 Search PubMed; (b) X-Shape, Version 1.03, Program for the Crystal Optimization for Numerical Absorption Correction, STOE & CIE GmbH, Darmstadt, Germany, 1998 Search PubMed; (c) X-Area, Version 1.44, Program Package for Single Crystal Measurements, STOE & CIE GmbH, Darmstadt, Germany, 2008 Search PubMed.
- G. Sheldrick, Acta Crystallogr., Sect. A: Fundam. Crystallogr., 2015, 71, 3–8 CrossRef PubMed.
- G. Sheldrick, Acta Crystallogr., Sect. C: Cryst. Struct. Commun., 2015, 71, 3–8 CrossRef PubMed.
- H. M. Rietveld, J. Appl. Crystallogr., 1969, 2, 65–71 CrossRef CAS.
- A. X. S. Bruker in TOPAS, Vol. 2014 Search PubMed.
- TURBOMOLE V6.6 2014, a development of University of Karlsruhe and Forschungszentrum Karlsruhe GmbH, 1989–2007, TURBOMOLE GmbH, since 2007 (available fromhttp://www.turbomole.com).
- (a) E. J. Baerends, D. E. Ellis and P. Ros, Chem. Phys., 1973, 2, 41–51 CrossRef CAS; (b) B. I. Dunlap, J. W. D. Connolly and J. R. Sabin, J. Chem. Phys., 1979, 71, 3396–3402 CrossRef CAS; (c) C. Van Alsenoy, J. Comput. Chem., 1988, 9, 620–626 CrossRef CAS.
- (a) A. D. Becke, Phys. Rev. A, 1988, 38, 3098–3100 CrossRef CAS; (b) J. P. Perdew, Phys. Rev. B: Condens. Matter, 1986, 33, 8822–8824 CrossRef.
- F. Weigend and R. Ahlrichs, Phys. Chem. Chem. Phys., 2005, 7, 3297–3305 RSC.
- (a) P. H. Dederichs, S. Blügel, R. Zeller and H. Akai, Phys. Rev. Lett., 1984, 53, 2512–2515 CrossRef CAS; (b) Q. Wu and T. V. Voorhis, Phys. Rev. A, 2005, 72, 024502 CrossRef.
- (a) A. D. Becke, J. Chem. Phys., 1993, 98, 5648–5652 CrossRef CAS; (b) C. Lee, W. Yang and R. G. Parr, Phys. Rev. B: Condens. Matter, 1988, 37, 785 CrossRef CAS.
- M. Valiev, E. J. Bylaska, N. Govind, K. Kowalski, T. P. Straatsma, H. J. J. V. Dam, D. Wang, J. Nieplocha, E. Apra, T. L. Windus and W. A. de Jong, Comput. Phys. Commun., 2010, 181, 1477–1489 CrossRef CAS.
- (a) F. Aquilante, J. Autschbach, R. K. Carlson, L. F. Chibotaru, M. G. Delcey, L. D. Vico, I. F. Galván, N. Ferré, L. M. Frutos, L. Gagliardi, M. Garavelli, A. Giussani, C. E. Hoyer, G. L. Manni, H. Lischka, D. Ma, P. Å. Malmqvist, T. Müller, A. Nenov, M. Olivucci, T. B. Pedersen, D. Peng, F. Plasser, B. Pritchard, M. Reiher, I. Rivalta, I. Schapiro, J. Segarra-Martí, M. Stenrup, D. G. Truhlar, L. Ungur, A. Valentini, S. Vancoillie, V. Veryazov, V. P. Vysotskiy, O. Weingart, F. Zapata and R. Lindh, J. Comput. Chem., 2015, 37, 506–541 CrossRef PubMed; (b) F. Aquilante, L. D. Vico, N. Ferré, G. Ghigo, P.-Å. Malmqvist, P. Neogrády, T. B. Pedersen, M. Pitoňák, M. Reiher, B. O. Roos, L. Serrano-Andrés, M. Urban, V. Veryazov and R. Lindh, J. Comput. Chem., 2010, 31, 224–247 CrossRef CAS PubMed; (c) G. Karlström, R. Lindh, P.-A. Malmqvist, B. O. Roos, U. Ryde, V. Veryazov, P.-O. Widmark, M. Cossi, B. Schimmelpfennig, P. Neogrady and L. Seijo, Comput. Mater. Sci., 2003, 28, 222–239 CrossRef; (d) V. Veryazov, P.-O. Widmark, L. Serrano-Andres, R. Lindh and B. O. Roos, Int. J. Quantum Chem., 2004, 100, 626–635 CrossRef CAS.
- (a) B. O. Roos, R. Lindh, P.-Å. Malmqvist, V. Veryazov and P.-O. Widmark, J. Phys. Chem. A, 2004, 108, 2851–2858 CrossRef CAS; (b) B. O. Roos, R. Lindh, P.-Å. Malmqvist, V. Veryazov and P.-O. Widmark, J. Phys. Chem. A, 2005, 109, 6575–6579 CrossRef CAS PubMed; (c) P.-O. Widmark, P.-Å. Malmqvist and B. O. Roos, Theor. Chim. Acta, 1990, 77, 291–306 CrossRef CAS.
- C. Näther and I. Jeß, J. Solid State Chem., 2002, 169, 103–112 CrossRef.
- (a) F. Lloret, M. Julve, J. Cano, R. Ruiz-García and E. Pardo, Inorg. Chim. Acta, 2008, 361, 3432–3445 CrossRef CAS; (b) J. Werner, T. Runčevski, R. Dinnebier, S. G. Ebbinghaus, S. Suckert and C. Näther, Eur. J. Inorg. Chem., 2015, 3236–3245 CrossRef CAS; (c) S. Ziegenbalg, D. Hornig, H. Görls and W. Plass, Inorg. Chem., 2015, 55, 4047–4058 CrossRef PubMed.
- (a) B. Nowicka, M. Reczynski, M. Rams, W. Nitek, J. Zukrowski, C. Kapusta and B. Sieklucka, Chem. Commun., 2015, 51, 11485–11488 RSC; (b) Z. Tomkowicz, S. Ostrovsky, H. Müller-Bunz, A. J. H. Eltmimi, M. Rams, D. A. Brown and W. Haase, Inorg. Chem., 2008, 47, 6956–6963 CrossRef CAS PubMed.
- J. Boeckmann and C. Näther, Polyhedron, 2012, 31, 587–595 CrossRef CAS.
- T. Rojo, R. Cortes, L. Lezama, M. I. Arriortua, K. Urtiaga and G. Villeneuve, J. Chem. Soc., Dalton Trans., 1991, 1779–1783 RSC.
- (a) S. Todo and K. Kato, Phys. Rev. Lett., 2001, 87, 047203 CrossRef CAS PubMed; (b) A. F. Albuquerque, F. Alet, P. Corboz, P. Dayal, A. Feiguin, S. Fuchs, L. Gamper, E. Gull, S. Gürtler, A. Honecker, R. Igarashi, M. Körner, A. Kozhevnikov, A. Läuchli, S. R. Manmana, M. Matsumoto, I. P. McCulloch, F. Michel, R. M. Noack, G. Pawłowski, L. Pollet, T. Pruschke, U. Schollwöck, S. Todo, S. Trebst, M. Troyer, P. Werner and S. Wessel, J. Magn. Magn. Mater., 2007, 310, 1187–1193 CrossRef CAS; (c) B. Bauer, L. D. Carr, H. G. Evertz, A. Feiguin, J. Freire, S. Fuchs, L. Gamper, J. Gukelberger, E. Gull, S. Guertler, A. Hehn, R. Igarashi, S. V. Isakov, D. Koop, P. N. Ma, P. Mates, H. Matsuo, O. Parcollet, G. Pawłowski, J. D. Picon, L. Pollet, E. Santos, V. W. Scarola, U. Schollwöck, C. Silva, B. Surer, S. Todo, S. Trebst, M. Troyer, M. L. Wall, P. Werner and S. Wessel, J. Stat. Mech., 2011, 2011, P05001 Search PubMed.
- N. D. Mermin and H. Wagner, Phys. Rev. Lett., 1966, 17, 1133–1136 CrossRef CAS.
- (a) J. Miklovic, D. Valigura, R. Boca and J. Titis, Dalton Trans., 2015, 44, 12484–12487 RSC; (b) G. Rogez, J.-N. Rebilly, A.-L. Barra, L. Sorace, G. Blondin, N. Kirchner, M. Duran, J. van Slageren, S. Parsons, L. Ricard, A. Marvilliers and T. Mallah, Angew. Chem., Int. Ed., 2005, 44, 1876–1879 CrossRef CAS PubMed.
- (a) M. Pinsky and D. Avnir, Inorg. Chem., 1998, 37, 5575–5582 CrossRef CAS PubMed; (b) H. Zabrodsky, S. Peleg and D. Avnir, IEEE Trans. Pattern Anal. Mach. Intell., 1995, 17, 1154–1166 CrossRef.
Footnote |
| † Electronic supplementary information (ESI) available. CCDC 1506855 and 1506856. For ESI and crystallographic data in CIF or other electronic format see DOI: 10.1039/c6dt03752f |
| This journal is © The Royal Society of Chemistry 2016 |

