 Open Access Article
Creative Commons Attribution 3.0 Unported Licence
Structural and electronic trends for five coordinate 1st row transition metal complexes: Mn(II) to Zn(II) captured in a bis(iminopyridine) framework†
Titel
Jurca
a,
Sarah
Ouanounou
a,
Wei-Chih
Shih
b,
Tiow-Gan
Ong
b,
Glenn P. A.
Yap
c,
Ilia
Korobkov
a,
Serge
Gorelsky
*a and
Darrin
Richeson
*a
aDepartment of Chemistry and Biomolecular Sciences, Center for Catalysis Research and Innovation, University of Ottawa, Ottawa, Ontario K1N 6N5, Canada. E-mail: darrrin@uottawa.ca
bInstitute of Chemistry, Academia Sinica, Taipei, Taiwan
cDepartment of Chemistry & Biochemistry, 236 Brown Laboratory, University of Delaware, Newark, DE 19716, USA
First published on 8th August 2016
Abstract
The preparation and characterization of a series of divalent 3d transition metal complexes supported by a tridentate planar bis(iminopyridine) ligand are reported. The complexes {2,6-[PhC![[double bond, length as m-dash]](https://www.rsc.org/images/entities/char_e001.gif) N(tBu2C6H3)]2C5H3N}MBr2 (M = Mn, Fe, Co, Ni, Cu, Zn), 1–6, were characterized by single crystal X-ray structural studies revealing complexes with pentacoordinate distorted square pyramidal coordination environments. This assembly of complexes provided a unique array for examining the relationship between experimental structure and computed electronic structure. While experimental structural features basically correlated with the Irving–Williams series, some clear deviations were rationalized through the computational analysis. A balance of bis(imino)pyridine/metal with bonding/antibonding π interactions was used to explain the divergent directions of Fe(II)–N and Co(II)–N bond lengths. Similarly, orbital details were used to justify the opposing change in Cu–Brap and Cu–Brbas bond lengths. Furthermore, computational analysis provided a unique method to document a surprising low bond order for the M–N bonds of bis(imino)pyridine ligand in this series.
N(tBu2C6H3)]2C5H3N}MBr2 (M = Mn, Fe, Co, Ni, Cu, Zn), 1–6, were characterized by single crystal X-ray structural studies revealing complexes with pentacoordinate distorted square pyramidal coordination environments. This assembly of complexes provided a unique array for examining the relationship between experimental structure and computed electronic structure. While experimental structural features basically correlated with the Irving–Williams series, some clear deviations were rationalized through the computational analysis. A balance of bis(imino)pyridine/metal with bonding/antibonding π interactions was used to explain the divergent directions of Fe(II)–N and Co(II)–N bond lengths. Similarly, orbital details were used to justify the opposing change in Cu–Brap and Cu–Brbas bond lengths. Furthermore, computational analysis provided a unique method to document a surprising low bond order for the M–N bonds of bis(imino)pyridine ligand in this series.
Introduction
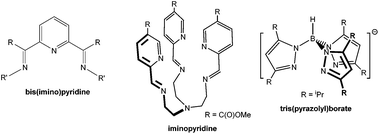
Bis(imino)pyridines, 2,6-[(RC![[double bond, length as m-dash]](https://www.rsc.org/images/entities/char_e001.gif) N(R′))]2C5H3N (Scheme 1), are a well-known family of tridentate “NNN” neutral pincer ligands that have diverse applications in coordination chemistry and have been used to generate fundamentally significant transition metal and main group metal compounds.1,2 They are amenable to modular synthetic approaches thus providing steric and electronic tunability and offer coordination modes that can promote formation of anisotropic complexes. These pincer frameworks have been characterized as redox-active non-innocent species and have been extensively explored and harnessed as electron-reservoirs in catalytic applications3–17 in addition to their pioneering role in olefin polymerization catalysis.18,19
N(R′))]2C5H3N (Scheme 1), are a well-known family of tridentate “NNN” neutral pincer ligands that have diverse applications in coordination chemistry and have been used to generate fundamentally significant transition metal and main group metal compounds.1,2 They are amenable to modular synthetic approaches thus providing steric and electronic tunability and offer coordination modes that can promote formation of anisotropic complexes. These pincer frameworks have been characterized as redox-active non-innocent species and have been extensively explored and harnessed as electron-reservoirs in catalytic applications3–17 in addition to their pioneering role in olefin polymerization catalysis.18,19
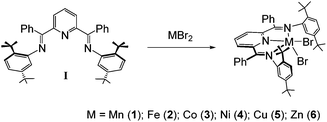
Our interest in the structural directing features of bis(imino)pyridine ligands was initially stimulated by their now documented potential to support main group and late transition metal species with notable bonding features as well as their potential to direct the formation of novel magnetic properties in first-row transition metal complexes.20–26 Structural perturbation, through modification of ligand substituents that do not directly interact with the bound metal center, make up part of these explorations. Our interest in this structure determining role led to targeting ligands with imine moieties displaying C–Ph and N(tBu2C6H3) substituents, I. In these efforts, computational analysis continues to play a critical role by providing not only support for the experimental results but ultimately revealing the in-depth bonding and electronic features that would otherwise simply be overlooked.
Since bis(imino)pyridine ligands are redox non-innocent ligands, viewing these species as neutral, coordinated ligands in transition metal compounds, and assigning appropriate oxidation state to the central ion is often too simplistic and potentially misleading. A combination of experimental and computational analyses of six coordinate [L2M]x+ (x = 1 or 2), where L represents a bis(imino)pyridine ligand, were used to support the non-innocent nature of this ligand and indicated that in the case of low spin metal centers, these species were better described as having extensively d–π* delocalized structures with the biradical contribution, MIII(L−)2 being significant in many cases.14,15 In contrast there was essentially no electron transfer for the high spin complexes that were modeled. A subsequent computational study of the bis(imino)pyridine ligand assigned two parameters, σL and πL, representing the σ-donor and π-acceptor qualities of these ligands. The results indicated that bis(imino)pyridines in general are only fair σ-donors but exceptionally good π-acceptors.27
Inspired by both the importance and the surprising versatility of this ligand structure as well as our fundamental interests, we undertook a systematic investigation of the structural trends, electronic structure and bonding features of a series of formally divalent first row transition metal complexes supported by one bis(imino)pyridine ligand and displaying a five-coordinate metal geometry, {2,6-[PhC![[double bond, length as m-dash]](https://www.rsc.org/images/entities/char_e001.gif) N(tBu2C6H3)]2C5H3N}MBr2. As we began this study we observed that analogous work had been undertaken utilizing the tripodal iminopyridine ligand framework (Scheme 1).28 In that case, the investigation involved seven divalent 3d transition metal complexes (Cr–Zn) displaying distorted six-coordinate octahedral geometries. The results of this investigation yielded significant information regarding properties of first row six-coordinate transition metal complexes bearing this related ligand system and further motivated our effort. The importance of such investigations reaches beyond a particular ligand set and address fundamental concepts within inorganic chemistry. For example, a similar series of divalent metal thiolate complexes supported by a tris(pyrazolyl)borate ligand, Tp- (Scheme 1) was investigated in a combined experimental/computational study. These four-coordinate, TpMII(SC6F5) (M = Mn, Fe, Co, Ni, Cu, Zn) complexes were analyzed in terms of variations in geometry and bond energies and the corresponding changes in the nature of metal–ligand bonding interactions. This study revealed the compensating roles of covalent contribution to the metal–ligand bonding and the impact of the ionic components to metal–ligand bonding.29
N(tBu2C6H3)]2C5H3N}MBr2. As we began this study we observed that analogous work had been undertaken utilizing the tripodal iminopyridine ligand framework (Scheme 1).28 In that case, the investigation involved seven divalent 3d transition metal complexes (Cr–Zn) displaying distorted six-coordinate octahedral geometries. The results of this investigation yielded significant information regarding properties of first row six-coordinate transition metal complexes bearing this related ligand system and further motivated our effort. The importance of such investigations reaches beyond a particular ligand set and address fundamental concepts within inorganic chemistry. For example, a similar series of divalent metal thiolate complexes supported by a tris(pyrazolyl)borate ligand, Tp- (Scheme 1) was investigated in a combined experimental/computational study. These four-coordinate, TpMII(SC6F5) (M = Mn, Fe, Co, Ni, Cu, Zn) complexes were analyzed in terms of variations in geometry and bond energies and the corresponding changes in the nature of metal–ligand bonding interactions. This study revealed the compensating roles of covalent contribution to the metal–ligand bonding and the impact of the ionic components to metal–ligand bonding.29
Herein we report the preparation, structural comparison, and electronic structure and metal–ligand bonding analysis of a series of five-coordinate, pincer complexes {2,6-[PhC![[double bond, length as m-dash]](https://www.rsc.org/images/entities/char_e001.gif) N(tBu2C6H3)]2C5H3N}MBr2 (M = Mn, Fe, Co, Ni, Cu, Zn). These compounds present a systematic change in the ion size and d-electron count across the series of divalent pentacoordinate first row transition metals. The empirically observed variations in structure and bonding are interpreted in terms of changes in the nature of metal–ligand interactions as revealed through computational analyses.
N(tBu2C6H3)]2C5H3N}MBr2 (M = Mn, Fe, Co, Ni, Cu, Zn). These compounds present a systematic change in the ion size and d-electron count across the series of divalent pentacoordinate first row transition metals. The empirically observed variations in structure and bonding are interpreted in terms of changes in the nature of metal–ligand interactions as revealed through computational analyses.
Results and discussion
The bis(imino)pyridine ligand, I, was synthesized via a conventional acid catalyzed Schiff base condensation of 2,6-dibenzoylpyridine and 2,5-di(t-butyl)aniline. Toluene solutions of I reacted directly with toluene suspensions of MBr2 (M = Mn, Fe, Co, Cu or Zn) powders to yield colored heterogeneous reaction mixtures over several hours. Filtration of these reaction mixtures led to the isolation of the divalent first row transition metal series of complexes {2,6-[PhC![[double bond, length as m-dash]](https://www.rsc.org/images/entities/char_e001.gif) N(tBu2C6H3)]2C5H3N}MBr2 complexes 1–3, 5 and 6 in yields >90% (Scheme 2). In the case of NiBr2, the reaction required heating to 150 °C and multiple recrystallizations to obtain complex 4 in 51% yield. Depending on the particular complex, crystalline compounds could be obtained from chloroform, dichloromethane or chlorobenzene. All six species were characterized by single crystal X-ray analysis, UV-vis and infrared spectroscopy, microanalysis and mass spectrometry. The high-spin d-electron configurations for complexes 1–5 were confirmed by measurement of the room temperature magnetic susceptibilities for the complexes using the Evans method. In the case of the diamagnetic Zn complex, 1H and 13C NMR were used to confirm the product identity. Importantly, there are several early reports of M(II) complexes with M = Mn, Co, Ni, Cu and Zn and employing less bulky bis(imino)pyridine ligands derived from 2,6-diacetylpyridine/aniline with halo and nitrato anionic ligands.30–34 Most of these reports are for single examples of these 2,6-[MeC
N(tBu2C6H3)]2C5H3N}MBr2 complexes 1–3, 5 and 6 in yields >90% (Scheme 2). In the case of NiBr2, the reaction required heating to 150 °C and multiple recrystallizations to obtain complex 4 in 51% yield. Depending on the particular complex, crystalline compounds could be obtained from chloroform, dichloromethane or chlorobenzene. All six species were characterized by single crystal X-ray analysis, UV-vis and infrared spectroscopy, microanalysis and mass spectrometry. The high-spin d-electron configurations for complexes 1–5 were confirmed by measurement of the room temperature magnetic susceptibilities for the complexes using the Evans method. In the case of the diamagnetic Zn complex, 1H and 13C NMR were used to confirm the product identity. Importantly, there are several early reports of M(II) complexes with M = Mn, Co, Ni, Cu and Zn and employing less bulky bis(imino)pyridine ligands derived from 2,6-diacetylpyridine/aniline with halo and nitrato anionic ligands.30–34 Most of these reports are for single examples of these 2,6-[MeC![[double bond, length as m-dash]](https://www.rsc.org/images/entities/char_e001.gif) N(C6H3)]2C5H3NMX2 species.
N(C6H3)]2C5H3NMX2 species.
The results of single crystal X-ray structural analysis for these divalent bis(imino)pyridine species are shown in Fig. 1 with selected structural parameters for discussion being summarized in Fig. 2.
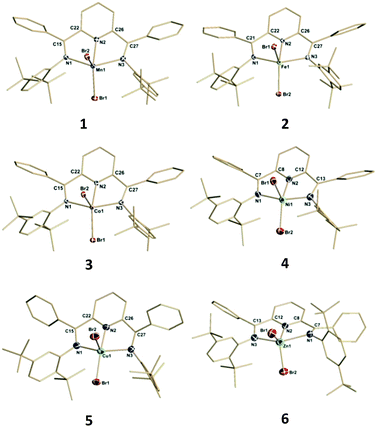 | ||
| Fig. 1 Structural representations of compounds 1–6. Hydrogen atoms, thermal ellipsoids of the ligand carbon atoms and co-crystallized solvents are omitted for clarity. Full structural information can be found in the ESI.† | ||
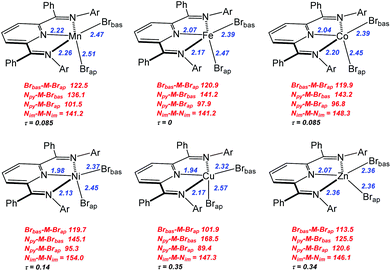 | ||
| Fig. 2 Representations of structures for complexes 1–6. Selected metal-element bond distances in Å (blue) and element-metal-element angles in degrees (red) are provided. The notation Brbas and Brap are described in the text. Full structural details can be found in the ESI.† | ||
Compounds 1–6 exhibited mononuclear, distorted five-coordinate geometries that possessed a metal dibromide unit coordinated by the three coplanar nitrogen atoms of the bis(imino)pyridine ligand. The two common limiting ideal geometries for five coordinate species are trigonal bipyramidal (tbp) and square-based pyramidal (sp) metal environments. Since complexes 1–6 are not homoleptic species, there are expected to be deviations from the ideal geometries. However, even in this situation it is possible to assign approximate tbp or sp metal coordination geometry using a simple quantitative measure derived from simple calculation of structural index parameter, τ.35,36 Additional geometric deviations can arise due to ligand bite angle restrictions or when the M center is displaced out of the ligand plane. Application of this approach to complexes 1–6 yielded τ parameters ranging from 0–0.35 indicating that these complexes adopted coordination geometries that can best be described as distorted square-based pyramidal (sp). Using this formulation, the basal plane was defined by the three nitrogen donors of the bis(imino)pyridine ligand and one of the bromides identified as Brbas. The pseudo-apical position is occupied by the bromo ligand labelled Brap. It should be noted that the central metal atom centers do reside slightly out of the basal plane and toward Brap in all of the structures.
A graphical presentation for the variation of metal ligand bond distances as a function of metal identity was derived from the X-ray structural data and is presented in Fig. 3 and 4. The six compounds 1–6 possess high-spin electronic configurations that range from d5 to d10 which means that each of the d-orbitals is occupied by at least one electron (i.e. each d-orbital is occupied by an α-electron). Beginning with the d6 Fe complex (2), β-electrons are added sequentially to the d-orbitals across the series. Fig. 3 and 4 represent the correlation of the five metal–ligand bond distances with changes in metal ion radius and with metal–ligand bonding variations due to β-electron occupancy of the d-orbitals.
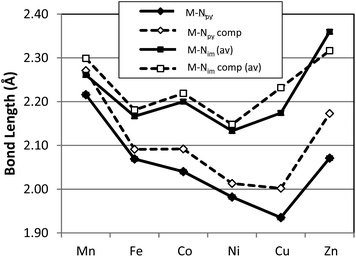
Fig. 3 presents the metal–nitrogen bond distances for complexes 1–6. The first observation is that the bonds between the metal and the imine nitrogen centers, M–Nim (square) are consistently longer than those to the pyridine N center, M–Npy (diamond). The shorter M–Npy distance is consistent with the donation of the lone electron pair from Npy being oriented directly towards the metal center, while the Nim donor pairs are, due to bite angle restrictions, less directly oriented towards the metal center and therefore experience less orbital overlap. The superior overlap between the Npy donor orbital and a metal-center orbital yields the shorter bond.
In the case of M–Npy there is a general decrease in bond length from Mn–Cu which is the expected correlation with decreasing M(II) cation radius across the row, which leads to increases in both covalent and ionic contributions to bonding. The Zn complex (6) breaks this trend and the bond length increases. These measured bond lengths correlate with the increase in complex stability as expected from the Irving–Williams series Mn(II) < Fe(II) < Co(II) < Ni(II) < Cu(II) > Zn(II).37,38 Irving and Williams noted that a plot of the stability constants of complexes of divalent ions of the first transition series versus the atomic number of the metal showed a monotonic increase with a maximum at Cu. This was regardless of the nature of the ligand. The rationalization of this observation involved an increase in both the electrostatic/ionic and covalent interactions that contributed to the stability constants across the series from Mn to Cu. From Cu to Zn there is a decrease in both of these interactions and particularly in the covalency for the d10 Zn center.
In contrast the M–Nim bond length changes are relatively invariant moving along the row and actually show small increases in bond lengths for the complexes of Co (3), Cu (5) and a larger increase in bond length for Zn (6). These observations deviate from the generally observed trends based on the Irving–Williams classification. Interestingly, a similar, albeit opposite, deviation was rationalized for the Co and Cu complexes of TpMII(SC6F5) in terms of a “compensating effect” between the covalent and ionic contributions to metal–thiolate bonding.29
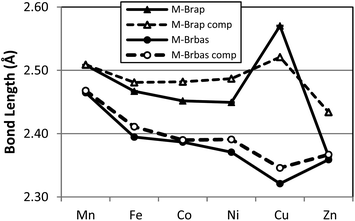
In the case of the two metal–bromide bond lengths (Fig. 4), the pseudo-apical M–Brap (triangle) distance is consistently longer than the distance M–Brbas (circle) in the basal plane, across the period until M = Zn (6) when these two distances are equivalent. Again, the general decrease in M–Brbas bond length from Mn to Cu is consistent with the increasing charge-to-radius ratio for M(II) across the series and there is only a slight increase in Zn–Br bond length.
In terms of the M–Brap distances, the Cu–Brap shows a deviation from the general bond length trends by an increase in bond length. The abrupt increase in Cu–Brap bond distance and increasing difference between the two M–Br distances for complex 5 is consistent with addition of the β-electron to fill the Cu–Brap σ* (e.g. dz2) orbital for the Cu2+ d9 configuration.
In order to provide a more comprehensive analysis of the metal ligand bonding in 1–6 a DFT computational study was carried out using the B3LYP functional and TZVP basis set. Beginning from the crystallographically determined structures, electronic structure optimization employing the full molecular structures was carried out for all six compounds. A graphical comparison of the computed bond lengths for M–Npy, M–Nim, M–Brap and M–Brbas with the corresponding experimental parameters is provided in Fig. 3 and 4 which demonstates that the computed bond parameters were in excellent agreement with experiment both in magnitude as well as in the observed periodic variations.
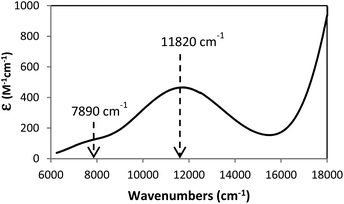
The excellent correlation between experimental and computational structural features and the fact that the computations mirrored the metal–ligand bonding trends of the Cu complex (5) prompted an application of spectroscopic characterization in order to provide additional experimental support for our theoretical probe of the metal–ligand covalency. Therefore, we carried out a time-dependent DFT (TD-DFT) analysis of 5 and this reproduced the major features of the observed NIR-UV solution spectrum with the results presented in Fig. 5. Correlation of the solid state and solution UV-visible spectra is shown in ESI (Fig. S7†) and indicated that the single crystal X-ray structure was maintained in solution. The agreement between experimental and TD-DFT-computed spectra substantiated the orbital character associated with the observed absorbances. Specifically, we correlated the weak absorbance at approximately 7900 cm−1 with the computed, weak oscillator strength absorbance at 6200 cm−1 which corresponded to the HOMO−1 to LUMO transition in 5 (represented in Fig. S8 and S9†) Furthermore, the computations provided an absorbance at 10![[thin space (1/6-em)]](https://www.rsc.org/images/entities/char_2009.gif) 000 cm−1 (experimental value 11
000 cm−1 (experimental value 11![[thin space (1/6-em)]](https://www.rsc.org/images/entities/char_2009.gif) 820 cm−1) which corresponded principally to a HOMO−5 to LUMO (Fig. S8 and S10†) transition, an LMCT band.
820 cm−1) which corresponded principally to a HOMO−5 to LUMO (Fig. S8 and S10†) transition, an LMCT band.
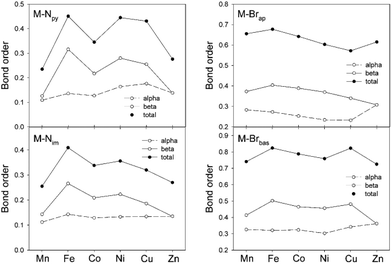
Having successfully modeled the experimental features of compound 1–6, the more intimate details for the covalent components of the metal–ligand bonding can be explored. An examination of the NPA spin density indicated that the majority of the density is on the metal center (≥90%). The next largest density contribution (2–7%) is localized on the Br ligands. This supports our analysis of these compounds as M(II) species. The computational analysis provided the Mayer bond order for each of the four different metal–ligand interactions, M–Npy, M–Nim, M–Brap and M–Brbas, and these are shown in Fig. 6. The overall bond order is further resolved into contributions from the d-orbital occupancy for the α- and β-electrons to the overall bond order. For the three ligand sites which lie in the basal plane of these distorted pyramidal complexes, M–Npy, M–Nim and M–Brbas, the variations in bond order across the period are dominated by the β component of the d-orbital occupancy. This is consistent with the fact that the α-electron population is constant from d5 Mn to d10 Zn.
One of the notable points observed in Fig. 6 is the low degree of covalency for M–Npy and M–Nim with average bond orders of less than 0.4. For the M–Npy bond, there is only a small uneven increase in bond order from Mn to Cu with a decrease at Zn. The decrease in both bond order and increase in length for Zn is consistent with the formation of the d10 metal. In contrast the bond orders for the apical and basal M–Br interactions, M–Brap and M–Brbas, on first inspection are larger and less variant than M–N bond orders across the row from Mn to Zn. However, it is important to note that the larger bond order values arise from the fact that the bromo ligands display both σ and π donation to the metal centers and when this feature is considered, the overall bond order is, in fact, also rather low with average total values of only 0.6 for M–Brap and 0.8 for M–Brbas. In general the bond orders for M–Brbas are larger than for M–Brap which is a feature that is consistent with both the experimental and computational data in Fig. 4.
The Mayer bond orders obtained for the M–Nim moieties correlate with our observed bond length variations. Namely an increase in Co–Nim, Cu–Nim and Zn–Nim bond lengths. Furthermore this correlation is mirrored by the contribution of the β-electron to the bond order. Similarly, the increase in Cu–Brap bond distance has a corresponding decrease in bond order but in this case arising from both α and β occupancy.
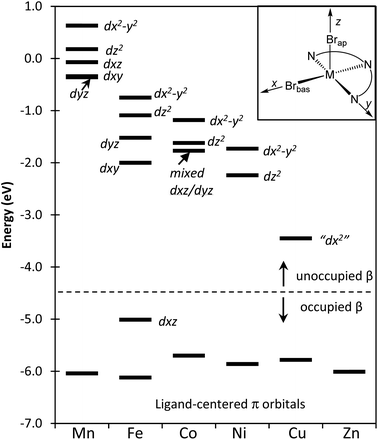
The more precise effects on the frontier orbitals due to the addition of the β-electrons to the d-orbitals of complexes 1–6 is presented in a correlation diagram given in Fig. 7. The resulting influence on metal–ligand bond variations can be analyzed by considering a balance of the bonding and antibonding contributions to these orbitals as well as the increasing level of metal/ligand orbital mixing across this series. Our subjective orientation chosen for the assignment of the orbital labels is shown as an inset in the upper right of Fig. 7.
In the case of the Mn(II) complex 1, the β-electrons are absent from the d-orbitals and due to the small degree of orbital mixing in this compound the first five unoccupied orbitals appear to be essentially metal centered d-orbitals. The relative energies of these five orbitals are as anticipated for the d-orbital splitting diagram of a square pyramidal ligand array. Moving across the row from the Fe(II) complex 2 to the Cu(II) species 6, there is an increase in d-orbital/ligand orbital mixing corresponding to the increase in metal–ligand covalency. For 2, the first β-electron is added to a d-orbital of π symmetry involving predominantly Fe–Npy and Fe–Nim back donation (i.e. dxz and represented in Fig. S11 of the ESI†). This leads to the observed shorter bond as seen in Fig. 3 and higher bond order shown in Fig. 6 for this metal–ligand interaction. As the β orbitals become filled, they move from the unoccupied region of the diagram to the occupied area and this is shown explicitly in Fig. 7 for the case of the Fe compound. Moving to the Co(II) complex (3), the added β electron occupies a π* orbital that is Co–N localized and results in a decrease in Co–N bond order. This effect is reflected in the Co–N distances of Fig. 3 and the Co–N bond orders shown in Fig. 6. The β-electron that is added moving from the Co (3) to the Ni (4) compounds resides in what is predominantly a metal-centered, d-orbital with little mixing with either the Br or N ligand centers and as a result has only small effects on metal/ligand bonding.
After adding the β-electron for Ni complex 4, the next two half-occupied (by α electrons) orbitals are predominantly σ* metal–ligand orbitals (represented in Fig. S12 and S13 in ESI†). In the move from the Ni of the Cu complex (5) the β-electron is added to the orbital that is oriented on the z-axis and predominantly displays a σ* interaction with Brap with little contribution to the four ligand centers in the basal xy plane. The most significant manifestation of adding the β-electron to this orbital is to lengthen Cu–Brap bond length as seen in Fig. 4 and 6. The final remaining empty β-electron orbital is along the arbitrarily selected molecular x-axis as defined in Fig. 7 (represented in Fig. S8 of the ESI†). This unoccupied orbital has the appearance of a dz2 orbital and we have therefore labelled it as “dx2”. This orbital is σ* with the ligands in the xy plane. The final β-electron is added for the Zn complex 6, and leads to a decrease in bond order and lengthening of all of the ligand centers that lie in the basal plane; Zn–Npy, Zn–Nim, Zn–Brbas. This orbital is a σ* orbital to these four sites.
Experimental
General methods
Reactions were performed in a glovebox with a nitrogen atmosphere or using Schlenk techniques. Solvents were sparged with nitrogen and then dried by passage through a column of activated alumina using an apparatus purchased from Anhydrous Engineering. Deuterated chloroform was dried using activated molecular sieves. Metal bromides were purchased from Strem Chemicals and used as received. All other chemicals were purchased from Aldrich and used without further purification. The bis(imino)pyridine ligand (I) was synthesized according to literature procedure.39 NMR spectra were acquired on a Bruker Avance 300 MHz spectrometer with CD2Cl2, and CDCl3 as solvents and internal standards. Elemental analyses were performed by Midwest Microlab LLC, Indianapolis IN. Mass spectrometry (MS) was obtained at the University of Ottawa using TOF MS ES on a Micromass-Q TOF II. m/z values are ranked by a bracketed number in order of decreasing intensity. Infrared spectra were measured on powder samples using a Cary 630 FT-IR. Magnetic moments of compounds 1–5 were determined using the Evans method.40,41![[thin space (1/6-em)]](https://www.rsc.org/images/entities/char_2009.gif) :
:![[thin space (1/6-em)]](https://www.rsc.org/images/entities/char_2009.gif) 1 toluene adduct of 1. Calculated (%) for [C47H55Br2MnN3][C7H8]: C 66.94, H 6.55, N 4.34, found C 66.92, H 6.97, N 3.95. MS m/z: 876.21 M+ (with isotopic distribution). IR ν(cm−1) C
1 toluene adduct of 1. Calculated (%) for [C47H55Br2MnN3][C7H8]: C 66.94, H 6.55, N 4.34, found C 66.92, H 6.97, N 3.95. MS m/z: 876.21 M+ (with isotopic distribution). IR ν(cm−1) C![[double bond, length as m-dash]](https://www.rsc.org/images/entities/char_e001.gif) N imine 1525, 1603. μeff exp = 5.88.
N imine 1525, 1603. μeff exp = 5.88.
![[double bond, length as m-dash]](https://www.rsc.org/images/entities/char_e001.gif) N imine 1386, 1495. μeff exp = 5.15.
N imine 1386, 1495. μeff exp = 5.15.
![[thin space (1/6-em)]](https://www.rsc.org/images/entities/char_2009.gif) :
:![[thin space (1/6-em)]](https://www.rsc.org/images/entities/char_2009.gif) 1 dichloromethane adduct of 3. Calculated (%) for [C47H55Br2CoN3]3[CH2Cl2]: C 62.54, H 6.17, N 4.62, found C 62.72, H 6.17, N 4.27.
1 dichloromethane adduct of 3. Calculated (%) for [C47H55Br2CoN3]3[CH2Cl2]: C 62.54, H 6.17, N 4.62, found C 62.72, H 6.17, N 4.27.
MS m/z: 880.21 M+ (with isotopic distribution). IR ν(cm−1) C![[double bond, length as m-dash]](https://www.rsc.org/images/entities/char_e001.gif) N imine 1562, 1665. μeff exp = 4.34.
N imine 1562, 1665. μeff exp = 4.34.
![[thin space (1/6-em)]](https://www.rsc.org/images/entities/char_2009.gif) :
:![[thin space (1/6-em)]](https://www.rsc.org/images/entities/char_2009.gif) 1 dichloromethane adduct of 4. Calculated (%) for [C47H55Br2NiN3]3[CH2Cl2]: C 62.57, H 6.18, N 4.63, found C 62.32, H 6.18, N 4.70. MS m/z: 879.21 M+ (with isotopic distribution). IR ν(cm−1) C
1 dichloromethane adduct of 4. Calculated (%) for [C47H55Br2NiN3]3[CH2Cl2]: C 62.57, H 6.18, N 4.63, found C 62.32, H 6.18, N 4.70. MS m/z: 879.21 M+ (with isotopic distribution). IR ν(cm−1) C![[double bond, length as m-dash]](https://www.rsc.org/images/entities/char_e001.gif) N imine 1454, 1625. μeff exp = 2.97.
N imine 1454, 1625. μeff exp = 2.97.
Elemental analysis calculated (%) for [C47H55Br2CuN3]: C 63.76, H 6.26, N 4.75, found C 64.11, H 6.08, N 4.47. MS m/z: 884.21 M+ (with isotopic distribution). IR ν(cm−1) C![[double bond, length as m-dash]](https://www.rsc.org/images/entities/char_e001.gif) N imine 1561, 1684. μeff exp = 2.14.
N imine 1561, 1684. μeff exp = 2.14.
![[double bond, length as m-dash]](https://www.rsc.org/images/entities/char_e001.gif) N imine), 152.7(py, o-C
N imine), 152.7(py, o-C![[double bond, length as m-dash]](https://www.rsc.org/images/entities/char_e001.gif) N), 149.9(Ar–CH), 148.3 (Ar–CH), 138.9(Ar, i-C), 138.1(Ar–CH), 134.3(Ar, i-C), 129.8(Ar–CH), 129.3(Ar–CH), 128.3(Ar–CH), 126.1(Ar–CH), 125.0 (Ar–CH), 121.9(Ar-tBu, C-tBu), 120.7(Ar-tBu, C-tBu), 35.5(Ar-tBu, C-(CH3)3), 34.2(Ar-tBu, C–(CH3)3), 31.2(Ar-tBu, CH3), 30.9(Ar-tBu, CH3). Elemental analysis calculated (%) for [C47H55Br2ZnN3]: C 63.63, H 6.25, N 4.74, found C 63.46, H 6.37, N 4.72. MS m/z: 887.21 M+ (with isotopic distribution). IR ν(cm−1) C
N), 149.9(Ar–CH), 148.3 (Ar–CH), 138.9(Ar, i-C), 138.1(Ar–CH), 134.3(Ar, i-C), 129.8(Ar–CH), 129.3(Ar–CH), 128.3(Ar–CH), 126.1(Ar–CH), 125.0 (Ar–CH), 121.9(Ar-tBu, C-tBu), 120.7(Ar-tBu, C-tBu), 35.5(Ar-tBu, C-(CH3)3), 34.2(Ar-tBu, C–(CH3)3), 31.2(Ar-tBu, CH3), 30.9(Ar-tBu, CH3). Elemental analysis calculated (%) for [C47H55Br2ZnN3]: C 63.63, H 6.25, N 4.74, found C 63.46, H 6.37, N 4.72. MS m/z: 887.21 M+ (with isotopic distribution). IR ν(cm−1) C![[double bond, length as m-dash]](https://www.rsc.org/images/entities/char_e001.gif) N imine 1531, 1647.
N imine 1531, 1647.
X-ray crystallography
Crystals were mounted on thin glass fibers using paraffin oil. Prior to data collection crystals were cooled to the collection temperature. Data were collected on a Bruker AXS SMART single crystal diffractometer equipped with a sealed Mo tube source (wavelength 0.71073 Å) APEX II CCD detector. Raw data collection and processing were performed with APEX II software package from BRUKER AXS.42 Initial unit cell parameters were determined from 60 data frames with 0.3° ω scan each collected at the different sections of the Ewald sphere. Semi-empirical absorption corrections based on equivalent reflections were applied.43 Systematic absences in the diffraction data-set and unit-cell parameters were consistent with the space groups. The structures were solved by direct methods, completed with difference Fourier synthesis, and refined with full-matrix least-squares procedures based on F2.For all the compounds all hydrogen atoms positions were calculated based on the geometry of the related non-hydrogen atoms. All hydrogen atoms were treated as idealized contributions during the refinement. All scattering factors are contained in several versions of the SHELXTL program library, with the latest version used being v.6.12.44
Computational details
Density functional theory (DFT) calculations have been performed using the Gaussian 09 package.45 The structures of all species were optimized using the B3LYP functional with the TZVP basis set. Tight SCF convergence criteria (10−8 a.u.) were used for all calculations. Wave function stability calculations were performed to confirm that the calculated wave functions corresponded to the electronic ground state. Harmonic frequency calculations with the analytic evaluation of force gradients were used to determine the nature of the stationary points.The analysis of the molecular orbital (MO) compositions in terms of occupied and unoccupied orbitals of the fragment species (HOFOs and LUFOs, respectively) was performed, and Mayer bond orders were calculated using the AOMix program.46,47 Atomic charges were evaluated by using the natural population analysis (NPA).
Conclusions
This report describes a homologous series of divalent first row transition metal complexes supported by a sterically demanding bis(imino)pyridine ligand framework. All six complexes, from Mn(II) to Zn(II), have been experimentally characterized including single crystal X-ray analysis and the coordination geometries are best described as distorted square pyramidal. This assembly of complexes provided a unique system for investigating the correlation of experimental structure and electronic structure analysis.The electronic structure optimization was able to accurately capture the experimental results and gave confidence for our orbital analysis of the intimate molecular structural/bonding features. While in the case of the M–Npy and M–Brbas the variation in metal–ligand bond lengths for this series basically correlated with the Irving–Williams series, there were some clear deviations for M–Nim and M–Brap that could only be rationalized through and orbital analysis. The balance of bis(imino)pyridine/metal with bonding/antibonding π interactions explain the divergent directions of Fe(II)–N and Co(II)–N bond lengths. Similarly, orbital details justify the opposing change in Cu–Brap and Cu–Brbas bond lengths. Furthermore, computational analysis provided a unique method to document a surprising low bond order for the M–N bonds of bis(imino)pyridine ligand in this series.
Our continuing efforts to better understand these interactions through ligand modifications will raise our knowledge of fundamental bonding interactions which, in turn, govern the ability to target catalytically relevant, earth abundant transition metal complexes for the development of improved catalysts.
Acknowledgements
The authors thank the Natural Sciences and Engineering Research Council (NSERC) of Canada for funding.Notes and references
- Z. Flisak and W.-H. Sun, ACS Catal., 2015, 5, 4713–4724 CrossRef CAS.
- B. L. Small, Acc. Chem. Res., 2015, 48, 2599–2611 CrossRef CAS PubMed.
- O. R. Luca and R. H. Crabtree, Chem. Soc. Rev., 2013, 42, 1440 RSC.
- O. R. Luca, S. J. Konezny, E. K. Paulson, F. Habib, K. M. Luthy, M. Murugesu, R. H. Crabtree and V. S. Batista, Dalton Trans., 2013, 42, 8802–8807 RSC.
- K. G. Caulton, Eur. J. Inorg. Chem., 2012, 2012, 435–443 CrossRef CAS.
- O. R. Luca, J. D. Blakemore, S. J. Konezny, J. M. Praetorius, T. J. Schmeier, G. B. Hunsinger, V. S. Batista, G. W. Brudvig, N. Hazari and R. H. Crabtree, Inorg. Chem., 2012, 51, 8704–8709 CrossRef CAS PubMed.
- P. J. Chirik and K. Wieghardt, Science, 2010, 327, 794–795 CrossRef CAS PubMed.
- K. T. Sylvester and P. J. Chirik, J. Am. Chem. Soc., 2009, 8772–8774 CrossRef CAS PubMed.
- Q. Knijnenburg, S. Gambarotta and P. H. M. Budzelaar, Dalton Trans., 2006, 5442–5448 RSC.
- S. C. Bart, K. Chłopek, E. Bill, M. W. Bouwkamp, E. Lobkovsky, F. Neese, K. Wieghardt and P. J. Chirik, J. Am. Chem. Soc., 2006, 128, 13901–13912 CrossRef CAS PubMed.
- J. Scott, S. Gambarotta, I. Korobkov and P. H. M. Budzelaar, Organometallics, 2005, 24, 6298–6300 CrossRef CAS.
- J. Scott, S. Gambarotta, I. Korobkov, Q. Knijnenburg, B. De Bruin and P. H. M. Budzelaar, J. Am. Chem. Soc., 2005, 127, 17204–17206 CrossRef CAS PubMed.
- S. C. Bart, E. Lobkovsky and P. J. Chirik, J. Am. Chem. Soc., 2004, 126, 13794–13807 CrossRef CAS PubMed.
- P. H. M. Budzelaar, B. De Bruin, A. W. Gal, K. Wieghardt and J. H. Van Lenthe, Inorg. Chem., 2001, 40, 4649–4655 CrossRef CAS PubMed.
- B. De Bruin, E. Bill, E. Bothe, T. Weyhermueller and K. Wieghardt, Inorg. Chem., 2000, 39, 2936–2947 CrossRef CAS PubMed.
- L. A. Berben, Chem. – Eur. J., 2015, 21, 2734–2742 CrossRef CAS PubMed.
- E. J. Thompson and L. A. Berben, Angew. Chem., Int. Ed., 2015, 54, 11642–11646 CrossRef CAS PubMed.
- B. L. Small, M. Brookhart and A. M. a. Bennett, J. Am. Chem. Soc., 1998, 120, 4049–4050 CrossRef CAS.
- G. Britovsek, V. Gibson, B. Kimberley, P. Maddox, S. McTavish, G. Solan, A. White and D. Williams, Chem. Commun., 1998, 311, 849–850 RSC.
- T. Jurca, L. K. Hiscock, I. Korobkov, C. N. Rowley and D. S. Richeson, Dalton Trans., 2014, 43, 690–697 RSC.
- T. Jurca, I. Korobkov, S. I. Gorelsky and D. S. Richeson, Inorg. Chem., 2013, 52, 5749–5756 CrossRef CAS PubMed.
- T. Jurca, J. Lummiss, T. J. Burchell, S. I. Gorelsky and D. S. Richeson, J. Am. Chem. Soc., 2009, 131, 4608–4609 CrossRef CAS PubMed.
- T. Jurca, S. Ouanounou, S. I. Gorelsky, I. Korobkov and D. S. Richeson, Dalton Trans., 2012, 41, 4765 RSC.
- T. Jurca, I. Korobkov, G. P. a. Yap, S. I. Gorelsky and D. S. Richeson, Inorg. Chem., 2010, 49, 10635–10641 CrossRef CAS PubMed.
- T. Jurca, S. I. Gorelsky, I. Korobkov and D. S. Richeson, Dalton Trans., 2011, 40, 4394–4396 RSC.
- T. Jurca, A. Farghal, P. Lin, I. Korobkov, M. Murugesu and D. S. Richeson, J. Am. Chem. Soc., 2011, 133, 15814–15817 CrossRef CAS PubMed.
- D. Zhu and P. H. M. Budzelaar, Organometallics, 2008, 27, 2699–2705 CrossRef CAS.
- A. M. McDaniel, A. K. Rappé and M. P. Shores, Inorg. Chem., 2012, 51, 12493–12502 CrossRef CAS PubMed.
- S. I. Gorelsky, L. Basumallick, J. Vura-weis, R. Sarangi, K. O. Hodgson, B. Hedman, K. Fujisawa and E. I. Solomon, Inorg. Chem., 2005, 44, 4947–4960 CrossRef CAS PubMed.
- D. A. Edwards, S. D. Edwards, T. J. Pringle, R. Martin and P. Thornton, Polyhedron, 1992, 11, 1569–1573 CrossRef CAS.
- D. A. Edwards, M. F. Mahon, W. R. Martin, K. C. Molloy, P. E. Fanwick and R. A. Walton, J. Chem. Soc., Dalton Trans., 1990, 3161–3168 RSC.
- E. C. Alyea and P. H. Merrell, Inorg. Chim. Acta, 1978, 28, 91–97 CrossRef CAS.
- P. K. Biswas, M. K. Dasgupta, S. Mitra and N. R. Chaudhuri, J. Coord. Chem., 1982, 11, 225–230 CrossRef CAS.
- E. C. Alyea and P. H. Merrell, Synth. React. Inorg. Met.-Org. Chem., 1974, 4, 535–544 CrossRef CAS.
- E. L. Muetterties and L. J. Guggenberger, J. Am. Chem. Soc., 1974, 3021, 1748–1756 CrossRef.
- A. W. Addison, T. N. Rao, J. Reedijk, J. van Rijn and G. C. Verschoor, J. Chem. Soc., Dalton Trans., 1984, 1349 RSC.
- H. Irving and R. J. P. Williams, Nature, 1948, 162, 746 CrossRef CAS.
- H. Irving and R. J. P. Williams, J. Chem. Soc., 1953, 3192–3210 RSC.
- T. Jurca, K. Dawson, I. Mallov, T. Burchell, G. P. a. Yap and D. S. Richeson, Dalton Trans., 2010, 39, 1266–1272 RSC.
- D. F. Evans, J. Chem. Soc., 1959, 2003 RSC.
- D. H. Lives and S. I. Chan, Anal. Chem., 1970, 42, 971 Search PubMed.
- APEX Softward Suite v 2010, Bruker AXS, Madison WI, 2010 Search PubMed.
- B. Y. R. H. Blessing, Acta Crystallogr., Sect. A: Fundam. Crystallogr., 1995, 33–38 CrossRef.
- G. M. Sheldrick, Acta Crystallogr., Sect. A: Fundam. Crystallogr., 2008, 112–122 CrossRef CAS PubMed.
- M. J. Frisch, G. W. Trucks, H. B. Schlegel, G. E. Scuseria, M. A. Robb, J. R. Cheeseman, G. Scalmani, V. Barone, B. Mennucci, G. A. Petersson, H. Nakatsuji, M. Caricato, X. Li, H. P. Hratchian, A. F. Izmaylov, J. Bloino, G. Zheng and D. J. Sonnenb, Gaussian 09, Revision A.02 Search PubMed.
- S. I. Gorelsky, AOMix software for molecular orbital analysis, Version 6.8, 2013 Search PubMed.
- S. I. Gorelsky and A. B. P. Lever, J. Organomet. Chem., 2001, 635, 187–196 CrossRef CAS.
Footnote |
| † Electronic supplementary information (ESI) available. CCDC 1488169–1488174. For ESI and crystallographic data in CIF or other electronic format see DOI: 10.1039/c6dt02598f |
| This journal is © The Royal Society of Chemistry 2016 |

