 Open Access Article
Clioquinol–ruthenium complex impairs tumour cell invasion by inhibiting cathepsin B activity
Ana
Mitrović
a,
Jakob
Kljun
b,
Izidor
Sosič
a,
Stanislav
Gobec
a,
Iztok
Turel
b and
Janko
Kos
*ac
aFaculty of Pharmacy, University of Ljubljana, 1000 Ljubljana, Slovenia. E-mail: janko.kos@ffa.uni-lj.si; Fax: +386-1-42-58-031; Tel: +386-1-47-69-604
bFaculty of Chemistry and Chemical Technology, University of Ljubljana, 1000 Ljubljana, Slovenia
cDepartment of Biotechnology, Jožef Stefan Institute, 1000 Ljubljana, Slovenia
First published on 16th September 2016
Abstract
Over the past few years, the organometalled compounds, including ruthenium, gained a lot of attention as anticancer agents. We report on the clioquinol–ruthenium complex [Ru(η6-p-cymene)(Cq)Cl] as a potent inhibitor of cathepsin B, a lysosomal cysteine peptidase, involved in tumour cell invasion and metastasis. In the low micromolar concentration range, the clioquinol–ruthenium complex did not exhibit cytotoxic effects on MCF-10A neoT and U-87 MG cells; it did, however, significantly reduce their ability for extracellular matrix degradation and invasiveness in two independent cell-based models, measuring either electrical impedance in real time or the growth of multicellular tumour spheroids implanted in Matrigel, a model representing the extracellular matrix. These results establish ruthenium based organometallic compounds as promising candidates for further pre-clinical studies as anticancer therapeutics.
Introduction
After the successful introduction of cisplatin into clinical practice, there has been a growing interest in discovering new metal complexes as potential anticancer agents.1–3 Among these complexes, the ruthenium-based compounds have received a lot of attention due to their ability to exhibit antitumour activity.4 The majority of ruthenium complexes have general cytotoxic effects on tumour cell lines, affecting multiple cellular targets depending on their ligand type; however, some of them also show more specific antitumour and antimetastatic activities at non-cytotoxic concentrations.3–6 Two ruthenium(III) complexes, NAMI-A and KP1019/NKP-1339, have completed phase II clinical trials7–11 and many others, including the bifunctional ruthenium(II)–arene (RAPTA) complexes, are at different stages of pre-clinical development.5 While cisplatin activity was initially associated with its action on DNA,2 it has become clear that DNA is not the only target.12–16 Similarly, for ruthenium compounds other targets besides DNA have been identified.17 Ruthenium-based compounds can interact with proteins such as human serum proteins, transferrin and albumin, and intracellular proteins such as cathepsin B, ubiquitin, cytochrome-c (cyt), metallothioneins, thioredoxin reductase, poly(adenosine diphosphate (ADP)-ribose) polymerases (PARPs), histone proteins and others.5,18 The interactions of metal-based compounds with tumour-associated enzymes rightfully deserve special attention. Cathepsin B, in particular, is one such important enzyme since it is involved in various processes of tumour progression.19Cathepsin B (EC 3.4.22.1) is a lysosomal cysteine peptidase that belongs to clan CA of the papain family (C1).20 It is unique among cysteine cathepsins as its structure reveals an extra element, termed the occluding loop, defining whether the enzyme acts as an endopeptidase or as an exopeptidase.21–25 In cancer, cathepsin B participates in tumour growth, signalling, and in the degradation of the extracellular matrix, a process promoting the invasion and metastasis of tumour cells and tumour angiogenesis.26–28 Several types of exogenous inhibitors of cathepsin B have been identified; however, due to their low bioavailability and off-target effects, none of them have been introduced into clinical practice.19,29 In addition, for natural protein inhibitors and low-molecular-weight compounds, organoruthenium molecules have also been reported as inhibitors of cathepsin B, including RAPTA compounds and ruthenium–quinolone complexes.19,30–32
In the present study, we have characterized the clioquinol–ruthenium complex [Ru(η6-p-cymene)(Cq)Cl]33,34 as an inhibitor of cathepsin B. Further, its effects on cancer cell lines at non-cytotoxic concentrations were studied, focussing on the ability of this complex to impair tumour cell invasion in vitro.
Results and discussion
Ruthenium-based compounds, as anti-tumour agents, have been shown to interact with proteolytic enzymes, which are involved in various mechanisms of malignant progression.5,19,30–32 Moreover, ruthenium complexes with hydroxyquinoline, including clioquinol, ligands have been reported as anticancer agents.33–37 In this study, we show that the clioquinol–ruthenium complex [Ru(η6-p-cymene)(Cq)Cl, (1)] potently inhibits the tumour-associated cysteine peptidase cathepsin B, in consequence reducing the invasion of tumour cells in vitro at concentrations that are not cytotoxic to tumour cells.It has been established that the clioquinol–ruthenium complex (1) does not intercalate between DNA base pairs at concentrations up to 15 μM but exhibits a cytotoxic activity on various leukaemia cell lines through a caspase-dependent mechanism of cell death. It also showed proteasome independent inhibition of the NFκB signalling pathway without affecting cell-cycle distribution.34 With the aim of casting additional light on its anti-tumour action, we have studied the effects of the complex at non-cytotoxic concentrations.
The clioquinol–ruthenium complex (1) inhibits cathepsin B activity
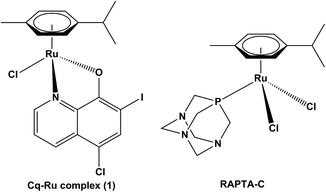
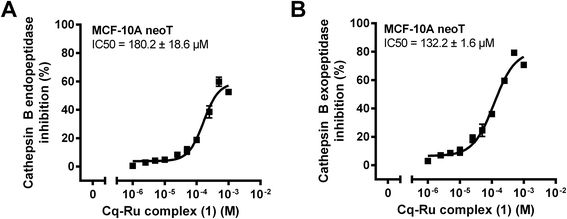
The initial kinetic assays on an isolated enzyme showed that the clioquinol–ruthenium complex (1) (Fig. 1) inhibits the exopeptidase activity of cathepsin B, with a constant of inhibition K′i of 24.3 ± 0.4 μM, whereas its endopeptidase activity was inhibited with a constant of inhibition of 91.7 ± 6.0 μM (Table 1). Endopeptidase and exopeptidase activities of cathepsin B were assayed with substrates Z-Arg-Arg-AMC and Abz-Gly-Ile-Val-Arg-Ala-Lys(Dnp)-OH at pH values of 6.0 and 5.0, respectively. The inhibition constants are comparable to those of other low-molecular-weight inhibitors of cathepsin B, including the recently discovered nitroxoline and its derivatives.38–40 Additionally, the half-maximal inhibitory concentrations (IC50) of 132.2 ± 1.6 μM and 180.2 ± 18.6 μM (Fig. 2) for the inhibition of cathepsin B exopeptidase and endopeptidase activities in MCF-10A neoT whole cell lysates are comparable to those obtained for nitroxoline.28 Moreover, the IC50 values obtained for complex 1 are significantly lower than those obtained for an organoruthenium flagship compound RAPTA-C (1161.5 ± 9.2 μM and 651.8 ± 43.5 μM for cathepsin B exopeptidase and endopeptidase activities, respectively). In a recent study, we showed that both cathepsin B activities contribute to tumour progression and proposed the inhibition of both activities as a strategy for impairing harmful cathepsin B activity in cancer.39 The mechanism of cathepsin B inhibition by complex 1 thus identified it as suitable for additional in vitro anti-cancer studies involving cathepsin B as a tumour-promotive enzyme.| Abz-GIVRAK(Dnp)-OH | |||
|---|---|---|---|
| Compound | IC50 (μM) |
K
i![[thin space (1/6-em)]](https://www.rsc.org/images/entities/char_2009.gif) a (μM) a (μM) |
K′i![[thin space (1/6-em)]](https://www.rsc.org/images/entities/char_2009.gif) b (μM) b (μM) |
| a The inhibition constant for the dissociation of the enzyme-inhibitor complex. b The inhibition constant for the dissociation of the enzyme–substrate-inhibitor complex. c Noncompetitive inhibition. d Mixed inhibition. | |||
| 78.3 ± 23.4 | 142.0 ± 33.9d | 24.3 ± 0.4d | |
Effect of the clioquinol–ruthenium complex (1) on the viability of tumour cell lines
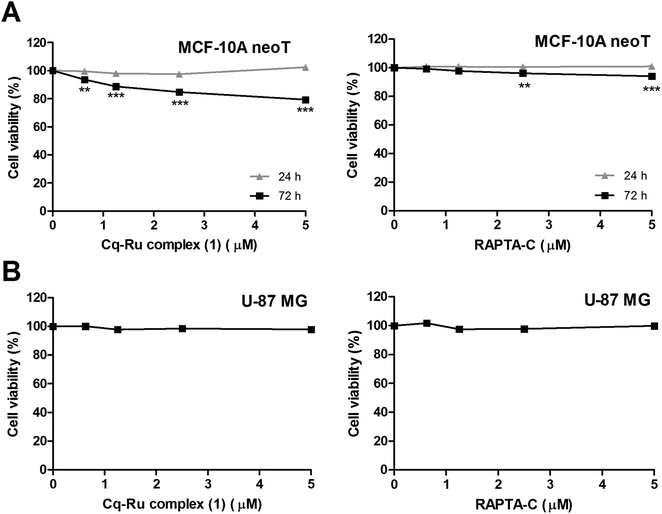
We evaluated the cytotoxic effect of the clioquinol–ruthenium complex (1) on MCF-10A neoT and U-87 MG cells that both express high levels of proteolytically active cathepsin B28 at concentrations ranging from 0.625 to 5 μM using the MTS assay. The clioquinol–ruthenium complex (1) had no significant effect on MCF-10A neoT cells after 24 h, but caused a significant decrease in cell viability at all concentrations tested after 72 h (Fig. 3A). As expected, RAPTA-C, which was used as a control in all cell based experiments, did not affect the viability of the MCF-10A neoT cells after 24 h at any concentrations used; however, after 72 h at 2.5 and 5 μM concentrations, a minor decrease in cell viability was observed (Fig. 3A). On the other hand, neither the clioquinol–ruthenium complex (1) nor RAPTA-C changed the viability of the U-87 MG cells at concentrations up to 5 μM after 72 h of treatment (Fig. 3B). Based on these results, the concentration of 1.25 μM was selected as being non-cytotoxic and used in the subsequent tumour cell invasion assays. At this concentration the decrease in cell viability in the presence of the clioquinol–ruthenium complex (1) was less than 15% (88% cell viability) for MCF-10A neoT after 72 h of treatment and even less under all other conditions.The clioquinol–ruthenium complex (1) impairs tumour cell invasion at non-cytotoxic concentrations
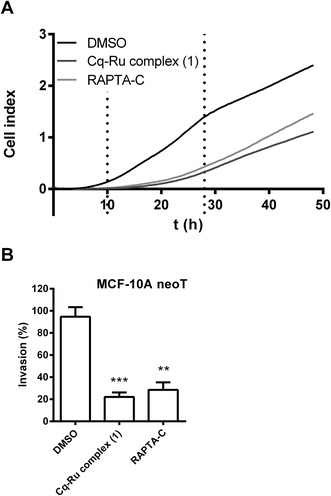
The effect of the clioquinol–ruthenium complex (1) on tumour cell invasion was evaluated using non-cytotoxic concentrations (1.25 μM) of the compound. In the assays, the prototypical RAPTA compound RAPTA-C ([Ru(η6-p-cymene)Cl2(pta)]) (Fig. 1) was used at the same concentration as a control. RAPTA-C has been shown to be an effective antimetastatic and antiangiogenic agent since it potently impaired metastatic processes in vivo by reducing the number and the size of solid lung metastases.41,42 In addition, RAPTA-C exhibited low cytotoxicity in vitro on various tumour cell lines6,41,43 indicating that RAPTA-C acts on tumour cells through mechanisms other than triggering cell cytotoxicity. Interestingly, one of the proposed mechanisms was the inhibition of tumour-associated protease cathepsin B.5,32The impact of both ruthenium complexes on tumour cell invasion was tested by two independent in vitro methods. In the first, the invasion of tumour cells through Matrigel, as a model of the ECM, was monitored in real time using the xCELLigence system.44 The system follows cell invasion over the whole course of the experiment by measuring the impedance, expressed as the cell index (CI) (Fig. 4A), across the microelectrodes integrated in the membrane, separating the top and bottom compartments of the CIM-plate 16. In this assay, complex 1 (1.25 μM) and RAPTA-C (1.25 μM) both significantly reduced the invasion of MCF-10A neoT cells by 77 ± 9% and 70 ± 13%, respectively (Fig. 4B).
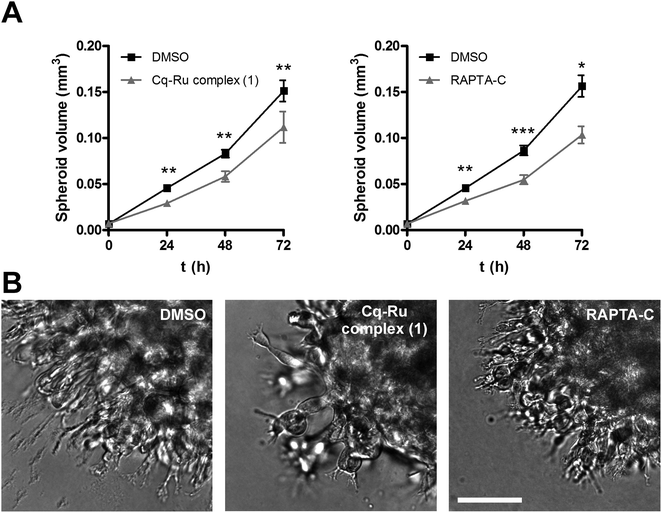
In the second method, multicellular tumour spheroids (MCTS) were used to further evaluate the impact of the clioquinol–ruthenium complex (1) and RAPTA-C on tumour cell invasion. MCTS more closely represent a tumour in vivo by mimicking the early, avascular stages of tumour growth. U-87 MG MCTS were prepared according to the hanging drop method,45 implanted in Matrigel and monitored for three days using the light microscope equipped with an ocular micrometer (Fig. 5A). Representative images of MCTS were taken at day 3 after implantation (Fig. 5B). During the course of experiment, the U-87 MG MCTS exhibited steady growth and formed radially invasive stands in a sunburst pattern around the original spheroid (Fig. 5B). Both complex 1 and RAPTA-C significantly reduced the growth and invasion of the U-87 MG MCTS (26 ± 11 and 32 ± 6% on day 3 for complex 1 and RAPTA-C) at low micromolar concentrations (1.25 μM, Fig. 5A). These results confirm the clioquinol–ruthenium complex (1) as being an effective inhibitor of tumour invasion with potency similar to that established for the ruthenium complex RAPTA-C.
Taken together the clioquinol–ruthenium complex (1) is a potent inhibitor of cathepsin B, lysosomal cysteine peptidase that is involved in various processes of tumour progression. In two independent cell based models, complex 1 significantly reduced tumour cell invasion at concentrations that did not affect the viability of the cells, revealing its specific anti-tumour activity. However, the inhibition constants of the clioquinol–ruthenium complex (1) against cathepsin B obtained on an isolated enzyme or whole cell lysates are much higher compared to concentrations used in cell based assays. When interpreting inhibition constants, such as Ki and the half-maximal inhibitory concentration (IC50), we have to be aware that while true inhibition constants (Ki) are thermodynamic constants that are independent of the enzyme concentration, the IC50 value relies on the concentration of the enzyme used in the assay. For this purpose, we determined the inhibitory properties of the clioquinol–ruthenium complex (1) on DQ-collagen IV degradation, a process which resembles the degradation of the extracellular matrix under real conditions.
The clioquinol–ruthenium complex (1) reduces degradation of the ECM
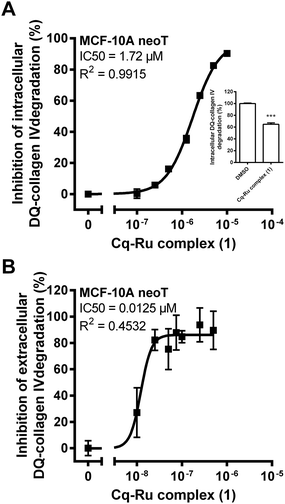
The ECM degradation is one of the key processes involved in tumour invasion and metastasis. It was shown that cathepsin B is one of the crucial players in the degradation of ECM and is involved in both of its intracellular and extracellular degradation.46–48 The extracellular degradation of ECM is associated with secreted and membrane associated cathepsin B,49 while intracellular degradation occurs in lysosomes after endocytosis of the partially degraded components of ECM.27,47 To investigate the impact of the clioquinol–ruthenium complex (1) on ECM degradation, we evaluated its effect on the degradation of DQ-collagen type IV by MCF-10A neoT cells. Collagen type IV is the major component of ECM that can be fluorescently labelled giving upon proteolysis bright green fluorescence. As was shown previously, MCF-10A neoT cells degrade DQ-collagen IV intracellularly and extracellularly.28For inhibition of intracellular DQ-collagen degradation by the clioquinol–ruthenium complex (1), the IC50 of 1.7 μM was calculated (Fig. 6A). In contrast, much higher concentration of RAPTA-C (8.9 ± 2.7% inhibition at 50 μM concentration) was needed for inhibition of intracellular DQ-collagen IV degradation.
For inhibition of the extracellular DQ-collagen IV degradation, the IC50 of 12.5 nM was determined for complex 1 (Fig. 6B). Both IC50 values for the inhibition of DQ-collagen IV degradation for the clioquinol–ruthenium complex (1) are more closely related to the concentrations of compounds used in the invasion assays (1.25 μM).
Similarly to the synthetic cathepsin B substrate, data for DQ-collagen IV degradation show that complex 1 is a more potent inhibitor of cathepsin B compared to RAPTA-C and obviously the interactions with other targets besides cathepsin B are involved in the anti-tumour activity of RAPTA-C. Also for the clioquinol–ruthenium complex (1) other proteolytic enzymes, as players in the degradation process, cannot be excluded.
Experimental section
Reagents
The clioquinol–ruthenium complex (1) was synthesised as previously described34 and its purity was determined by 1H NMR spectroscopy and CHN elemental analysis. RAPTA-C was synthesized according to a published procedure and its purity was confirmed by 1H NMR spectroscopy and CHN elemental analysis.50Enzyme kinetics
Human recombinant cathepsin B was prepared as previously reported.51 Cathepsin B endopeptidase and exopeptidase assay buffers were 100 mM phosphate buffer (pH 6.0) and 60 mM acetate buffer (pH 5.0), respectively. Each contained 0.1% PEG 8000 (Sigma-Aldrich, St. Louis, MO, USA), 5 mM cysteine and 1.5 mM EDTA. Prior to the assay, the enzyme was activated in the assay buffer for 5 min at 37 °C.Determination of Ki values
Inhibition constants were determined by measuring the reaction velocities at various substrate concentrations in the presence of increasing concentrations of the inhibitor. Five μL of substrate at three concentrations and 5 μL of inhibitor at seven final concentrations (0, 20, 40, 60, 80, 100 and 200 μM) were added to the wells of a black microplate. The reaction was initiated with 90 μL of enzyme in the assay buffer. Substrates Z-Arg-Arg-AMC (Merck, Darmstadt, Germany) at 60, 180 and 360 μM and Abz-Gly-Ile-Val-Arg-Ala-Lys(Dnp)-OH (Bachem, Bubendorf, Switzerland) at 1, 3 and 6 μM were used for assessing cathepsin B endopeptidase and exopeptidase activities, respectively. The formation of the fluorescent degradation products was monitored continuously at 37 °C and 460 nm ± 10 nm with excitation at 380 nm ± 20 nm and 420 nm ± 10 nm with excitation at 320 nm ± 20 nm for Z-Arg-Arg-AMC and Abz-Gly-Ile-Val-Arg-Ala-Lys(Dnp)-OH, respectively on a Tecan Safire2™ (Mannedorf, Switzerland). All assay mixtures contained 5% (v/v) DMSO. All measurements were performed in duplicate and repeated three times. Ki values were calculated using the SigmaPlot® 12, Enzyme Kinetics Module™ 1.3.Determination of IC50 values
IC50 values were determined by measuring the reaction velocities at constant substrate concentration in the presence of increasing concentrations of the inhibitor. Five μL of substrate at final concentrations of 5 and 1 μM for endopeptidase and exopeptidase activities, respectively and 5 μL of inhibitor at eleven final concentrations (0, 1, 2.5, 5, 10, 25, 50, 100, 250, 500 and 1000 μM) were added to the wells of a black microplate. Substrates Z-Arg-Arg-AMC and Abz-Gly-Ile-Val-Arg-Ala-Lys(Dnp)-OH were used for assessing cathepsin B endopeptidase and exopeptidase activities, respectively. The reaction was initiated with 90 μL of enzyme in the assay buffer. The formation of the fluorescent degradation products was monitored as described above. All assay mixtures contained 5% (v/v) DMSO. All measurements were performed in duplicate and repeated twice. IC50 values were calculated from the relative inhibition of enzyme activities using the GraphPad Prism 6.0 software package (GraphPad Software, San Diego, CA). The relative inhibition of enzyme activities was calculated according to the equation: Relative inhibition (%) = 100(1 − νi/ν0), where νi and ν0 denote the reaction velocities in the presence and absence of an inhibitor, respectively.Dose–response inhibition of cathepsin B activity in whole cell lysates
Whole-cell lysates from MCF-10A neoT cells were prepared in lysis buffer (50 mM HEPES, 1 mM EDTA, 150 mM NaCl, 1% Triton X-100, pH 5.5) and the protein concentration was determined by using the BioRad DC-Protein Assay Kit. The dose–response inhibition of the cathepsin B endopeptidase and exopeptidase activities was analysed by determining the IC50 value as described above with the difference that whole cell lysate (100 μg mL−1 of lysate proteins) in activation buffer was used for reaction initiation.Cell culture
MCF-10A neoT, a c-Ha-ras oncogene transfected human breast epithelial cell line, was provided by Bonnie F. Sloane (Wayne State University, Detroit, MI). The human glioma cell line U-87 MG was obtained from American Type Culture Collection (ATCC, Manassas, VA, USA). MCF-10A neoT cells were cultured in DMEM/F12 (1![[thin space (1/6-em)]](https://www.rsc.org/images/entities/char_2009.gif) :
:![[thin space (1/6-em)]](https://www.rsc.org/images/entities/char_2009.gif) 1) medium (Gibco, Carlsbad, CA, USA) supplemented with 5% fetal bovine serum (FBS, Gibco), 1 μg mL−1 insulin (Sigma-Aldrich), 0.5 μg mL−1 hydrocortisone (Sigma-Aldrich), 50 ng ml−1 EGF (Sigma-Aldrich), 2 mM glutamine (Gibco) and antibiotics. U-87 MG cells were cultured in advanced Dulbecco's modified Eagle's medium (DMEM) supplemented with 10% FBS, 2 mM glutamine and antibiotics. Cells were maintained at 37 °C under a humidified atmosphere containing 5% CO2 until 80% confluence.
1) medium (Gibco, Carlsbad, CA, USA) supplemented with 5% fetal bovine serum (FBS, Gibco), 1 μg mL−1 insulin (Sigma-Aldrich), 0.5 μg mL−1 hydrocortisone (Sigma-Aldrich), 50 ng ml−1 EGF (Sigma-Aldrich), 2 mM glutamine (Gibco) and antibiotics. U-87 MG cells were cultured in advanced Dulbecco's modified Eagle's medium (DMEM) supplemented with 10% FBS, 2 mM glutamine and antibiotics. Cells were maintained at 37 °C under a humidified atmosphere containing 5% CO2 until 80% confluence.
Cell viability assay
To evaluate the effect of the clioquinol–ruthenium complex (1) and RAPTA-C on cell viability of the cell lines used, MTS [3-(4,5-dimethylthiazol-2-yl)-5-(3-carboxymethoxyphenyl)-2-(4-sulfophenyl)-2H-tetrazolium] colorimetric assay was carried out. 5 × 10⁴ and 1 × 10⁴ cells for 24 and 72 h assay respectively were plated into wells of a 96-well microplate and allowed to attach overnight. Cells were then treated with 100 μL of medium containing 0.625, 1.25, 2.5 or 5 μM of the clioquinol–ruthenium complex (1), RAPTA-C or DMSO (0.05%) and incubated for 24 or 72 h. Next, 10 μL of MTS (Promega, Madison, WI, USA) was added to wells of a 96-well microplate and after incubation the absorbance of formazan was measured at 490 nm on a Tecan Safire2™. The cell viability (%) was expressed as a ratio between absorbance obtained in the presence of compounds versus DMSO. All assays were performed in quadruplicate and repeated at least two times.Real-time invasion assay
Tumour cell invasion of the MCF-10A neoT cells in the presence of the clioquinol–ruthenium complex (1) and RAPTA-C in real-time was evaluated using the RTCA instrument (Roche, Basel, Switzerland) as before with minor modifications.44 Before the experiment, cells were serum starved for 24 h. The bottoms of CIM-plate 16 wells (Roche) were coated with 0.3 μg of fibronectin from bovine plasma (Calbiochem, Darmstadt, Germany). The upper compartments of the CIM-plate 16 wells were coated with 20 μL of Matrigel (2 mg ml−1; BD Biosciences, Franklin Lakes, NJ, USA) in serum-free medium (SFM) and allowed to gel for 30 min at 37 °C. After filling the lower compartments with 180 μL of medium containing the respective compound (1.25 μM) or DMSO (0.05%), the top and bottom portions of the CIM-plate 16 were assembled together. Next, 60 μL of SFM with the compound (1.25 μM) or DMSO (0.05%) was added to the upper compartments and the CIM-plate 16 was allowed to equilibrate for 1 h at 37 °C. Afterwards, 80 μL of MCF-10A neoT cell suspension (3 × 10⁴ cells per well) were seeded in the top chambers of CIM-plate 16 and placed into the xCELLigence system where the experiment was left to run for 72 h during which the impedance data, reported as the cell index (CI), was measured in real time every 15 min and the data were analysed with the RTCA software (Roche). The relative invasion (%) was expressed as a percentage relative to the control cells treated with DMSO.Three-dimensional invasion assay
The effect of the clioquinol–ruthenium complex (1) and RAPTA-C to impair tumour cell invasion in a 3D model was evaluated using multi-cellular tumour spheroids (MCTS). MCTS were prepared according to the hanging drop method.45 Twenty μL of U-87 MG cell suspension (150 cells per drop) were placed onto the lids of 100 mm tissue-culture dishes which were inverted over 10 ml of water. The formed aggregates were after 5 days transferred to wells of Lab-Tek™ Chambered Coverglass (Nalge Nunc International, Penfield, NY, USA) which had been coated with 70 μL of Matrigel (5 mg mL−1) in SFM. Then, spheroids were covered with an additional 70 μL of Matrigel and after 20 min at 37 °C covered with 400 μL of the medium. The clioquinol–ruthenium complex (1) and RAPTA-C (1.25 μM) or DMSO (0.05%) were added to the Matrigel and medium and the growth of spheroids was monitored up to three days by measuring the spheroid dimensions under a light microscope, using an ocular micrometer. The spheroid volume was calculated according to the equation: V = (π × length × width2)/6. Images of tumour spheroids were obtained using an Olympus IX 81 motorized inverted microscope and Cell^R software (Olympus, Tokyo, Japan).DQ-collagen IV degradation assay
DQ-collagen IV was used to monitor the effect of compounds on the degradation of the extracellular matrix. The intracellular degradation of DQ-collagen IV by MCF-10A neoT cells was measured using flow cytometry. 6 × 10⁴ MCF-10A neoT cells were plated into the wells of a 24-well plate and allowed to attach overnight. The medium was then replaced with 500 μl of SFM containing the increasing concentrations of the clioquinol–ruthenium complex (1), RAPTA-C or DMSO (0.5%). After 2 h of incubation at 37 °C DQ-collagen IV (5 μg ml−1; Thermo Fischer, Rockford, IL, USA) was added following additional incubation for 2 h at 37 °C. Dead cells were excluded using propidium iodide (BD Biosciences) and only viable cells were monitored for green fluorescence arising from DQ-collagen IV degradation. The measurements were performed on a FACSCalibur instrument (BD Biosciences).To monitor the extracellular DQ-collagen IV degradation, 5 × 10⁴ MCF-10A neoT cells were plated into wells of a 96-well microplate and allowed to attach overnight. Next, the cells were incubated with 100 μl of PBS containing the increasing concentrations of compounds or DMSO (0.05%) and DQ-collagen IV (10 μg ml−1) for 6 h at 37 °C. Afterwards 80 μl of the reaction mixture was transferred into empty wells of a 96-well black microplate and the fluorescence intensity was continuously monitored for 2 h at 515 nm ± 5 nm with excitation at 495 nm ± 5 nm on a Tecan Safire2™. The inhibition of extracellular DQ-collagen IV degradation was expressed as a ratio between the slopes (RFU s−1) obtained in the presence of compounds versus DMSO.
IC50 values were calculated from the inhibition of DQ-collagen IV degradation using the GraphPad Prism 6.0 software package (GraphPad Software, San Diego, CA).
Statistical analysis
Data were analysed using the GraphPad Prism 6.0 software package and are presented as means ± SEM unless stated otherwise. The results were compared by performing Student's t test (nonparametric, two-tailed). Differences were considered significant at P ≤ 0.05.Conclusions
In conclusion, the clioquinol–ruthenium complex (1) has been identified as a low micromolar range inhibitor of the tumour-associated peptidase cathepsin B. At non-cytotoxic concentrations the inhibitor impairs the degradation of ECM and tumour cell invasion revealing a specific anti-cancer mechanism not related to a general compound-induced cytotoxicity. In addition, the results establish complex 1 as a lead compound for the synthesis of novel ruthenium based agents for cancer therapy.Acknowledgements
The authors thank Prof. Roger Pain (Jožef Stefan Institute, Ljubljana, Slovenia) for critical reading of the manuscript. This work was supported by the Slovenian Research Agency (grant number J4-5529 [to J. Kos], Z1-6735 [to J. Kljun] and P1-0175 [to I. Turel]).References
- E. Wong and C. M. Giandomenico, Chem. Rev., 1999, 99, 2451–2466 CrossRef CAS PubMed.
- E. Alessio, Bioinorganic Medicinal Chemistry, Wiley-VCH Verlag GmbH & Co. KGaA, Weinheim, Germany, 2011 Search PubMed.
- C. S. Allardyce and P. J. Dyson, Dalton Trans., 2016, 45, 3201–3209 RSC.
- Y. K. Yan, M. Melchart, A. Habtemariam and P. J. Sadler, Chem. Commun., 2005, 4764–4776 RSC.
- B. S. Murray, M. V. Babak, C. G. Hartinger and P. J. Dyson, Coord. Chem. Rev., 2016, 306, 86–114 CrossRef CAS.
- Z. Adhireksan, G. E. Davey, P. Campomanes, M. Groessl, C. M. Clavel, H. Yu, A. A. Nazarov, C. H. F. Yeo, W. H. Ang, P. Dröge, U. Rothlisberger, P. J. Dyson and C. A. Davey, Nat. Commun., 2014, 5, 3462 Search PubMed.
- J. M. Rademaker-Lakhai, D. van den Bongard, D. Pluim, J. H. Beijnen and J. H. M. Schellens, Clin. Cancer Res., 2004, 10, 3717–3727 CrossRef CAS PubMed.
- C. G. Hartinger, S. Zorbas-Seifried, M. A. Jakupec, B. Kynast, H. Zorbas and B. K. Keppler, J. Inorg. Biochem., 2006, 100, 891–904 CrossRef CAS PubMed.
- S. Leijen, S. A. Burgers, P. Baas, D. Pluim, M. Tibben, E. van Werkhoven, E. Alessio, G. Sava, J. H. Beijnen and J. H. M. Schellens, Invest. New Drugs, 2015, 33, 201–214 CrossRef CAS PubMed.
- C. Mari, V. Pierroz, S. Ferrari and G. Gasser, Chem. Sci., 2015, 6, 2660–2686 RSC.
- R. Trondl, P. Heffeter, C. R. Kowol, M. A. Jakupec, W. Berger and B. K. Keppler, Chem. Sci., 2014, 5, 2925–2932 RSC.
- L. Gatti, G. Cassinelli, N. Zaffaroni, C. Lanzi and P. Perego, Drug Resist. Updates, 2015, 20, 1–11 CrossRef PubMed.
- C. R. Centerwall, K. A. Tacka, D. J. Kerwood, J. Goodisman, B. B. Toms, R. L. Dubowy and J. C. Dabrowiak, Mol. Pharmacol., 2006, 70, 348–355 CAS.
- S. V. Hato, A. Khong, I. J. M. de Vries and W. J. Lesterhuis, Clin. Cancer Res., 2014, 20, 2831–2837 CrossRef CAS PubMed.
- R. Mezencev, Curr. Cancer Drug Targets, 2015, 14, 794–816 CrossRef PubMed.
- I. Turel and J. Kljun, Curr. Top. Med. Chem., 2011, 11, 2661–2687 CrossRef CAS PubMed.
- G. Gasser, I. Ott and N. Metzler-Nolte, J. Med. Chem., 2011, 54, 3–25 CrossRef CAS PubMed.
- P. J. Dyson and G. Sava, Dalton Trans., 2006, 1929–1933 RSC.
- J. Kos, A. Mitrović and B. Mirković, Future Med. Chem., 2014, 6, 1355–1371 CrossRef CAS PubMed.
- N. D. Rawlings, M. Waller, A. J. Barrett and A. Bateman, Nucleic Acids Res., 2014, 42, D503–D509 CrossRef CAS PubMed.
- D. Musil, D. Zucic, D. Turk, R. A. Engh, I. Mayr, R. Huber, T. Popovic, V. Turk, T. Towatari and N. Katunuma, EMBO J., 1991, 10, 2321–2330 CAS.
- D. K. Nägler, A. C. Storer, F. C. V. Portaro, E. Carmona, L. Juliano and R. Ménard, Biochemistry, 1997, 36, 12608–12615 CrossRef PubMed.
- C. Illy, O. Quraishi, J. Wang, E. Purisima, T. Vernet and J. S. Mort, J. Biol. Chem., 1997, 272, 1197–1202 CrossRef CAS PubMed.
- J. C. Krupa, S. Hasnain, D. K. Nägler, R. Ménard and J. S. Mort, Biochem. J., 2002, 361, 613–619 CrossRef CAS PubMed.
- P. C. Almeida, I. L. Nantes, J. R. Chagas, C. C. Rizzi, A. Faljoni-Alario, E. Carmona, L. Juliano, H. B. Nader and I. L. Tersariol, J. Biol. Chem., 2001, 276, 944–951 CrossRef CAS PubMed.
- J. A. Joyce and D. Hanahan, Cell Cycle, 2004, 3, 1516–1519 CrossRef CAS PubMed.
- M. M. Mohamed and B. F. Sloane, Nat. Rev. Cancer, 2006, 6, 764–775 CrossRef CAS PubMed.
- B. Mirković, B. Markelc, M. Butinar, A. Mitrović, I. Sosič, S. Gobec, O. Vasiljeva, B. Turk, M. Čemažar, G. Serša and J. Kos, Oncotarget, 2015, 6, 19027–19042 CrossRef PubMed.
- B. Turk, Nat. Rev. Drug Discovery, 2006, 5, 785–799 CrossRef CAS PubMed.
- J. Kljun, I. Bratsos, E. Alessio, G. Psomas, U. Repnik, M. Butinar, B. Turk and I. Turel, Inorg. Chem., 2013, 52, 9039–9052 CrossRef CAS PubMed.
- R. Hudej, J. Kljun, W. Kandioller, B. Turk, C. G. Hartinger, B. K. Keppler, D. Miklavc and I. Turel, Organometallics, 2012, 31, 5867–5874 CrossRef CAS.
- A. Casini, C. Gabbiani, F. Sorrentino, M. P. Rigobello, A. Bindoli, T. J. Geldbach, A. Marrone, N. Re, C. G. Hartinger, P. J. Dyson and L. Messori, J. Med. Chem., 2008, 51, 6773–6781 CrossRef CAS PubMed.
- W. Fuyi, L. Qun, L. Shuang, W. Kui, H. Wenbing, J. Liyun and H. Yumiao, European Patent Office, CN2009184614 20090522, 2010 Search PubMed.
- M. Gobec, J. Kljun, I. Sosič, I. Mlinarič-Raščan, M. Uršič, S. Gobec and I. Turel, Dalton Trans., 2014, 43, 9045 RSC.
- S. L. Nongbri, B. Therrien and K. M. Rao, Inorg. Chim. Acta, 2011, 376, 428–436 CrossRef CAS.
- T.-T. Thai, B. Therrien and G. Süss-Fink, J. Organomet. Chem., 2009, 694, 3973–3981 CrossRef CAS.
- D. K. Heidary, B. S. Howerton and E. C. Glazer, J. Med. Chem., 2014, 57, 8936–8946 CrossRef CAS PubMed.
- B. Mirković, M. Renko, S. Turk, I. Sosič, Z. Jevnikar, N. Obermajer, D. Turk, S. Gobec and J. Kos, ChemMedChem, 2011, 6, 1351–1356 CrossRef PubMed.
- A. Mitrović, B. Mirković, I. Sosič, S. Gobec and J. Kos, Biol. Chem., 2016, 397, 165–174 CrossRef PubMed.
- I. Sosič, B. Mirković, K. Arenz, B. Štefane, J. Kos and S. Gobec, J. Med. Chem., 2013, 56, 521–533 CrossRef PubMed.
- C. Scolaro, A. Bergamo, L. Brescacin, R. Delfino, M. Cocchietto, G. Laurenczy, T. J. Geldbach, G. Sava and P. J. Dyson, J. Med. Chem., 2005, 48, 4161–4171 CrossRef CAS PubMed.
- P. Nowak-Sliwinska, J. R. van Beijnum, A. Casini, A. A. Nazarov, G. Wagnieres, H. van den Bergh, P. J. Dyson and A. W. Griffioen, J. Med. Chem., 2011, 54, 3895–3902 CrossRef CAS PubMed.
- A. Casini, F. Edafe, M. Erlandsson, L. Gonsalvi, A. Ciancetta, N. Re, A. Ienco, L. Messori, M. Peruzzini and P. J. Dyson, Dalton Trans., 2010, 39, 5556–5563 RSC.
- M. C. Eisenberg, Y. Kim, R. Li, W. E. Ackerman, D. A. Kniss and A. Friedman, Proc. Natl. Acad. Sci. U. S. A., 2011, 108, 20078–20083 CrossRef CAS PubMed.
- J. M. Kelm, N. E. Timmins, C. J. Brown, M. Fussenegger and L. K. Nielsen, Biotechnol. Bioeng., 2003, 83, 173–180 CrossRef CAS PubMed.
- N. Aggarwal and B. F. Sloane, Proteomics: Clin. Appl., 2014, 8, 427–437 CrossRef CAS PubMed.
- A. Premzl, V. Zavašnik-Bergant, V. Turk and J. Kos, Exp. Cell Res., 2003, 283, 206–214 CrossRef CAS PubMed.
- S. Roshy, B. F. Sloane and K. Moin, Cancer Metastasis Rev., 2003, 22, 271–286 CrossRef CAS PubMed.
- J. E. Koblinski, M. Ahram and B. F. Sloane, Clin. Chim. Acta, 2000, 291, 113–135 CrossRef CAS.
- C. S. Allardyce, P. J. Dyson, D. J. Ellis, P. A. Salter and R. Scopelliti, J. Organomet. Chem., 2003, 668, 35–42 CrossRef CAS.
- R. Kuhelj, M. Dolinar, J. Pungercar and V. Turk, Eur. J. Biochem., 1995, 229, 533–539 CrossRef CAS PubMed.
| This journal is © The Royal Society of Chemistry 2016 |

