 Open Access Article
Creative Commons Attribution 3.0 Unported Licence
Characterization of a monocyanide model of FeFe hydrogenases – highlighting the importance of the bridgehead nitrogen for catalysis†
C.
Esmieu
and
G.
Berggren
*
Molecular Biomimetics, Department of Chemistry – Ångström Laboratory, Uppsala University, 75120 Uppsala, Sweden. E-mail: Gustav.berggren@kemi.uu.se
First published on 11th August 2016
Abstract
An azadithiolate bridged monocyanide derivative [Fe2(adt)(CO)5(CN)]− of [Fe2(adt)(CO)4(CN)2]2− has been prepared and extensively characterized as a model of the [FeFe]-hydrogenase active site, using a combination of FTIR spectroscopy, electrochemical methods and catalytic assays with chemical reductants. The presence of two basic nitrogen sites opens up multiple protonation pathways, enabling catalytic proton reduction. To our knowledge [Fe2(adt)(CO)5(CN)]− represents the first example of a cyanide containing [FeFe]-hydrogenase active site mimic capable of catalytic H2 formation in aqueous media.
Introduction
Hydrogenases are enzymes that catalyze the reversible reduction of protons to molecular hydrogen. In the case of [FeFe]-hydrogenases the reaction occurs at the “H-cluster”, which consists of a canonical [4Fe4S]-cluster coupled to a dinuclear iron complex called the [2Fe] subsite. The [2Fe] subsite features a bridging azadithiolato ligand (adt = [–SCH2NHCH2S–]2−), as well as three CO and two CN− ligands (Fig. 1).1–4 Due to the extreme catalytic efficiency of the enzyme in combination with the unique nature of the cofactor, the [2Fe] subsite has attracted substantial attention from the bioinorganic chemistry community and numerous [FeFe]-hydrogenase or [2Fe] subsite mimics have been reported.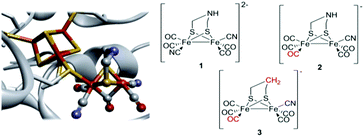 | ||
| Fig. 1 Schematic representation of the inorganic cofactor constituting the active site of [FeFe]-hydrogenase and the synthetic complexes employed in this study. (Left) The complete H-cluster. Heteroatom color coding: Fe = orange, S = yellow, N = blue, and O = red; figure generated from Protein Data Bank entry 3C8Y (Clostridium pasteurianum [FeFe]-hydrogenase, CpI, selected amino acids removed to provide an unobstructed view of the cofactor). (Right) The [2Fe] subsite mimics 1, 2 and 3. | ||
These complexes generally feature CO ligands in combination with surrogate ligands, e.g. carbenes, amines or phosphines, which are said to approach the electron donating properties of cyanide.5,6 Indeed, the use of the latter ligand outside of a protective protein environment has been proven difficult, and consequently [2Fe] subsite model systems employing the more biomimetic cyanide ligands are still less explored.7–15
The new found possibility to artificially activate the [FeFe] hydrogenase enzyme, through the introduction of cyanide ligated synthetic complexes with the general structure [Fe2(xdt)(CO)5−y(CN)1+Y](1+y)− into the apo-enzyme (Y = 0 or 1; xdt denotes different bridging dithiolate ligands), has resulted in a renewed interest in this subclass of [2Fe] subsite mimics.4,16–20 The original report on artificial maturation emphasized the importance of the nitrogen bridgehead atom for efficient catalysis. The introduction of [Fe2(adt)(CO)4(CN)2]2− (1) (Fig. 1) resulted in a fully active enzyme indistinguishable from a native [FeFe]-hydrogenase, while the propylene- and dimethylether dithiolate derivatives, [Fe2(pdt)(CO)4(CN)2]2− and [Fe2(odt)(CO)4(CN)2]2− generated poorly active “artificial” hydrogenases (pdt = [–SCH2CH2CH2S–]2−; odt = [–SCH2OCH2S–]2−).4 A more extensive study has been recently reported by Siebel et al., in which 15 different [2Fe] subsite mimics were screened for incorporation into the enzyme in order to better elucidate the structure/activity relationship of the active site. Remarkably, while the cofactor derivatives generally showed only minor residual activity, the monocyanide analogue [Fe2(adt)(CO)5(CN)]− (2) (Fig. 1) retained approximately 50% activity compared to the native enzyme.18 Despite its notable reactivity once introduced into the apo-enzyme, there are no reports about the chemistry of complex 2 in solution. Thus, herein we report its synthesis, structural characterization, protonation behavior and (electro-)catalytic properties, in order to gain further insight into the chemistry of cyanide ligated [2Fe] subsite mimics and to facilitate the preparation of new improved cofactors for artificial hydrogenase maturation. Where relevant, we also compare with the dicyanide analogue, 1, as well as a form of the complex lacking the nitrogen bridgehead, i.e. [Fe2(pdt)(CO)5(CN)]− (3), in order to elucidate the potential similarities and key differences.
Experimental
Chemicals were purchased from Aldrich Chemicals and used without further purification unless noted otherwise.All manipulations were performed using standard Schlenk and vacuum-line techniques under dinitrogen (N2) or in an Ar-filled glovebox. CH3CN was distilled under N2 from CaH2, whereas Et2O and THF were distilled under N2 from sodium/benzophenone ketyl. Heptane was used without previous distillation. [Fe2(adt)(CO)6], 1 and 3 were synthesized according to the literature procedures, while complex 2 was synthesized via a modified literature protocol.5,8,14,18 Elemental analysis (C, H and N) was performed by Analytische Laboratorien GmbH, Industriepark Kaiserau, D-51789 Lindlar, Germany.
Synthesis of [Fe2(adt)(CO)5(CN)][Et4N], 2[Et4N]
[Fe2(adt)(CO)6] (0.025 g, 0.065 mmol) was dissolved in CH3CN (2 ml) and Me3NO (0.0072 g, 0.065 mmol) was added as a solid. The solution was then cooled to −40 °C and treated via a cannula with a solution of [Et4N][CN] (0.0096 g, 0.061 mmol) in CH3CN (3 ml). The reaction mixture was allowed to warm up to room temperature and was stirred for 2 h. The solvent was removed under reduced pressure to give a dark red residue; this was dissolved in THF (5 mL) and filtered via a cannula to give a dark red filtrate. The solution was concentrated (to 1 mL), precipitated with heptane (10 mL) and the residue was washed with 15 mL Et2O. The product was isolated as a highly hygroscopic black/red solid (0.026 g, 76%) and verified by FTIR, νmax/cm−1 (DMSO) 2091, 2028, 1970, 1953, 1939, and 1911. Anal. Calcd for C16H32Fe2N3O8.5S2 (2[Et4N]·3.5H2O, 580.27 g mol−1): C, 33.23; H, 5.58; N, 7.27; Found: C, 33.3; H, 5.61; N, 7.32.X-ray diffraction
All the measurements were performed using graphite-monochromatized Mo Kα radiation at 100 K using a Bruker D8 APEX-II equipped with a CCD camera. The structure was solved by direct methods (SHELXS-2014) and refined by full-matrix least-squares techniques against F2 (SHELXL-2014/7).21 The non-hydrogen atoms were refined with anisotropic displacement parameters. The H atoms of the CH2 groups were refined with common isotropic displacement parameters for the H atoms of the same group and idealized geometry with approximately tetrahedral angles and C–H distances of 0.99 Å. The H atom of the amine was refined to idealized geometry. The tetraethylammonium unit shows a disorder of all ethyl chains, which are modeled by a positional disorder (sof = 0.73131). A partial disorder of the CN− group over other basal positions cannot be ultimately excluded from the crystallographic data. CCDC 1437643 contains the supplementary crystallographic data for this paper.FTIR spectroscopy
FTIR absorption spectra of 2 were recorded in the spectral range of 2150–1800 cm−1 with a resolution of 2 cm−1 on a Perkin Elmer SpectrumOne FTIR spectrometer. The IR measurements were performed with a liquid-sample-cell (Specac Omni-Cell) using CaF2 windows with 0.5 mm PTFE spacers in CH3CN, DSMO, THF or DMSO/H2O (1![[thin space (1/6-em)]](https://www.rsc.org/images/entities/char_2009.gif) :
:![[thin space (1/6-em)]](https://www.rsc.org/images/entities/char_2009.gif) 1).
1).
Catalytic assays with europium(II) salts
The preparation was done in a glovebox under a wet N2 atmosphere at room temperature in 8 mL sealed vials. The complexes, 1 or 2, (final conc.: 0.25 mM) were dissolved in a mixed HEPES (50 mM, pH 7.5) and DMSO (1![[thin space (1/6-em)]](https://www.rsc.org/images/entities/char_2009.gif) :
:![[thin space (1/6-em)]](https://www.rsc.org/images/entities/char_2009.gif) 1) buffer. The glass vials were then sealed with rubber septa inside the glovebox. The reductants [Eu-DTPA]2− and [Eu-EGTA]2− (25 mM) were prepared in situ by injection of stock solutions (400 mM, in 50 mM HEPES, pH 7.5) of first EuCl2 followed by either DTPA or EGTA. The evolution of hydrogen was monitored by injecting 250 μL of the headspace gas into a gas chromatograph (GC).
1) buffer. The glass vials were then sealed with rubber septa inside the glovebox. The reductants [Eu-DTPA]2− and [Eu-EGTA]2− (25 mM) were prepared in situ by injection of stock solutions (400 mM, in 50 mM HEPES, pH 7.5) of first EuCl2 followed by either DTPA or EGTA. The evolution of hydrogen was monitored by injecting 250 μL of the headspace gas into a gas chromatograph (GC).
Electrochemistry
Electrochemistry experiments were performed in the glovebox using a one-compartment, three-electrode configuration connected to an Autolab PGSTAT100 potentiostat controlled using GPES 4.9 software (EcoChemie). The electrode setup included a glassy carbon disc (0.0701 cm2 or 0.22 cm2 for cyclic voltammetry and bulk electrolysis experiments) working electrode that was polished using 0.05 μm alumina prior to use, a carbon rod auxiliary electrode, and a Ag/Ag+ non-aqueous reference electrode (0.01 M AgNO3 in CH3CN, −0.094 V vs. Fc+/0; Fc = [Fe(C5H5)2]). Fc was added as an internal reference at the end of each experiment, and all reported potentials in CH3CN are quoted versus the Fc+/0 couple. All measurements were conducted with freshly distilled and dry CH3CN with tetrabutylammonium hexafluorophosphate (Bu4NPF6, Fluka, electrochemical grade) as the supporting electrolyte (0.1 M). Cyclic voltammograms were recorded at a scan rate of 100 mV s−1 (unless otherwise specified).Hydrogen measurements by GC
The hydrogen content was determined using a gas chromatograph (PerkinElmer LLC) equipped with a thermal conductivity detector (TCD) and a stainless-steel column packed with molecular sieves (60/80 mesh). The operational temperatures of the injection port, the oven and the detector were 100 °C, 80 °C and 100 °C, respectively. Nitrogen was used as the carrier gas at a flow rate of 35 mL min−1.Results and discussion
Synthesis and structure
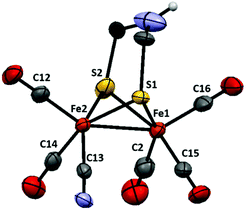
Both complexes 1 and 2 were synthesized from the corresponding hexacarbonyl compound [Fe2(adt)(CO)6] using standard procedures.14,18 In the case of the monosubstituted derivative 2 slight modifications to the published protocol were made. Decarbonylation by Me3NO followed by the addition of a substoichiometric amount of [Et4N][CN] allowed the isolation of the desired product with good yield (76%).The structure of 2 was confirmed by single-crystal X-ray diffraction (Fig. 2). Single crystals suitable for X-ray diffraction experiments were grown upon layering heptane onto a THF solution of 2, under anaerobic conditions and at room temperature. The structure shows the usual distorted square-pyramidal geometry around the iron center. The cyanide ligand is coordinated to an equatorial site on Fe(2) and roughly cis to the Fe–Fe bond. It follows that complex 2 adopts the same type of solid-state structure as that of its pdt analogue, 3, reported by Rauchfuss and co-workers.8 The Fe–Fe distance is slightly shorter in the case of the adt complexes, 2.507 Å in 2vs. 2.529 Å in 3, and more comparable to what is observed for the dicyanide complex 1 (2.509 Å). Conversely, the Fe(2)–S(1,2) bonds are significantly shorter in both 2 and 3 compared to the distances found in 1 (average distances: 2.243, 2.252 and 2.283 Å respectively).
FTIR spectroscopy
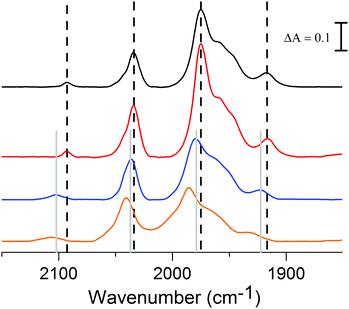
The FTIR spectrum of complex 2 in the polar solvent DMSO, is in agreement with the reported data and shows five absorption bands in the range of 1900–2030 cm−1 for its terminal carbonyls and one band around 2100 cm−1 for the cyanide ligand (Fig. 3, black line).18 The shoulder observed at 1987 cm−1 in DMSO appears to be solvent dependent, as it is not observable in the non-polar solvent THF (Fig. 3, blue line), in line with what has been observed for complex 3.8 Because of our interest for 2 in a biological context the influence of water on the spectrum and stability was studied. The poor solubility of 2 in water did not allow us to perform FTIR measurement in pure aqueous media and instead a solution of DMSO/H2O (1![[thin space (1/6-em)]](https://www.rsc.org/images/entities/char_2009.gif) :
:![[thin space (1/6-em)]](https://www.rsc.org/images/entities/char_2009.gif) 1) was used (Fig. 3, red line). The FTIR spectrum of 2 under these conditions is similar to what is observed in pure DMSO, although the complex slowly decomposes in the presence of water with about 65% remaining after 2 h (ESI Fig. S1†).
1) was used (Fig. 3, red line). The FTIR spectrum of 2 under these conditions is similar to what is observed in pure DMSO, although the complex slowly decomposes in the presence of water with about 65% remaining after 2 h (ESI Fig. S1†).
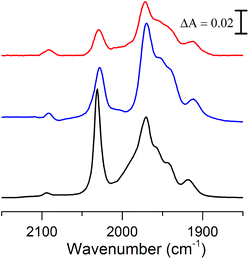 | ||
Fig. 3 Absorbance FTIR spectra of 2: DMSO solution (black), THF solution (blue) and DMSO/H2O (1![[thin space (1/6-em)]](https://www.rsc.org/images/entities/char_2009.gif) : :![[thin space (1/6-em)]](https://www.rsc.org/images/entities/char_2009.gif) 1) solution (red). 1) solution (red). | ||
Catalytic assay
The capacity of 2 for catalytic H2 evolution from mixed DMSO/H2O (1![[thin space (1/6-em)]](https://www.rsc.org/images/entities/char_2009.gif) :
:![[thin space (1/6-em)]](https://www.rsc.org/images/entities/char_2009.gif) 1) solutions buffered at pH 7.5 with HEPES was assayed using reduced methyl viologen (MV) (E° = −0.446 V vs. SHE) as well as europium based reductants (E° = −0.88 to −1.14 V vs. SHE). The amount of H2 gas produced was monitored by gas chromatography (GC), via sampling of the headspace gas.
1) solutions buffered at pH 7.5 with HEPES was assayed using reduced methyl viologen (MV) (E° = −0.446 V vs. SHE) as well as europium based reductants (E° = −0.88 to −1.14 V vs. SHE). The amount of H2 gas produced was monitored by gas chromatography (GC), via sampling of the headspace gas.
No activity could be observed when 2 (0.5 mM) was assessed under classical enzymatic assay conditions, with sodium dithionite (0.1 M) and methyl viologen (0.01 M).22 Conversely, efficient H2 evolution was detected when a more reducing europium complex was employed. The europium(II) ion is a relatively weak reductant, but can generate more potent one-electron reductants upon mixing with equimolar amounts of polyaminocarboxylate ligands.23,24
Two ligands were employed for the complexation with EuIII/II: EGTA (ethylene glycol-bis(2-aminoethylether)-N,N,N′,N′-tetraacetic acid) and DTPA (diethylenetriamine-N,N,N′,N′′,N′′-pentaacetic acid), and the resulting complexes are denoted as Eu-EGTA and Eu-DTPA. At pH 8.0, the standard reduction potentials ( ) of the EuIII/II-EGTA and EuIII/II-DTPA couples are −0.88 V and −1.14 V (vs. SHE).23
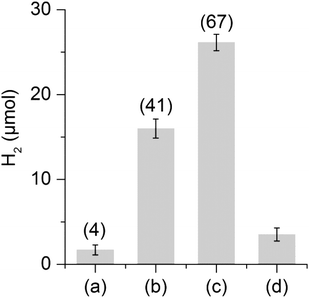
The hydrogen evolution capacity of complexes 1 and 2 was studied by the addition of a hundredfold excess of Eu-EGTA or Eu-DTPA, relative to the catalyst, to the catalytic assays (Fig. 4). In the case of Eu-DTPA we observed a slow spontaneous decomposition of the reductant under our buffer conditions resulting in a small amount of H2, up to 2 μmol without addition of a catalyst. However, the presence of 2 (0.25 mM) resulted in significantly higher H2 production corresponding to 41 turnovers (TON) (16 μmol ± 7%) already after 10 minutes; extending the reaction time results in a marginal increase of H2 production (see ESI Fig. S2†). The formation of H2via proton reduction is a two electron process giving a maximum TON of 50, and consequently a yield of 82% for Eu(II) to H2. Addition of another 100 eq. of Eu-DTPA to the assay after one hour allowed us to restart the reaction, albeit with slightly lower yield (54%), supporting the stability of 2 under catalytic conditions (Fig. 4). In contrast, no H2 generation could be observed with 1. The difference in reactivity between 1 and 2 can be attributed to the possible instability of 1 under the assay conditions or, more likely, the difference in the redox potential existing between the two complexes (see below). Under the same conditions, no H2 production was observed with Eu-EGTA with either complexes, indicating that the reduction potential required for efficient catalysis lies between −0.9 and −1.14 V (vs. SHE). Finally, changing the buffer for a Tris buffer does not affect the activity of compound 2 (see ESI Fig. S2†). To the best of our knowledge complex 2 represents the first cyanide containing [2Fe] subsite mimic to exhibit catalytic H2 production in aqueous media using chemical reductants.
FTIR spectroscopy after protonation
In light of the catalytic properties of complex 2 the protonation behavior of the complex was studied, a key issue to start addressing the catalytic mechanism. Complex 2 features three potential sites for protonation, the Fe–Fe bond, the bridgehead nitrogen or the cyanide ligand, all of which are readily distinguishable by FTIR spectroscopy. Interestingly two of these sites could be selectively protonated using acids with different pKa values in CH3CN solution, i.e. acetic acid, AcOH (pKa ≈ 22.3) or dichloroacetic acid, Cl2CHCOOH (pKa ≈ 16.4).25,26 The addition of 10 eq. of Cl2CHCOOH to an CH3CN solution of 2 resulted in a shift of +16 cm−1 of both the CO and CN− bands (Fig. 5, orange line), a shift attributable to protonation of the bridgehead nitrogen to generate [Fe2(Hadt)(CO)5(CN)]±0.13 Conversely, the addition of 10 eq. of the weaker acid, AcOH, did not result in a detectable shift (Fig. 5, red line). However, after the addition of 40 eq. of AcOH a new species started to appear in the spectrum, and complete conversion was obtained after the addition of 1000 eq. of AcOH (Fig. 5, blue line). In this case the CO and CN− bands have been shifted by approximately 10 cm−1 towards higher frequencies; this smaller shift indicates protonation of the cyanide ligand generating [Fe2(adt)(CO)5(CNH)]±0 and has previously been reported for [HFe2(pdt)(CO)4(PMe3)(CNH)]+1.10 Moreover, no hydride formation could be observed under these conditions, in agreement with the literature data for the pdt analogue 3.8Electrochemistry
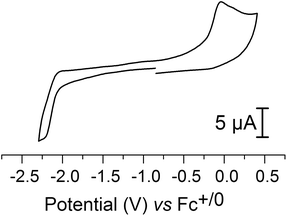
Electrochemical characterization of 2 by cyclic voltammetry was performed in an CH3CN electrolyte. The cyclic voltammogram (CV) of the complex displayed one irreversible oxidation peak (ip, a) at −0.043 V and one irreversible reduction peak (ip, c) at −2.23 V, versus Fc+/0 (Fig. 6). These two processes are diffusion-limited, as indicated by the linear dependence of the peak current on the square root of the scan rate (ESI Fig. S3†). Moreover, increasing the scan rate up to 1000 mV s−1 does not allow partial reversibility to be observed, indicating that rapid chemical reactions occur upon both reduction and oxidation.Based on comparison with the electrochemical data reported for the pdt analogue 3 (ip, a = 0.14 V, ip, c = −2.16 V versus Fc+/0) the peaks are attributed to metal centered redox reactions (see ref. 8 and ESI Fig. S4†). However, for 3 the oxidation has been argued to be a two-electron process, based on an observed ip, c/ip, a ratio of 0.5.8 In the case of 2 the corresponding ratio is ≈1, and thus we tentatively assign the oxidation peak to a FeIFeI/FeIIFeI process, and the reduction peak to a FeIFeI/Fe0FeI process, respectively.
The effect of cyanide ligation on the redox properties of [2Fe] subsite models has previously been reported for the pdt bridged series [Fe2(pdt)(CO)6], [Fe2(pdt)(CO)5(CN)]− and [Fe2(pdt)(CO)4(CN)2]2−, where each successive CO to CN− substitution shifts the reduction potentials by approximately 0.6 V towards more cathodic potentials.8 We observe a similar trend also for the adt bridged analogues, and with respect to [Fe2(adt)(CO)6] the oxidation and reduction of 2 occur at potentials that are shifted 0.63 V and 0.65 V towards more cathodic potentials, respectively.27 An additional shift of 600 mV is observed for the oxidation of the dicyanide derivative, 1, compared to 2. The oxidation peak occurs at −0.62 V versus Fc+/0. The reduction peak is not reachable under our experimental conditions in the case 1, and thus shifted by at least 400 mV (Ered < −2.6 V, ESI Fig. S5†).
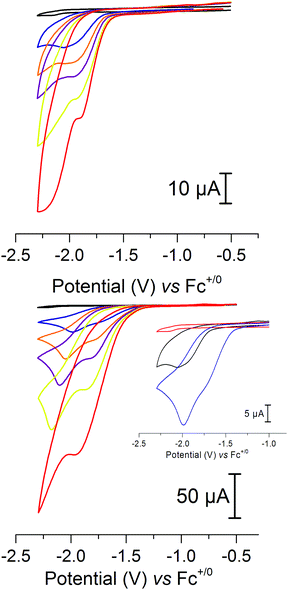
In view of the catalytic activity observed for 2 in aqueous media we also explored its electrocatalytic properties. Indeed, cyclic voltammetry studies in the presence of acids revealed that 2 is a competent electrocatalyst for proton reduction. The addition of 2 mM of AcOH (40 eq.), conditions which result in the formation of [Fe2(adt)(CO)5(CNH)]±0 (see above), gave rise to a new reduction peak at −2.0 V versus Fc+/0. Further addition of acid resulted in an increased current peak height, as expected for an electrocatalytic process (Fig. 7, top, and ESI Fig. S6†). This observation is unexpected considering that the pdt analogue 3 is reported to be catalytically inactive, despite very similar redox properties and protonation behavior, i.e. protonation of the cyanide ligand.10 In order to verify that this is not due to differences in the experimental conditions, e.g. choice of acid, we assayed complex 3 under our conditions, but no indication of catalysis was detected (ESI Fig. S4†). We attribute this discrepancy to the presence of the azadithiolate bridge in 2, which is likely to act as an additional base in the proton reduction mechanism.
The importance of the bridgehead nitrogen is further supported by the electrocatalytic behavior in the presence of Cl2CHCOOH, an acid shown to favor protonation of the bridgehead nitrogen over the cyanide. Also in the case of Cl2CHCOOH the catalytic process at −2.0 V is clearly visible in the CV. Moreover, it is preceded by a new catalytic process that appears at −1.7 V vs. Fc+/0, i.e. ∼300 mV more positive, readily distinguishable at lower acid concentrations (Fig. 7, bottom and inset). Again, the current is proportional to the amount of the acid that is added into the solution and higher currents are obtained compared to AcOH with equimolar amounts of the acid (ESI Fig. S7†). Currents obtained are also dependent on the concentration of 2 in the solution, and the catalytic wave shows a linear dependence of the peak current on the square root of the scan rate (ESI Fig. S8–S11†), indicating a homogeneous catalytic process.
In contrast, no catalytic activity was observed with 1 under identical conditions, as expected from the catalytic assays described above and CV studies.
The stability of 2 under electrocatalytic conditions was studied by controlled potential coulometry in combination with FTIR spectroscopy, where a solution of 2 was electrolyzed at −1.7 V in the presence of excess Cl2CHCOOH. The production of H2 gas was verified by GC and a total TON of ≈15 was estimated based on the amount of charge passed through the system, before catalysis was stopped after about 1 h (ESI Fig. S12†). FTIR spectra recorded during the reaction showed that approximately 40% of complex 2 remained after 1 h. Moreover, a new peak appeared at 2069 cm−1 that increased in intensity during the first 30 min of the reaction before disappearing (ESI Fig. S13†). This behavior is not attributable to an intrinsic instability of the complex, as 2 remained stable in acetonitrile over the course of 2 h (ESI Fig. S1†). In the case of AcOH electrolysis at −1.8 V revealed a similar, albeit slower electrocatalytic behavior (ESI Fig. S14†).
Conclusions
We have reported an in-depth characterization of the monocyanide analogue of the [2Fe] subsite. This subfamily of [2Fe] subsite mimics, featuring one or more cyanide ligands, has received renewed interest as it has been shown that they can be introduced into the active site of [FeFe]-hydrogenases to generate “artificial” or “semi-synthetic” enzymes.In summary, the basic structural and spectroscopic properties of complex 2 are strikingly similar to those of the pdt bridged complex 3. Still, the presence of the nitrogen bridgehead atom in 2 opens up new venues for interactions with protons, which allows the complex to act as a catalyst for proton reduction, a very rare property among cyanide bearing mimics of the [2Fe] subsite. However, considering the high activity reported for 2 when inserted into the enzyme it is rather surprising that the first reduction process is shifted by at least 400 mV towards more anodic potentials compared to its dicyanide analogue, 1. Truly this underscores the effect of the protein framework in tuning the electron donating capacity of the cyanide ligands.
Still, the catalytic capacity of 2 provides a first explanation as to why this complex, but not 3, is capable of generating highly active artificial hydrogenases, and highlights the importance of the bridgehead nitrogen. Moreover, our capacity to selectively protonate either the cyanide ligand or the bridgehead nitrogen appears to result in two distinct mechanisms for proton reduction, which is currently under further investigation.
Acknowledgements
Dr Andreas Orthaber and Dr Edgar Mijangos at Uppsala University are gratefully acknowledged for their assistance in crystallography and electrochemistry experiments, respectively.The Swedish Research Council, VR (contract no. 621-2014-5670), The Swedish Research Council for Environment, Agricultural Sciences and Spatial Planning, Formas (contract no. 213-2014-880), the foundation Kung Carl XVI Gustafs 50-års-fond för vetenskap, miljö och teknik and the Wenner-Gren foundations are gratefully acknowledged for funding.
Notes and references
- J. W. Peters, W. N. Lanzilotta, B. J. Lemon and L. C. Seefeldt, Science, 1998, 282, 1853–1858 CrossRef CAS PubMed.
- Y. Nicolet, A. L. de Lacey, X. Vernede, V. M. Fernandez, E. C. Hatchikian and J. C. Fontecilla-Camps, J. Am. Chem. Soc., 2001, 123, 1596–1601 CrossRef CAS PubMed.
- A. Silakov, B. Wenk, E. Reijerse and W. Lubitz, Phys. Chem. Chem. Phys., 2009, 11, 6592–6599 RSC.
- G. Berggren, A. Adamska, C. Lambertz, T. R. Simmons, J. Esselborn, M. Atta, S. Gambarelli, J. M. Mouesca, E. Reijerse, W. Lubitz, T. Happe, V. Artero and M. Fontecave, Nature, 2013, 499, 66–69 CrossRef CAS PubMed.
- T. R. Simmons, G. Berggren, M. Bacchi, M. Fontecave and V. Artero, Coord. Chem. Rev., 2014, 270–271, 127–150 CrossRef CAS.
- C. Tard and C. J. Pickett, Chem. Rev., 2009, 109, 2245–2274 CrossRef CAS PubMed.
- M. Schmidt, S. M. Contakes and T. B. Rauchfuss, J. Am. Chem. Soc., 1999, 121, 9736–9737 CrossRef CAS.
- F. Gloaguen, J. D. Lawrence, M. Schmidt, S. R. Wilson and T. B. Rauchfuss, J. Am. Chem. Soc., 2001, 123, 12518–12527 CrossRef CAS PubMed.
- J. D. Lawrence, H. Li, T. B. Rauchfuss, M. Bénard and M.-M. Rohmer, Angew. Chem., Int. Ed., 2001, 40, 1768–1771 CrossRef CAS.
- F. Gloaguen, J. D. Lawrence and T. B. Rauchfuss, J. Am. Chem. Soc., 2001, 123, 9476–9477 CrossRef CAS PubMed.
- E. J. Lyon, I. P. Georgakaki, J. H. Reibenspies and M. Y. Darensbourg, Angew. Chem., Int. Ed., 1999, 38, 3178–3180 CrossRef CAS.
- A. Le Cloirec, S. C. Davies, D. J. Evans, D. L. Hughes, C. J. Pickett, S. P. Best and S. Borg, Chem. Commun., 1999, 2285–2286 RSC.
- J. A. Wright, L. Webster, A. Jablonskyte, P. M. Woi, S. K. Ibrahim and C. J. Pickett, Faraday Discuss., 2011, 148, 359–371 RSC.
- H. Li and T. B. Rauchfuss, J. Am. Chem. Soc., 2002, 124, 726–727 CrossRef CAS PubMed.
- L.-C. Song, Z.-Y. Yang, H.-Z. Bian and Q.-M. Hu, Organometallics, 2004, 23, 3082–3084 CrossRef CAS.
- J. Esselborn, C. Lambertz, A. Adamska-Venkatesh, T. Simmons, G. Berggren, J. Noth, J. Siebel, A. Hemschemeier, V. Artero, E. Reijerse, M. Fontecave, W. Lubitz and T. Happe, Nat. Chem. Biol., 2013, 9, 607–609 CrossRef CAS PubMed.
- R. Gilbert-Wilson, J. F. Siebel, A. Adamska-Venkatesh, C. C. Pham, E. Reijerse, H. Wang, S. P. Cramer, W. Lubitz and T. B. Rauchfuss, J. Am. Chem. Soc., 2015, 137, 8998–9005 CrossRef CAS PubMed.
- J. F. Siebel, A. Adamska-Venkatesh, K. Weber, S. Rumpel, E. Reijerse and W. Lubitz, Biochemistry, 2015, 54, 1474–1483 CrossRef CAS PubMed.
- J. Esselborn, N. Muraki, K. Klein, V. Engelbrecht, N. Metzler-Nolte, U. P. Apfel, E. Hofmann, G. Kurisu and T. Happe, Chem. Sci., 2016, 7, 959–968 RSC.
- A. Adamska-Venkatesh, S. Roy, J. F. Siebel, T. R. Simmons, M. Fontecave, V. Artero, E. Reijerse and W. Lubitz, J. Am. Chem. Soc., 2015, 137, 12744–12747 CrossRef CAS PubMed.
- G. M. Sheldrick, Acta Crystallogr., Sect. A: Fundam. Crystallogr., 2008, 64, 112–122 CrossRef CAS PubMed.
- A. Hemschemeier, A. Melis and T. Happe, Photosynth. Res., 2009, 102, 523–540 CrossRef CAS PubMed.
- K. A. Vincent, G. J. Tilley, N. C. Quammie, I. Streeter, B. K. Burgess, M. R. Cheesman and F. A. Armstrong, Chem. Commun., 2003, 2590–2591 RSC.
- S. Roy, M. Bacchi, G. Berggren and V. Artero, ChemSusChem, 2015, 8, 3632–3638 CrossRef CAS PubMed.
- B. G. Cox, Acids and Bases - Solvent Effects on Acid-Base Strength, Oxford University Press, Oxford, 2013 Search PubMed.
- V. Fourmond, P.-A. Jacques, M. Fontecave and V. Artero, Inorg. Chem., 2010, 49, 10338–10347 CrossRef CAS PubMed.
- Z. Wang, J.-H. Liu, C.-J. He, S. Jiang, B. Åkermark and L.-C. Sun, J. Organomet. Chem., 2007, 692, 5501–5507 CrossRef CAS.
Footnote |
| † Electronic supplementary information (ESI) available: Additional data concerning the crystal structure, catalytic assays and electrochemistry experiments. CCDC 1437643 for 2[Et4N]. For ESI and crystallographic data in CIF or other electronic format see DOI: 10.1039/c6dt02061e |
| This journal is © The Royal Society of Chemistry 2016 |

