 Open Access Article
Creative Commons Attribution 3.0 Unported Licence
Superstructure formation in SrBa8[BN2]6 and EuBa8[BN2]6†
Stefan
Seidel‡
a,
Tobias
Dierkes‡
b,
Thomas
Jüstel
*b,
Christopher
Benndorf
ac,
Hellmut
Eckert
*cd and
Rainer
Pöttgen
*a
aInstitut für Anorganische und Analytische Chemie, Universität Münster, Corrensstrasse 30, D-48149 Münster, Germany. E-mail: pottgen@uni-muenster.de; Fax: +49 251-83-36002
bFachbereich Chemieingenieurwesen, Fachhochschule Münster, Stegerwaldstraße 39, 48565 Steinfurt, Germany. E-mail: tj@fh-muenster.de
cInstitut für Physikalische Chemie, Universität Münster, Corrensstrasse 30, D-48149 Münster, Germany
dInstitute of Physics in Sao Carlos, University of Sao Paulo, Sao Carlos, SP 13560-590, Brazil. E-mail: eckerth@uni-muenster.de
First published on 1st July 2016
Abstract
X-ray pure samples of SrBa8[BN2]6 and EuBa8[BN2]6 were synthesized from appropriate amounts of binary nitrides (Sr3N2, Ba3N2 and BN in sealed niobium ampoules and EuN, Ba3N2 and BN in BN crucibles, respectively) at temperatures up to 1370 K. The structure of SrBa8[BN2]6 was refined from single crystal X-ray diffractometer data: Fd![[3 with combining macron]](https://www.rsc.org/images/entities/char_0033_0304.gif) m, a = 1595.1(1) pm, wR(F2) = 0.0515, 387 F2 values and 21 variables. EuBa8[BN2]6 has a lattice parameter of 1595.00(9) pm. Both nitridoborates adopt a new 2 × 2 × 2 superstructure variant of the LiCa4[BN2]3 type, realized through ordering of vacancies and Sr2+ and Eu2+ cations, respectively. The structures of SrBa8[BN2]6 and LiCa4[BN2]3 are related by a group–subgroup scheme. The Sr2+/vacancy ordering leads to an asymmetric coordination (1 × Sr2+ and 8 × Ba2+ in a distorted, mono-capped square prism) for the [BN2]3− units with B–N distances of 132 and 136 pm. Vibrational spectra of SrBa8[BN2]6 and EuBa8[BN2]6 confirm the discrete linear [BN2]3− units and 11B solid state MAS NMR spectra are compatible with single crystallographic sites for the boron atoms. In EuBa8[BN2]6 the spectra are profoundly influenced by interactions of the 11B nuclei with the unpaired electrons of the paramagnetic Eu2+ ions.
m, a = 1595.1(1) pm, wR(F2) = 0.0515, 387 F2 values and 21 variables. EuBa8[BN2]6 has a lattice parameter of 1595.00(9) pm. Both nitridoborates adopt a new 2 × 2 × 2 superstructure variant of the LiCa4[BN2]3 type, realized through ordering of vacancies and Sr2+ and Eu2+ cations, respectively. The structures of SrBa8[BN2]6 and LiCa4[BN2]3 are related by a group–subgroup scheme. The Sr2+/vacancy ordering leads to an asymmetric coordination (1 × Sr2+ and 8 × Ba2+ in a distorted, mono-capped square prism) for the [BN2]3− units with B–N distances of 132 and 136 pm. Vibrational spectra of SrBa8[BN2]6 and EuBa8[BN2]6 confirm the discrete linear [BN2]3− units and 11B solid state MAS NMR spectra are compatible with single crystallographic sites for the boron atoms. In EuBa8[BN2]6 the spectra are profoundly influenced by interactions of the 11B nuclei with the unpaired electrons of the paramagnetic Eu2+ ions.
1. Introduction
The [BN2]3− anion is one of the basic building units in nitridoborate crystal chemistry.1 A first proof for the [BN2]3− units was obtained by Goubeau and Anselment from IR spectra of Li3[BN2], Ca3[BN2]2 and Ba3[BN2]2,2 while their precise crystal structures were determined from single crystal X-ray data only much later3–10 and also the europium compound Eu3[BN2]2 was reported.11,12Phase analytical studies later on led to a series of nitridoborate halides M2[BN2]X (M = Ca, Sr, Eu; X = F, Cl, Br, I) and Ba8[BN2]5F.13–16 Depending on the metal and halide matrix, the [BN2]3− units show small distortions, i.e. two slightly different B–N distances within the unit and/or N–B–N angles slightly deviating from 180°. Extension of the crystal chemistry is also possible through the ordered replacement of the alkaline earth metal position by alkali or divalent rare earth metals. Many such nitridoborates, AM4[BN2]3 (A = Li, Na; M = Ca, Sr, Ba, Eu),17–21 have been characterized structurally. They are electron-precise nitridoborates with linear [BN2]3− units. Both series of quaternary nitridoborates have been studied intensively with respect to their IR and Raman spectra.16,22,23 Distortions (deviations from linearity) of the [BN2]3− units are readily visible in the IR spectra and the separate bands for the 10B/11B isotopologues are resolved. A comparison of the spectra of different compounds reveals a clear correlation between the force constant and the effective partial charge of the [BN2]3− anion.
Most recent studies on [BN2]3− containing nitridoborates have concerned their luminescence properties. Polycrystalline samples of Mg3[BN2]N,24 Mg8–xMx[BN2]2N4 (M = Al, Si; x = 1, 2)25 and Mg3Ga[BN2]N26 were studied with and without Eu2+ doping. These compounds show broad emission bands with orange-red to deep-red photoluminescence. In view of these interesting results we extended our work to the doping of compounds with the composition MBa8[BN2]6 (M = Sr, Eu). The structures of both nitridoborates show a 50% occupancy of the strontium/europium site in order to account for an electron precise composition.27 X-ray powder patterns of our first samples always showed additional reflections that could not be indexed on the basis of the body-centered cell, indicating superstructure formation. Herein we report on a single crystal study, revealing complete strontium/vacancy ordering within a 2 × 2 × 2 superstructure cell.
2. Experimental
Synthesis
SrBa8[BN2]6 was prepared by solid state reaction of stoichiometric quantities of Sr3N2 (Materion, 99.5%), Ba3N2 (Materion, 99.7%) and h-BN (Alfa Aesar, 99.5%). The binary nitrides were thoroughly ground in an agate mortar and arc-welded28 in a niobium container under 800 mbar of argon, which was purified by a titanium sponge at 870 K, silica gel and molecular sieves. Subsequently, the niobium container was sealed in an evacuated silica tube for oxidation protection and heated at 1370 K for two hours, followed by slow cooling to room temperature at a rate of 20 K h−1. The slightly yellowish sample was well crystallized and contained small transparent single crystalline platelets suitable for structure determination.EuN, Ba3N2 and BN were used in stoichiometric ratios for the synthesis of polycrystalline EuBa8[BN2]6. EuN was synthesized from europium metal (Treibacher, 99.9%), firstly preparing the hydride at 620 K for 2 h in a mixture of argon and hydrogen (Westfalen AG, Ar/W35), followed by subsequent nitridation under N2 (Westfalen AG, 5.0) at 770 K for 4 h. The starting materials were thoroughly ground in an agate mortar. The mixture was then transferred into BN crucibles, capped with a lid and calcined at 1270 K for 4 h under nitrogen. Both gases were purified using an “oxisorb”-cartridge (Spectron), which reduces the oxygen/moisture level to below five and thirty parts per billion, respectively. Further in situ gas purification was carried out using two crucibles filled with Mischmetal placed in front of and behind the reaction vessel. EuBa8[BN2]6 was obtained as a dark purple to black polycrystalline powder, similar to LiEu4[BN2]3,21 while the respective Sr compound was almost colorless. Although these two compounds are electron precise, the [Xe]4f7 configuration of Eu2+ along with low-lying 4f–5d transitions leads to complete absorption in the visible range. Two broad absorption bands are characteristic of the interconfigurational transition from [Xe]4f7 to [Xe]4f65d1(t2g) and [Xe]4f65d1(eg) of Eu2+ in cubic crystals.29,30
Due to the moisture-sensitive nature of the precursors and the final products, all handling was carried out in a nitrogen filled glovebox from GS Glovebox Systemtechnik with H2O levels well below 50 ppm.
EDX data
The SrBa8[BN2]6 single crystal studied on the diffractometer was semi-quantitatively investigated by EDX analyses using a Zeiss EVO® MA10 scanning electron microscope in the variable pressure mode with SrF2 and BaF2 as standards. The experimentally observed strontium : barium ratio was 21 ± 2 at% : 79 ± 2 at%, in close agreement with the ideal composition. The light elements could not be analysed owing to the limited instrument resolution. No impurity elements heavier than sodium were observed.X-ray diffraction
The polycrystalline SrBa8[BN2]6 and EuBa8[BN2]6 samples were characterized by X-ray powder diffraction using a Guinier camera equipped with an image plate system (Fujifilm, BAS-1800) using CuKα1 radiation and α-quartz (a = 491.30, c = 540.46 pm) as an internal standard. The complete patterns could be indexed on the basis of large F-centred cubic cells and least squares refinements resulted in the lattice parameters of a = 1595.1(1) pm for SrBa8[BN2]6 and a = 1595.00(9) pm for EuBa8[BN2]6. Correct indexing of the patterns was ensured through intensity calculations using the LazyPulverix routine.31 The powder pattern of SrBa8[BN2]6 is exemplarily presented in Fig. 1. The corresponding pattern of the europium compound is available in the ESI.†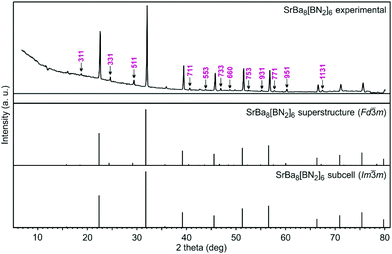 | ||
| Fig. 1 Experimental (top) and calculated (middle and bottom) X-ray powder patterns of SrBa8[BN2]6. The hkl indices of the superstructure reflections are marked in the experimental pattern. | ||
Irregularly shaped crystal fragments of SrBa8[BN2]6 were glued to thin silica fibers using beeswax. The sample was previously coated with paraffin oil (dried over sodium granules) for protection from hydrolysis. Subsequently the quality of the selected fragments was tested using Laue photographs on a Buerger camera (white molybdenum radiation, the image plate technique, Fujifilm, BAS-1800). Suitable crystals of SrBa8[BN2]6 were stored in Schlenk tubes under an argon atmosphere prior to the data collection. Intensity data of the selected crystal were collected at room temperature under a constant nitrogen gas flow using a Stoe StadiVari diffractometer equipped with a Mo microfocus source (λ = 71.073 pm) and a Pilatus 100 K detector with a hybrid-pixel-sensor. A spherical absorption correction was applied to the data set. All relevant crystallographic data and details of the data collection and evaluation are given in Table 1.
![[3 with combining macron]](https://www.rsc.org/images/entities/char_0033_0304.gif) m, Z = 8
m, Z = 8
| Formula | SrBa8[BN2]6 |
|---|---|
| Molar mass/g mol−1 | 1419.3 |
| Lattice parameter/pm (powder data) | a = 1595.1(1) |
| Cell volume/nm3 | V = 4.0585 |
| Density calc./g cm−3 | 4.65 |
| Crystal size/μm | 30 × 40 × 40 |
| Detector distance/mm | 60 |
| Exposure time/s | 43 |
| Integr. param. A, B, EMS | 7.0; −6.0; 0.030 |
| h k l range | ±23; ±23, ±23 |
| θ min, θmax/° | 2.21/32.34 |
| Linear absorption coeff./mm−1 | 17.9 |
| No. of reflections | 23![[thin space (1/6-em)]](https://www.rsc.org/images/entities/char_2009.gif) 114 114 |
| R int | 0.0198 |
| No. of independent reflections | 387 |
| Reflections used [I ≥ 3σ(I)] | 284 |
| F(000), e | 4800 |
| R factors R(F)/wR(F2) [I ≥ 3σ(I)] | 0.0237/0.0453 |
| R factors R(F)/wR(F2) [all data] | 0.0450/0.0515 |
| Data/parameters | 387/21 |
| Goodness-of-fit on F2 | 0.96 |
| Extinction coefficient | — |
| Diff. Fourier residues/e− Å−3 | −1.54/1.93 |
Structure refinement
Careful analysis of the SrBa8[BN2]6 data set revealed a face-centred cubic lattice and the systematic extinctions were in accordance with space group Fd![[3 with combining macron]](https://www.rsc.org/images/entities/char_0033_0304.gif) m. The starting atomic parameters for the structure refinement were obtained using the charge-flipping algorithm Superflip.32 The structure was subsequently refined with anisotropic displacement parameters for all atoms on F2 using Jana2006.33 As a check for the correct composition and site assignment, the occupancy parameters for all atoms were refined in separate least-squares cycles. All sites were fully occupied within three standard deviations. The setting of the structure was finally adjusted to that required for the group–subgroup scheme (vide infra). The final difference Fourier syntheses revealed no significant residues. The refined atomic positions, displacement parameters and interatomic distances are given in Tables 2–4.
m. The starting atomic parameters for the structure refinement were obtained using the charge-flipping algorithm Superflip.32 The structure was subsequently refined with anisotropic displacement parameters for all atoms on F2 using Jana2006.33 As a check for the correct composition and site assignment, the occupancy parameters for all atoms were refined in separate least-squares cycles. All sites were fully occupied within three standard deviations. The setting of the structure was finally adjusted to that required for the group–subgroup scheme (vide infra). The final difference Fourier syntheses revealed no significant residues. The refined atomic positions, displacement parameters and interatomic distances are given in Tables 2–4.
| Atom | Wyckoff position | X | y | z | U eq |
|---|---|---|---|---|---|
| Sr | 8a | 1/8 | 1/8 | 1/8 | 134(2) |
| Ba1 | 32e | 0.25833(2) | x | x | 230(1) |
| Ba2 | 16c | 0 | 0 | 0 | 251(1) |
| Ba3 | 16d | 1/2 | 1/2 | 1/2 | 244(1) |
| B | 48f | 0.3671(6) | 1/8 | 1/8 | 240(30) |
| N1 | 48f | 0.0344(5) | 3/8 | 3/8 | 243(15) |
| N2 | 48f | 0.2025(5) | 3/8 | 3/8 | 257(15) |
| Atom | U 11 | U 22 | U 33 | U 12 | U 13 | U 23 |
|---|---|---|---|---|---|---|
| Sr | 134(4) | U 11 | U 11 | 0 | 0 | 0 |
| Ba1 | 230(2) | U 11 | U 11 | −23(1) | U 12 | U 12 |
| Ba2 | 250(2) | U 11 | U 11 | −61(2) | U 12 | U 12 |
| Ba3 | 244(2) | U 11 | U 11 | −22(2) | U 12 | U 12 |
| B | 360(70) | 180(30) | U 22 | 0 | 0 | 140(30) |
| N1 | 170(30) | 280(20) | U 22 | 0 | 0 | 20(30) |
| N2 | 170(30) | 300(20) | U 22 | 0 | 0 | −10(30) |
| Sr: | 6 | N1 | 254.3(8) | N1: | 1 | B | 132(1) |
| Ba1: | 3 | N2 | 277.8(3) | 1 | Sr | 254.3(8) | |
| 3 | N1 | 303.6(1) | 2 | Ba2 | 287.3(2) | ||
| Ba2: | 6 | N1 | 287.3(2) | 2 | Ba1 | 303.6(1) | |
| Ba3: | 6 | N2 | 292.0(2) | N2: | 1 | B | 136(1) |
| B: | 1 | N1 | 132(1) | 2 | Ba1 | 277.8(3) | |
| 1 | N2 | 136(1) | 2 | Ba3 | 292.0(2) |
Further details of the structure refinement may be obtained from the Fachinformationszentrum Karlsruhe, D-76344 Eggenstein-Leopoldshafen (Germany), by quoting Registry No. CSD-431340.
IR and Raman spectroscopy
For infrared (IR) spectroscopy, KBr specimens were prepared and analysed in the range of 450–2000 cm−1 employing a Spectrum 100 FT-IR spectrometer from Perkin Elmer equipped with the Spectrum 6.0.1 data processing software. The Raman spectrum of SrBa8[BN2]6 was recorded using a Jobin Yvon HR 800 dispersive Raman spectrometer equipped with a green Nd:YAG laser (λ = 532 nm; P = 20 mW).Solid state MAS NMR spectroscopy
11B solid state MAS NMR spectra were recorded at magnetic field strengths of 4.7 and 11.7 T on NMR spectrometers at resonance frequencies of 64.166 and 160.419 MHz, respectively, using a Bruker DSX 500 spectrometer. Finely powdered nitridoborates were filled into ZrO2 MAS rotors with 4 mm diameter and spun at a frequency of 12 kHz with nitrogen gas flow to prevent hydrolysis. Chemical shifts were referenced to BF3·OEt2 as the reference sample; π/2 pulse lengths of p1 = 3.25–3.80 μs and a relaxation delay of d1 = 5 s were used in conventional single-pulse experiments. The spectra were recorded using the Bruker Topspin software34 and analyzed with the Dmfit software package.35 The experimental results are given in Table 7.3. Crystal chemistry
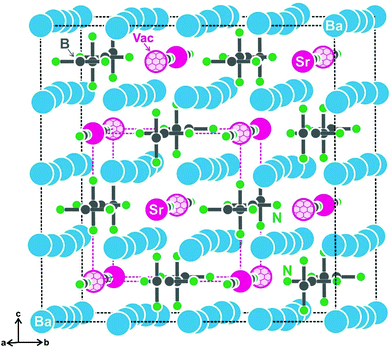
First hints for superstructure formation were already evident from the Guinier powder patterns which revealed weak additional reflections. The latter could be completely indexed with the 2 × 2 × 2 superstructure cell for both compounds. As an example, the strongest superstructure reflections for SrBa8[BN2]6 are marked with small arrows in Fig. 1. The Guinier pattern of EuBa8[BN2]6 also shows all of the expected strong superstructure reflections so that both compounds can be considered isotypic. Crystal chemical details of the subcell structure have repeatedly been reported.17–21 Herein we focus only on the crystal chemical discussion of the SrBa8[BN2]6 superstructure which was refined from single crystal data.The reason for superstructure formation lies in the electron-precise formulation. When sodium in the alkali metal compound NaBa4[BN2]3![[thin space (1/6-em)]](https://www.rsc.org/images/entities/char_2009.gif) 18 is substituted by strontium, charge balance requires half of the strontium sites to remain unoccupied. A view of the SrBa8[BN2]6 unit cell is presented in Fig. 2. The strontium-vacancy ordering is not simply realized through decentering of the body-centred cell (as is the case for the well-known example bcc vs. CsCl type36). The eight subcell strontium sites (50% occupied) around each strontium atom are ordered 4 + 4 in the superstructure, with both strontium and vacancies in a tetrahedral arrangement. This results in a doubling of the subcell in all three directions.
18 is substituted by strontium, charge balance requires half of the strontium sites to remain unoccupied. A view of the SrBa8[BN2]6 unit cell is presented in Fig. 2. The strontium-vacancy ordering is not simply realized through decentering of the body-centred cell (as is the case for the well-known example bcc vs. CsCl type36). The eight subcell strontium sites (50% occupied) around each strontium atom are ordered 4 + 4 in the superstructure, with both strontium and vacancies in a tetrahedral arrangement. This results in a doubling of the subcell in all three directions.
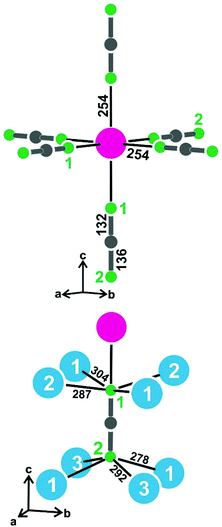
The resulting near-neighbor coordination for the strontium atoms and the [BN2]3− units is presented in Fig. 3. The strontium atoms have end-on octahedral coordination by [BN2]3− units with Sr–N distances of 254 pm, similar to the shorter Sr–N distances in the structures of Sr4N3 (255–258 pm),37 SrN (258–265 pm)38 and Sr2Si5N8 (254–272 pm).39
The most pronounced influence of the strontium-vacancy ordering is readily seen in the near-neighbor coordination of the [BN2]3− units. In alkali metal compounds like NaBa4[BN2]3,18 each [BN2]3− unit has a cation coordination in the form of a bi-capped square prism. Since only half of these sites are filled in the present strontium compound, only the N1 atoms have a strontium neighbor. Consequently we observe a lower number of cations coordinating with the N2 atoms, leading to drastically shortened N2–Ba distances of 278 and 292 pm as compared to the N1–Ba distances of 287 and 304 pm. The barium displacements are readily evident from Fig. 2. The cation ordering leads to asymmetric (but linear) [BN2]3− units with interatomic distances of 132 pm for B–N1 and 136 pm for B–N2.
We have further analyzed the superstructure model of SrBa8[BN2]6 through calculations of the bond valence sums (BVS)40 and the Chardi algorithm.41,42 The refined numerical values are listed atom by atom in Table 5. The BVS data result from empirical parameters43,44 and show strong overbonding for the strontium atoms and strong underbonding for the Ba3 atoms. The charges are much better reproduced with the point-charge approach in Chardi, nicely underlining the electron-precise description. This holds also for the covalently bonded [BN2]3− units.
The SrBa8[BN2]6 structure is related with the LiCa4[BN2]3 subcell type through a group–subgroup relation, which is presented in the Bärnighausen formalism45–47 in Fig. 4. The symmetry reduction proceeds in two steps. First we observe a decentering of the body-centred lattice through a klassengleiche transition of index 2 (k2) from Im![[3 with combining macron]](https://www.rsc.org/images/entities/char_0033_0304.gif) m to Pn
m to Pn![[3 with combining macron]](https://www.rsc.org/images/entities/char_0033_0304.gif) m. Although this symmetry reduction leads to splitting of the 8c calcium site, there is still no possibility of ordering of the strontium atoms for the title compound. Subsequently, a second klassengleiche transition of index 2 (k2) from Pn
m. Although this symmetry reduction leads to splitting of the 8c calcium site, there is still no possibility of ordering of the strontium atoms for the title compound. Subsequently, a second klassengleiche transition of index 2 (k2) from Pn![[3 with combining macron]](https://www.rsc.org/images/entities/char_0033_0304.gif) m to Fd
m to Fd![[3 with combining macron]](https://www.rsc.org/images/entities/char_0033_0304.gif) m upon doubling of the unit cell in all three directions proceeds and the splitting of the 2a site into two eightfold sites in the superstructure allows for strontium-vacancy ordering. The klassengleiche transitions lead to the superstructure reflections observed in the powder patterns. The symmetry reductions also lead to free x parameters for the Ba1 and B atoms as well as two different x parameters for N1 and N2.
m upon doubling of the unit cell in all three directions proceeds and the splitting of the 2a site into two eightfold sites in the superstructure allows for strontium-vacancy ordering. The klassengleiche transitions lead to the superstructure reflections observed in the powder patterns. The symmetry reductions also lead to free x parameters for the Ba1 and B atoms as well as two different x parameters for N1 and N2.
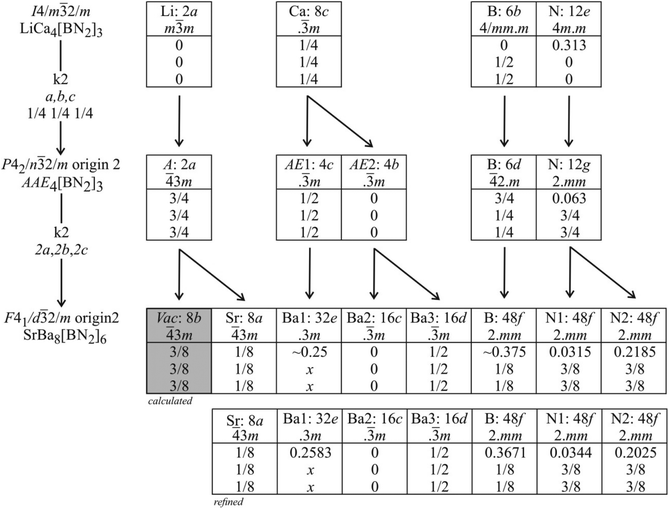 | ||
Fig. 4 Group–subgroup scheme in the Bärnighausen formalism45–47 for the structures of LiCa4[BN2]3 and SrBa8[BN2]6. The indices for the klassengleiche (k) symmetry reductions, the unit cell transformations, and the evolution of the atomic parameters are given. No representative is known for the intermediate space group Pn![[3 with combining macron]](https://www.rsc.org/images/entities/char_0033_0304.gif) m. The alkali and alkaline earth sites for that intermediate are symbolized by A and AE, respectively. m. The alkali and alkaline earth sites for that intermediate are symbolized by A and AE, respectively. | ||
Ordering of cation vacancies has also been determined for the β-Ca3[BN2]2 structure,7 but with a different symmetry reduction. This superstructure variant crystallizes with the orthorhombic space group Cmce. The smaller calcium atoms and the different pattern of vacancy ordering lead to significant tilts and bending of the [BN2]3− units. For comparison, projections of the SrBa8[BN2]6 and β-Ca3[BN2]2 structures are presented in Fig. 5.
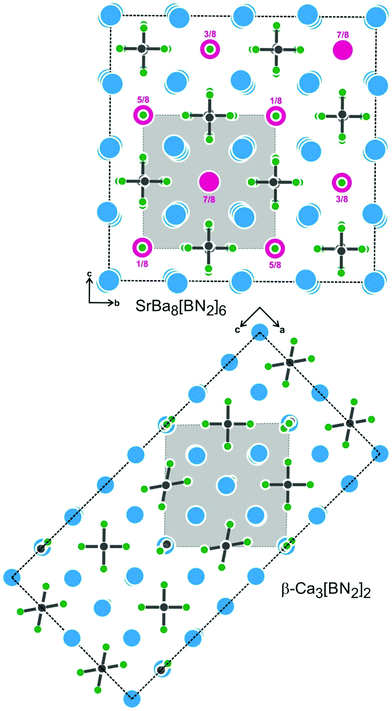 | ||
| Fig. 5 Projections of the SrBa8[BN2]6 and β-Ca3[BN2]2 structures. Heights of the strontium atoms in SrBa8[BN2]6 are indicated. Both superstructures are a consequence of vacancy ordering. For further details of the vacancy ordering in β-Ca3[BN2]2, we refer the reader to ref. 7. | ||
4. Vibrational spectroscopy
Linear [BN2]3− nitridoborate anions are the characteristic structural units of SrBa8[BN2]6 and EuBa8[BN2]6. The numerous vibrational modes can be easily detected in either IR and/or Raman spectra. The actual number of modes that can be expected in the solid, dependent on the exact symmetry of the dumbbell-shaped [BN2]3− units, has been discussed in detail before for several similar compounds.2,9,12,23,48Fig. 6 depicts the IR spectra of SrBa8[BN2]6 and EuBa8[BN2]6. The two isotypic nitridoborates exhibit almost identical spectra. The numerical values of the frequencies are listed in Table 6. IR-active, characteristic anti-symmetric stretching modes υ2 of the B–N bonds can be observed in the range between 1600 and 1700 cm−1 (band splitting is a consequence of factor group splitting) and lower-lying doubly degenerate deformation modes υ3 from 500 to 650 cm−1. Additional splitting of bands is due to the presence of 11B and 10B isotopologues at the natural abundance ratio of 80![[thin space (1/6-em)]](https://www.rsc.org/images/entities/char_2009.gif) :
:![[thin space (1/6-em)]](https://www.rsc.org/images/entities/char_2009.gif) 20. The assumption of asymmetric [BN2]3− units as confirmed by the crystallographic data is underlined by the presence of the symmetric ν1 stretching mode in the FTIR spectrum. Further confirmation of the broken linear symmetry, due to different B–N bond lengths, is given by the doublet splitting of the ν3 deformation modes.
20. The assumption of asymmetric [BN2]3− units as confirmed by the crystallographic data is underlined by the presence of the symmetric ν1 stretching mode in the FTIR spectrum. Further confirmation of the broken linear symmetry, due to different B–N bond lengths, is given by the doublet splitting of the ν3 deformation modes.
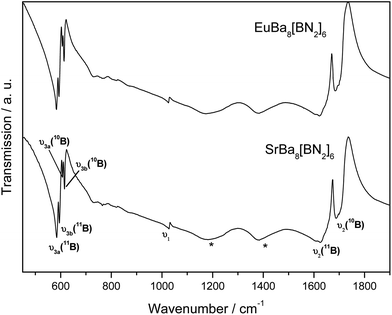 | ||
| Fig. 6 IR spectra of SrBa8[BN2]6 and EuBa8[BN2]6. Relevant modes are indicated. For numerical values see Table 6. The modes marked with asterisks result from slow decomposition of the samples. | ||
| υ 1 | υ 2 (11B) | υ 2 (10B) | υ 3a (11B) | υ 3b (11B) | υ 3a (10B) | υ 3b (10B) | |
|---|---|---|---|---|---|---|---|
| SrBa8[BN2]6 | 1028 | 1625 | 1687 | 585 | 595 | 607 | 615 |
| EuBa8[BN2]6 | 1025 | 1622 | 1684 | 583 | 593 | 606 | 613 |
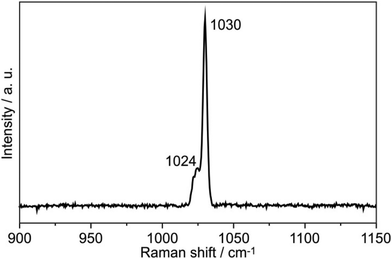
The Raman spectrum of SrBa8[BN2]6 is presented in Fig. 7. EuBa8[BN2]6 was also tested; however, similarly to LiEu4[BN2]3![[thin space (1/6-em)]](https://www.rsc.org/images/entities/char_2009.gif) 23 it decomposed during laser exposure. The symmetric B–N stretching splits into two bands in the Raman spectrum at 1024 and 1030 cm−1, similar to the situation in Ca3[BN2]I48 that also shows two different B–N bond lengths of 139.3 and 136.9 pm.
23 it decomposed during laser exposure. The symmetric B–N stretching splits into two bands in the Raman spectrum at 1024 and 1030 cm−1, similar to the situation in Ca3[BN2]I48 that also shows two different B–N bond lengths of 139.3 and 136.9 pm.
5. 11B solid state MAS NMR spectroscopy
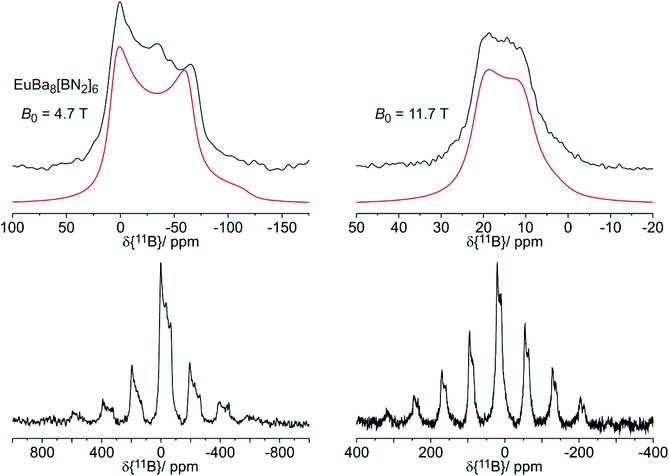
The 11B solid state MAS NMR spectra of the nitridoborates SrBa8[BN2]6 and EuBa8[BN2]6 are shown in Fig. 8 and 9, respectively. Consistent with the crystal structure the spectra show only one signal whose line shape is strongly influenced by second order quadrupolar perturbations induced by the interaction of the 11B nuclei with the electric field gradient resulting from their non-spherical electronic environment. Table 7 summarizes the quadrupolar coupling constant CQ and the asymmetry parameter ηQ obtained by fitting the line shape of the central transition. Consistent with the C∞v local symmetry at the boron site, the field gradient is found to be close to axially symmetric in both compounds. The spectra of the Eu2+ compound are profoundly influenced by the proximity of the unpaired 4f-electrons to the 11B nuclei. This paramagnetic interaction manifests itself in (1) a broadening effect imposed on the second-order quadrupolar powder pattern characterizing the central 1/2 ↔ −1/2 transition and (2) the appearance of intense MAS sidebands, reflecting strong inhomogeneous spectral broadening effects. The latter arise from the anisotropic effective local field generated at the site of the 11B nuclei by proximal electron spins, which are rapidly fluctuating between their Zeeman states. For the quadrupolar 11B nuclei this interaction is superimposed on the anisotropy of the nuclear electric quadrupolar interaction affecting the ±1/2 ↔ ±3/2 “satellite” Zeeman transitions. Fig. 9 shows the spinning sideband profiles at the external magnetic flux densities of 4.7 and 11.7 T. A detailed analysis of these sideband profiles requires additional experimental inputs from EPR spectroscopy and will be presented in a forthcoming study.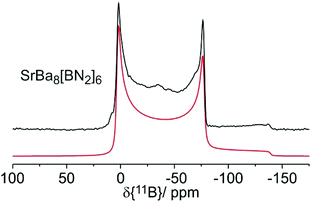 | ||
| Fig. 8 11B MAS NMR spectrum of SrBa8[BN2]6 with simulation (red line) recorded at an external magnetic flux density of B0 = 4.7 T and a spinning frequency of 12 kHz. | ||
| δ iso | C Q | η CQ | B 0 | LB | |
|---|---|---|---|---|---|
| SrBa8[BN2]6 | 26.6 | 3.30 | 0.02 | 4.7 | 2.0 |
| EuBa8[BN2]6 | 26.6 | 3.10 | 0.03 | 4.7 | 15.2 |
| 24.3 | 3.10 | 0.03 | 11.7 | 7.0 |
6. Conclusions and outlook
High-resolution powder and single crystal X-ray diffraction data confirm full cation ordering in the nitridoborates SrBa8[BN2]6 and EuBa8[BN2]6. Both compounds crystallize with a new superstructure that derives from the LiCa4[BN2]3 type through a group–subgroup scheme. The cation ordering leads to asymmetric linear [BN2]3− units with B–N distances of 132 and 136 pm. This is underlined by vibrational spectroscopy. The 11B solid state MAS NMR spectra confirm the presence of single boron atomic sites in both compounds, whose electronic environment is characterized by axially symmetric electric field gradients. The spectrum of the Eu compound is additionally influenced by strong anisotropic paramagnetic interactions, resulting in characteristic field-dependent spectra. SrBa8[BN2]6 is an excellent host structure for doping with divalent or trivalent rare earth cations. Detailed optical, solid state NMR and ESR studies will be published shortly.Acknowledgements
We thank Dipl.-Ing. U. Ch. Rodewald for the collection of the single crystal intensity data.References
- B. Blaschkowski, H. Jing and H.-J. Meyer, Angew. Chem., Int. Ed., 2002, 41, 3322–3336 CrossRef CAS.
- J. Goubeau and W. Anselment, Z. Anorg. Allg. Chem., 1961, 310, 248–260 CrossRef CAS.
- H. Yamane, S. Kikkawa, H. Horiuchi and M. Koizumi, J. Solid State Chem., 1986, 65, 6–12 CrossRef CAS.
- H. Yamane, S. Kikkawa and M. Koizumi, J. Solid State Chem., 1987, 71, 1–11 CrossRef CAS.
- R. C. DeVries and J. F. Fleischer, Mater. Res. Bull., 1969, 4, 433–441 CrossRef CAS.
- M. Wörle, H. Meyer zu Altenschildesche and R. Nesper, J. Alloys Compd., 1998, 264, 107–114 CrossRef.
- M. Häberlen, J. Glaser and H.-J. Meyer, J. Solid State Chem., 2005, 178, 1478–1487 CrossRef.
- H. Womelsdorf and H.-J. Meyer, Z. Anorg. Allg. Chem., 1994, 620, 262–265 CrossRef CAS.
- O. Reckeweg, F. J. DiSalvo and M. Somer, J. Alloys Compd., 2003, 361, 102–107 CrossRef CAS.
- M. Häberlen, Synthesen, Kristallstrukturen und Phasenübergänge der Nitridoborate der Erdalkalimetalle, Dissertation, Universität Tübingen, Germany, 2006 Search PubMed.
- W. Carillo-Cabrera, M. Somer, K. Peters and H. G. von Schnering, Z. Kristallogr. – New Cryst. Struct., 2001, 216, 43–44 Search PubMed.
- M. Somer, C. Gül, R. Müllmann, B. D. Mosel, R. K. Kremer and R. Pöttgen, Z. Anorg. Allg. Chem., 2004, 630, 389–393 CrossRef CAS.
- F. E. Rohrer, Nitridoborate und Nitridoborat-Halogenide von Erdalkali- und Seltenerdmetallen, Dissertation 12468, ETH Zürich, Switzerland, 1997 Search PubMed.
- F. E. Rohrer and R. Nesper, J. Solid State Chem., 1999, 142, 187–191 CrossRef CAS.
- F. E. Rohrer and R. Nesper, J. Solid State Chem., 1999, 142, 192–198 CrossRef CAS.
- I. Kokal, U. Aydemir, Yu. Prots, W. Schnelle, L. Akselrud, P. Höhn and M. Somer, Z. Kristallogr., 2011, 225, 633–639 CrossRef.
- M. Somer, U. Herterich, J. Curda, K. Peters and H. G. von Schnering, Z. Kristallogr., 1994, 209, 182 CAS.
- M. Somer, U. Herterich, J. Curda, K. Peters and H. G. von Schnering, Z. Kristallogr., 1995, 210, 529 CrossRef CAS.
- M. Somer, W. Carillo-Cabrera, K. Peters and H. G. von Schnering, Z. Kristallogr. – New Cryst. Struct., 2000, 215, 209 CAS.
- M. Somer, U. Herterich, J. Curda, K. Peters and H. G. von Schnering, Z. Kristallogr., 1996, 211, 54 CAS.
- J. Curda, U. Herterich, K. Peters, M. Somer and H. G. von Schnering, Z. Kristallogr., 1994, 209, 618 CAS.
- M. Somer, Z. Naturforsch., 1991, 46b, 1664–1668 Search PubMed.
- M. Somer, U. Herterich, J. Čurda, W. Carillo-Cabrera, A. Zürn, K. Peters and H. G. von Schnering, Z. Anorg. Allg. Chem., 2000, 626, 625–633 CrossRef CAS.
- J. Schölch, T. Dierkes, D. Enseling, M. Ströbele, T. Jüstel and H.-J. Meyer, Z. Anorg. Allg. Chem., 2015, 641, 803–808 CrossRef.
- M. Ströbele, K. Dolabdjian, D. Enseling, D. Dutczak, B. Mihailova, T. Jüstel and H.-J. Meyer, Eur. J. Inorg. Chem., 2015, 1716–1725 CrossRef.
- D. Dutczak, K. M. Wurst, M. Ströbele, D. Enseling, T. Jüstel and H.-J. Meyer, Eur. J. Inorg. Chem., 2016, 861–866 CrossRef CAS.
- S. S. Öztürk, I. Kokal and M. Somer, Z. Kristallogr. – New Cryst. Struct., 2005, 220, 303–304 Search PubMed.
- R. Pöttgen, Th. Gulden and A. Simon, GIT Labor-Fachz., 1999, 43, 133–136 Search PubMed.
- N. Yamashita, J. Electrochem. Soc., 1993, 140, 840–843 CrossRef CAS.
- Y. Nakao, J. Phys. Soc. Jpn., 1980, 48, 534–541 CrossRef CAS.
- K. Yvon, W. Jeitschko and E. Parthé, J. Appl. Crystallogr., 1977, 10, 73–74 CrossRef.
- L. Palatinus and G. Chapuis, J. Appl. Crystallogr., 2007, 40, 786–790 CrossRef CAS.
- V. Petříček, M. Dušek and L. Palatinus, Z. Kristallogr., 2014, 229, 345–352 Search PubMed.
- Bruker Corporation, Topspin (Version 2.1), Karlsruhe, 2008 Search PubMed.
- D. Massiot, F. Fayon, M. Capron, I. King, S. Le Calvé, B. Alonso, J.-O. Durand, B. Bujoli, Z. Gan and G. Hoatson, Magn. Reson. Chem., 2002, 40, 70–76 CrossRef CAS.
- R. Pöttgen, Z. Anorg. Allg. Chem., 2014, 640, 869–891 CrossRef.
- Yu. Prots, G. Auffermann, M. Tovar and R. Kniep, Angew. Chem., Int. Ed., 2002, 114, 2392–2394 CrossRef.
- G. Auffermann, Yu. Prots and R. Kniep, Angew. Chem., 2001, 113, 565–567 CrossRef.
- T. Schlieper, W. Milius and W. Schnick, Z. Anorg. Allg. Chem., 1995, 621, 1380–1384 CrossRef CAS.
- I. D. Brown, Chem. Soc. Rev., 1978, 7, 359–376 RSC.
- R. Hoppe, S. Voigt, H. Glaum, J. Kissel, H. P. Müller and K. Bernet, J. Less-Common Met., 1989, 156, 105–122 CrossRef CAS.
- M. Nespolo and B. Guillot, J. Appl. Crystallogr., 2016, 49, 317–321 CrossRef CAS.
- I. D. Brown and D. Altermatt, Acta Crystallogr., 1985, B41, 244–247 CAS.
- N. E. Brese and M. O'Keeffe, Acta Crystallogr., 1991, B47, 192–197 CAS.
- H. Bärnighausen, Commun. Math. Chem., 1980, 9, 139–175 Search PubMed.
- U. Müller, Z. Anorg. Allg. Chem., 2004, 630, 1519–1537 CrossRef.
- U. Müller, Symmetriebeziehungen zwischen verwandten Kristallstrukturen, Vieweg + Teubner Verlag, Wiesbaden, 2012 Search PubMed.
- T. Ezgi Toros, M. Yahyaoglu, U. Aydemir, C. Drathen, L. Akselrud, Y. Prots, P. Höhn and M. Somer, Z. Anorg. Allg. Chem., 2015, 641, 2014–2019 CrossRef CAS.
Footnotes |
| † Electronic supplementary information (ESI) available. See DOI: 10.1039/C6DT02029A |
| ‡ These authors contributed equally to this work. |
| This journal is © The Royal Society of Chemistry 2016 |

