DOI:
10.1039/C6DT01298A
(Paper)
Dalton Trans., 2016,
45, 11071-11100
Ba-filled Ni–Sb–Sn based skutterudites with anomalously high lattice thermal conductivity†‡
Received
4th April 2016
, Accepted 29th May 2016
First published on 21st June 2016
Abstract
Novel filled skutterudites BayNi4Sb12−xSnx (ymax = 0.93) have been prepared by arc melting followed by annealing at 250, 350 and 450 °C up to 30 days in vacuum-sealed quartz vials. Extension of the homogeneity region, solidus temperatures and structural investigations were performed for the skutterudite phase in the ternary Ni–Sn–Sb and in the quaternary Ba–Ni–Sb–Sn systems. Phase equilibria in the Ni–Sn–Sb system at 450 °C were established by means of Electron Probe Microanalysis (EPMA) and X-ray Powder Diffraction (XPD). With rather small cages Ni4(Sb,Sn)12, the Ba–Ni–Sn–Sb skutterudite system is perfectly suited to study the influence of filler atoms on the phonon thermal conductivity. Single-phase samples with the composition Ni4Sb8.2Sn3.8, Ba0.42Ni4Sb8.2Sn3.8 and Ba0.92Ni4Sb6.7Sn5.3 were used to measure their physical properties, i.e. temperature dependent electrical resistivity, Seebeck coefficient and thermal conductivity. The resistivity data demonstrate a crossover from metallic to semiconducting behaviour. The corresponding gap width was extracted from the maxima in the Seebeck coefficient data as a function of temperature. Single crystal X-ray structure analyses at 100, 200 and 300 K revealed the thermal expansion coefficients as well as Einstein and Debye temperatures for Ba0.73Ni4Sb8.1Sn3.9 and Ba0.95Ni4Sb6.1Sn5.9. These data were in accordance with the Debye temperatures obtained from the specific heat (4.4 K < T < 140 K) and Mössbauer spectroscopy (10 K < T < 290 K). Rather small atom displacement parameters for the Ba filler atoms indicate a severe reduction in the “rattling behaviour” consistent with the high levels of lattice thermal conductivity. The elastic moduli, collected from Resonant Ultrasonic Spectroscopy ranged from 100 GPa for Ni4Sb8.2Sn3.8 to 116 GPa for Ba0.92Ni4Sb6.7Sn5.3. The thermal expansion coefficients were 11.8 × 10⁻⁶ K−1 for Ni4Sb8.2Sn3.8 and 13.8 × 10⁻⁶ K−1 for Ba0.92Ni4Sb6.7Sn5.3. The room temperature Vickers hardness values vary within the range from 2.6 GPa to 4.7 GPa. Severe plastic deformation via high-pressure torsion was used to introduce nanostructuring; however, the physical properties before and after HPT showed no significant effect on the materials thermoelectric behaviour.
1. Introduction
Several classes of thermoelectric materials have been investigated for renewable power generation applications, including tellurides,1,2 half-Heuslers,3,4 silicides5 and skutterudites. Skutterudite-based materials have attracted considerable research interest since a long time6 because they show a large variety of physical properties. However, for commercial thermoelectric applications,7 high figures of merit| |  | (1.1) |
for the p-type as well as for n-type configuration are a precondition.8–11 Skutterudites crystallize in the cubic CoAs3 structure (space group Im![[3 with combining macron]](https://www.rsc.org/images/entities/char_0033_0304.gif) ) with the general formula FxT4M12, where T is a transition metal of the VIIIth group located in position 8c (¼, ¼, ¼) and M is a pnictogen, chalcogen or an element of the IVth main-group in the Wyckoff site 24g (0, y, z). These atoms form a cage-like structure with a large icosahedral void at the 2a site (0, 0, 0), which may accommodate various filler atoms F, including alkaline and alkaline earth metals, lanthanoids, actinoids, as well as halogens or in particular cases Y, Hf,12,13 Pb and Sn.14–17 A ternary skutterudite in the system Ni–Sn–Sb was first reported by Grytsiv et al.18 who defined a wide homogeneity range at 250 °C and 350 °C by establishing the isothermal sections in the Sn–Sb–NiSb–Ni3Sn2 subsystem at these temperatures. Investigations by Mishra et al.19 in the Sn-rich part of the Ni–Sn–Sb phase diagram suggested that the phase equilibria determined by Grytsiv et al.18 lies within 10 °C above or below the declared temperatures.
) with the general formula FxT4M12, where T is a transition metal of the VIIIth group located in position 8c (¼, ¼, ¼) and M is a pnictogen, chalcogen or an element of the IVth main-group in the Wyckoff site 24g (0, y, z). These atoms form a cage-like structure with a large icosahedral void at the 2a site (0, 0, 0), which may accommodate various filler atoms F, including alkaline and alkaline earth metals, lanthanoids, actinoids, as well as halogens or in particular cases Y, Hf,12,13 Pb and Sn.14–17 A ternary skutterudite in the system Ni–Sn–Sb was first reported by Grytsiv et al.18 who defined a wide homogeneity range at 250 °C and 350 °C by establishing the isothermal sections in the Sn–Sb–NiSb–Ni3Sn2 subsystem at these temperatures. Investigations by Mishra et al.19 in the Sn-rich part of the Ni–Sn–Sb phase diagram suggested that the phase equilibria determined by Grytsiv et al.18 lies within 10 °C above or below the declared temperatures.
Numerous reports (see for example ref. 18, 20–25) describe mixed occupancies for all three crystallographic sites (24g, 8c, 2a). For Ni–Sn–Sb based skutterudites, the structure with Ni-atoms fully occupying the 8c site seems to be stabilized by a random distribution of Sb and Sn atoms in the 24g position because in the binary systems, Ni-{Sn, P, As, Sb}, only the skutterudite NiP3 exists as a high temperature modification.26,27 A special situation occurs for Sn-atoms, which may occupy the 24g site, but may simultaneously enter the 2a site of the same compound reaching filling levels of 0.21 in this position.18 Ternary and isotypic quaternary skutterudites with Eu and Yb as filler elements have been characterised by their physical properties as well as by Raman and Mössbauer spectroscopy, unambiguously revealing that a small amount of Sn is able to enter the 2a (0, 0, 0) site.18 The filler atom in 2a in most skutterudites is loosely bound in the large icosahedral cage and is generally believed to decrease the thermal conductivity of the material via rattling modes.6,28 With Ni and Sn atoms being smaller than Fe, Co and Sb, respectively, the Ni4(Sn,Sb)12 icosahedral cages are smaller in comparison to a large filler atom such as Ba (for details see section 5: the crystal structure and vibration modes of BayNi4Sb12−xSnx). Thus, the Ba–Ni–Sn–Sb skutterudite system may become a model system to study the influence of filler atoms on the phonon thermal conductivity.
In addition, not much information is available on the thermal stability of Ni-skutterudites. To the best of our knowledge, the melting temperatures were determined for only two binary skutterudites, CoAs3![[thin space (1/6-em)]](https://www.rsc.org/images/entities/char_2009.gif) 29 and CoSb3,30 and there are no data either on the influence of the filler on the melting points or on the thermal stability of ternary or multi-component skutterudites.
29 and CoSb3,30 and there are no data either on the influence of the filler on the melting points or on the thermal stability of ternary or multi-component skutterudites.
The current article will focus on a series of aspects outlined below:
(i) The Ni–Sn–Sb isothermal section at 450 °C and the extension of the ternary skutterudite phase Ni4Sb12−xSnx in comparison with data reported by Grytsiv et al.18
(ii) The temperature dependent filling levels of BayNi4Sb12−xSnx.
(iii) The solidus surface for the ternary and quaternary skutterudites, Ni4Sb12−xSnx and BayNi4Sb12−xSnx, in dependence of their composition.
(iv) The structure of BayNi4Sb12−xSnx determined by single crystal X-ray diffraction.
(v) Physical property measurements such as temperature dependent resistivities, thermal conductivities and Seebeck coefficients of three single-phase samples: Ni4Sb8.2Sn3.8, Ba0.42Ni4Sb8.24Sn3.8 and Ba0.92Ni4Sb6.7Sn5.3.
(vi) The effect of Severe Plastic Deformation (SPD) via High-Pressure Torsion on the material.
(vii) Mechanical properties such as thermal expansion, elastic moduli and Vicker's hardness of Ni4Sb8.2Sn3.8, Ba0.42Ni4Sb8.3Sn3.8 and Ba0.92Ni4Sb6.7Sn5.3.
(viii) A discussion on the thermoelectric behaviour in terms of the electron and phonon mean free paths and the influence of Ba-filler level on the lattice thermal conductivity.
2. Experimental
Sample preparation
Starting materials were used in the form of elemental pieces of Ba, Ni, Sb and Sn, all of 99.95 mass% minimum purity. Samples suitable for constitutional analysis were prepared by one of the following optimised melting reactions directly gaining the ternary Ni4SbxSn12−x alloys, whereas for the quaternary skutterudites, the filler element was added in a second reaction step:
(i) Bulk alloys, each with a total weight of 1–2 g, were synthesized via a Ni4SbxSn12−x master alloy by argon arc melting of metal ingots on a water-cooled copper hearth, adding the filler element to the ternary alloy using the same reaction method.
(ii) Samples with the nominal composition Ni4SbxSn12−x (1–2 g) were prepared from stoichiometric amounts of high purity Sb and Sn pieces and fine Ni wire. After mixing, the material was sealed into evacuated quartz tubes, heated to 980 °C, kept in the liquid state for half an hour prior to quenching the capsules in air. For the quaternary samples, the whole procedure was repeated, adding pieces of Ba to the ternary master alloys. Total weight losses of 1–3 mass% that occurred during sample preparation were attributed to the high vapour pressures of Sb and Ba and were compensated by adding an additional 3–5 mass% of Ba and Sb. All the samples were then sealed in evacuated quartz tubes, annealed at 250, 350 or 450 °C for 3 to 30 days for equilibration before quenching in cold water.
Large single-phase samples (6–8 g) in cylindrical form for the study of their physical properties were prepared following either route (i) or (ii); the specimens were further ground to a grain size below at least 100 μm inside an Argon glove box using a WC mortar followed by ball-milling in a Fritsch planetary mill (Pulverisette 4) with WC-balls of 1.6 mm, rotation speed 250 and ratio of −2.5 for 2 h to gain a nanocrystalline powder. These powders were then loaded into 1 cm diameter graphite cartridges for hot-pressing under 1 bar of 5N-argon in a FTC uniaxial hotpress system (HP W 200/250 2200-200-KS).
The Sb-rich specimens, Ni4Sb8.2Sn3.8 and Ba0.42Ni4Sb8.2Sn3.8, were directly prepared by hot pressing at 450 °C, resulting in a densely compacted single-phase material.
For the Sn-rich sample, Ba0.92Ni4Sb6.7Sn5.3, a modified preparation method had to be chosen. 5–10 mass% of extra Sb and Sn were added from the very beginning of the synthesis. The ball-milled powder was pre-compacted and annealed under argon at 450 °C overnight inside the hotpress, followed by hotpressing at 430 °C in order to squeeze out the surplus Sb2Sn3.
Small single crystals suitable for temperature dependent X-ray structure analysis were obtained from flux techniques: Sn-rich single crystals of Ba0.95Ni4Sb6.1Sn5.9 were prepared from Sn flux, Sb-rich Ba0.73Ni4Sb8.1Sn3.9 single crystals from Sb2Sn3 flux by heating the starting materials with compositions 2Ba–12Ni–Sb22.5–Sn63.5 and 2Ba–8Ni–45Sb–45Sn, respectively, to 950 °C to reach the liquid state followed by cooling at a rate of 12 °C h−1 to 450 °C. The alloys were maintained at this temperature for 3 days to reach thermodynamic equilibrium. Subsequently, the samples were removed from the furnace and the Sn-rich sample was treated with hot concentrated HCl acid to dissolve the Sn-rich matrix. For the Sb-rich single crystals, the Sb2Sn3-rich matrix was removed using hot concentrated HNO3 and then the crystals were washed with cold concentrated HCl.
Sample characterisation
X-ray powder diffraction (XPD) data were collected using a Huber Guinier camera with monochromatic Cu Kα1radiation (λ = 0.154056 nm) and an image plate recording system (model G670). Pure Si (aSi = 0.5431065 nm) was used as internal standard to determine the precise lattice parameters via least-squares fitting to the indexed 2θ values employing the program STRUKTUR.31 For quantitative Rietveld refinements, we applied the program FULLPROF.32 The chemical compositions of the different specimens were extracted from electron probe microanalyses (EPMA) using energy-dispersive X-ray (EDX) spectroscopy with an INCA Penta FETx3-Zeiss SUPRA55VP equipment (Oxford Instruments).
After inspection on an AXS-GADDS texture goniometer for quality and crystal symmetry, the X-ray intensity data for the two single crystals were collected on a four-circle Nonius Kappa diffractometer with a charge-coupled device (CCD) area detector and graphite-monochromated Mo Kα radiation (λ = 0.07107 nm) at 100, 200 and 300 K under nitrogen gas. The orientation matrix and unit cell parameters were derived using the program DENZO.33 In addition to the general treatment of absorption effects using the multi-scan technique (SADABS; redundancy of integrated reflections >8), no individual absorption correction was necessary because of the regular shape and small dimensions of the crystals. Employing SHELXS-97 and SHELXL-97 software34 for the single-crystal X-ray diffraction data, the structures were successfully solved using direct methods and refined.
Using Archimedes’ principle and distilled water, the density ρs of the hot pressed samples was determined and compared to the calculated X-ray densities.
| |  | (2.1) |
where
M is the molar mass,
Z is the number of formula units per cell,
N is Avogadro's number and
V is the volume of the unit cell.
Mössbauer spectroscopy
Mössbauer spectra were obtained on a constant-acceleration spectrometer using a 300 μCi Ca121SbO3 source and a 10 mCi Ca119mSnO3 source for 121Sb- and 119Sn-Mössbauer spectroscopy, respectively. The velocity was calibrated with α-Fe at room temperature utilizing a 57Co/Rh source. All Mössbauer spectra were obtained using powder samples and the isomer shifts are with reference to InSb at 10 K and to CaSnO3 at room temperature. The significant γ-background due to the fluorescence of the source for 119Sn-Mössbauer spectroscopy was suppressed with a 50 μm Pd foil between the source and detector.
Physical property measurements
The electrical resistivity, Seebeck coefficient and thermal conductivity were measured (4 K < T < 300 K) using a homemade equipment cooled by liquid He (see ref. 35). The Seebeck coefficient and electrical resistivity above room temperature were measured simultaneously with a ULVAC-ZEM 3 (Riko, Japan) apparatus. The thermal diffusivity Dt was measured using a flash method (Flashline-3000, ANTER, USA). The thermal conductivity κ was calculated from Dt, the specific heat Cp and the density ρs employing the relationship κ = Dt·Cp·ρs. Hall data were obtained by a Quantum Design physical properties measurement system (PPMS) using a standard six-point method in a magnetic field of 9 T. Specific heat measurements from 2 to 140 K were performed on single-phase samples with masses between 2.5 g and 5 g cooled with liquid He employing an adiabatic step heating technique.
Thermal expansion measurements
The thermal expansion from 4.2 K to 300 K was measured with a miniature capacitance dilatometer36 using the tilted plate principle.37,38 For this measurement, the sample was placed in a hole of the lower ring-like silver capacitance plate, which is separated from the silver upper capacitor plate by two needle bearings. For measurement of the thermal expansion between 80 and 420 K, a dynamic mechanical analyzer DMA7 (Perkin Elmer Inc.) was employed. The sample was positioned in a parallel plate mode with a quartz rod on top of the sample and data are gained using the thermo-dilatometric analysis (TDA), see ref. 39–42.
Elastic property measurements
Resonant ultrasound spectroscopy (RUS) outlined by Migliori et al.43 was used to determine the elastic properties. For this measurement, the cylindrically shaped samples of 10 mm diameter and masses between 2.5 g and 5 g were mounted “edge-to-edge” between two piezo-transducers and were excited via a network analyser in the 100 to 500 kHz frequency range at room temperature. Macroscopically, the polycrystalline samples are isotropic and the set of eigenfrequencies gained was then fitted providing the values for the Young's modulus E and Poisson's ratio ν.
Hardness measurements
The load-independent Vickers hardness HV was determined using an Anton Paar MHT 4 microhardness tester mounted on a Reichert POLYVAR microscope evaluating all the indentation data using eqn (2.2).| |  | (2.2) |
F gives the indenter load and d is defined as| |  | (2.3) |
with d1 and d2 being the resulting diagonal lengths of the indenter, respectively.
Severe plastic deformation (SPD) via high-pressure torsion
The HPT technique is based on the use of a Bridgman anvil-type device. A thin disk-shaped sample was subjected to torsional strain in a cavity under high hydrostatic pressure between two anvils at room temperature or at elevated temperatures via induction heating. The shear strain γ is dependent on the number of revolutions n, the radius r, and the thickness t of the specimen in the following way:| |  | (2.4) |
Therefore, the cylindrical single-phase samples were cut into slices with a thickness (t) of about ∼1 mm and a diameter of 10 mm. The Sb-rich alloys were processed at 400 °C under a hydrostatic pressure of 4 GPa with 1 revolution, whereas the temperature for Sn-rich samples was only 300 °C.
DTA measurements
Melting points were determined from DTA measurements recorded on a NETZSCH STA 409 C/CD equipment. Pieces of single-phase samples weighing 500 mg to 600 mg were sealed in evacuated quartz glass crucibles. In general, three heating and three cooling curves were recorded for each sample using a scanning rate of 5 K min−1.
Crystallite size evaluation
The crystallite size was evaluated from the X-ray diffraction patterns (spectra from Cu Kα1 radiation) using the MDI JADE 6.0 software (Materials Data Inc., Liverpool, CA). This method yields the crystallite size from the full width at half maximum (FWHM) of a single diffraction peak using the Scherrer formula.44 Silicon was used as an internal standard for instrumental broadening. The calculations were performed for three well separated reflections, (240), (332) and (422), within a 2θ range from 51° to 58°. For details see ref. 45.
3. Filling levels, phase equilibria and homogeneity region
Phase equilibria in the ternary system Ni–Sn–Sb at 450 °C
For the binary boundary systems, we accepted the Ni–Sn phase diagram reported by Schmetterer et al.46 and the Ni–Sb system reported by Cha et al.,47 whereas the Sn–Sb phase diagram is consistent with a recent reinvestigation reported by Polt et al.48
Grytsiv et al. reported that the ternary skutterudite phase SnyNi4Sb12−xSnx (τ) exhibits a wide range of homogeneity at 250 °C (2.4 ≤ x ≤ 5.6, 0 ≤ y ≤ 0.31) and at 350 °C (2.7 ≤ x ≤ 5.0, 0 ≤ y ≤ 0.27).18 The phase equilibria change drastically by increasing the temperature from 250 to 350 °C and the authors18 suggested that at least two invariant reactions exist in this temperature range. Mishra et al.19 presented a detailed reaction scheme for the Sn-rich part of the system involving three invariant equilibria in the same temperature range. In order to derive the phase equilibria at 450 °C, we annealed several samples at this temperature for at least 30 days. Three-phase equilibria (Sb) + NiSb2 + τ and NiSb2 + α + τ at 450 °C (Fig. 1a and b) were found to be similar to those observed by Grytsiv et al. at 250 and 350 °C.18 We also observed three-phase regions L + (Sb) + τ, L + α + τ, and L + Ni3Sn2 + α (Fig. 1c–e), which agree well with the Schultz-Scheil diagram derived by Mishra et al.19
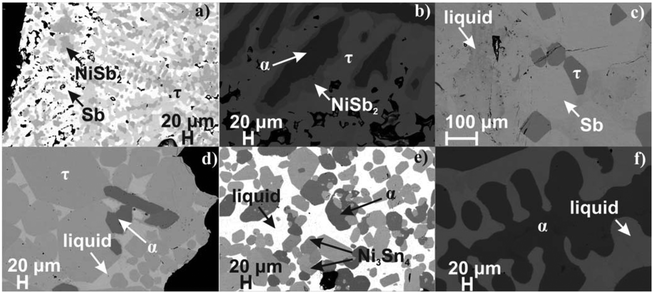 |
| | Fig. 1 Microstructure of Ni–Sn–Sb alloys annealed at 450 °C. The nominal composition (at% from EPMA) and X-ray phase analyses are given in Table 1. | |
The solid solution α (NiSb–Ni3Sn2) was observed in all the as-cast samples and has the widest liquidus field, likely being the most stable phase in the system. Thus, the as-cast alloy 2.7Ni–24.7Sn–72.6Sb shows primary crystallisation of the alpha-phase, which is surrounded by NiSb2 and the last portion of liquid crystallizes with the composition 40Sn–60Sb. At 450 °C, the sample is in solid–liquid state (Fig. 1c): huge grains of the skutterudite (Ni4Sb9.1Sn2.9) and antimony (Sb) were grown in equilibrium with the liquid with the composition 0.3Ni–47.75Sn–51.95Sb. Three-phase equilibria with the liquid phase L + Ni3Sn4 + α and L + α + τ are also well confirmed via investigation of the samples 21.5Ni–25.5Sn–53Sb and 35Ni–52Sn–13Sb (Fig. 1d and e). Between these two phase triangles, a huge two-phase field arises containing an Sn-rich liquid and the α-phase (Fig. 1f). The latter solid solution, formed by congruent melting compounds, separates the phase diagram into two subsystems for which the phase equilibria may be investigated independently. The equilibria in the Ni–NiSb–Ni3Sn2 subsystem have not been reinvestigated but were introduced after Burkhardt and Schubert (Fig. 2).49
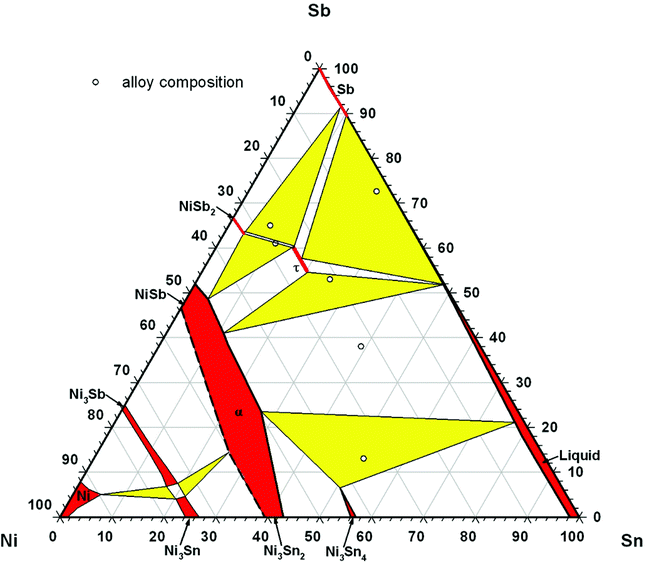 |
| | Fig. 2 Isothermal section of the Ni–Sn–Sb system at 450 °C. The microstructure of the investigated alloys is given in Fig. 1. The phase equilibria in the (Ni)–NiSb–Ni3Sn2 subsystem are shown by Burkhardt and Schubert.49 | |
The composition and lattice parameters of the skutterudite phase τ coexisting in the various three-phase equilibria at 450 °C are listed in Table 1. The isothermal section at 450 °C is shown in Fig. 2. At 450 °C, the homogeneity region of the ternary skutterudite phase τ-SnyNi4Sb12−xSnx extends for 2.4 ≤ x ≤ 3.2. By comparing the compositions of the ternary skutterudites Ni4Sb12−xSnx as a function of the Sn-content from the homogeneity regions at 250 °C and 350 °C18 as well as at 450 °C with those after DTA, a good agreement was found (see Fig. 3).
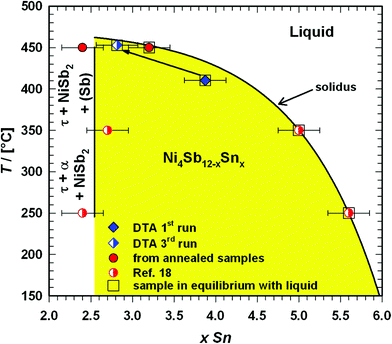 |
| | Fig. 3 Temperature dependent extent and solidus curve of the ternary skutterudite phase τ-Ni4Sb12−xSnx. | |
Table 1 Three-phase equilibria, lattice parameter and phase composition of the alloys in the Ni–Sn–Sb system
| Phase region |
Phase |
Composition |
Formula |
a [nm] |
ρ
X [g cm−3] |
| (EPMA; at%) |
(normalized to Ni = 4 and (Sb + Sn) = 12) |
| Ni |
Sb |
Sn |
Ni4Sb12−xSnx |
| (Sb) + NiSb2 + τ |
(Sb) |
— |
95.4 |
4.6 |
— |
— |
— |
|
|
NiSb2 |
33.8 |
64.8 |
1.4 |
— |
— |
— |
|
|
τ |
24.6 |
60.5 |
15.0 |
Ni4Sb9.6Sn2.4 |
0.91360(11) |
7.492 |
| NiSb2 + α + τ |
NiSb2 |
32.7 |
63.4 |
3.9 |
— |
— |
— |
|
|
α |
47.2 |
48.6 |
4.2 |
— |
— |
— |
|
|
τ |
24.7 |
60.4 |
15.0 |
Ni4Sb9.6Sn2.4 |
0.91309(4) |
7.488 |
| L + (Sb) + τ |
L |
0.3 |
52.0 |
47.8 |
— |
— |
— |
|
|
(Sb) |
— |
89.7 |
10.3 |
— |
— |
— |
|
|
τ |
24.3 |
57.5 |
18.2 |
Ni4Sb9.1Sn2.9 |
0.90608(10) |
7.421 |
| L + α + τ |
L |
0.4 |
51.8 |
47.8 |
— |
— |
— |
|
|
α |
48.0 |
41.0 |
11.0 |
— |
— |
— |
|
|
τ |
24.5 |
55.2 |
20.4 |
Ni4Sb8.8Sn3.2 |
0.91128(3) |
7.538 |
| L + α + Ni3Sn4 |
L |
1.8 |
21.1 |
77.1 |
— |
— |
— |
|
|
α |
49.5 |
23.5 |
27.0 |
— |
— |
— |
|
|
Ni3Sn4 |
42.8 |
6.5 |
50.7 |
— |
— |
— |
One may see a weak temperature dependence for the Sb-rich end of the skutterudite solid solution that coexists in three-phase solid-state equilibria: (Sb) + NiSb2 + τ and NiSb2 + α + τ. However, the Sn-rich side of the homogeneity region in equilibrium with the liquid phase shows a significant temperature dependence. With increasing temperature, the composition of the liquid gets strongly depleted on Sn, resulting in a pronounced phase segregation during the crystallization of the samples. DTA of the single-phase sample Ni4Sb8.2Sn3.8 (Fig. 4a) reveals a solidus temperature of 410 °C during the first heating (Fig. I of the ESI‡ and Table 2); however, the temperature was increased to 453 °C after the second and third heating cycles (see Fig. I of the ESI‡). Further additional thermal effects appear in the temperature range from 415 to 423 °C. EPMA of the sample after DTA (Fig. 5a) shows three phases α, β (SnSb) and skutterudite τ with an Sb-enriched composition (Ni4Sb8.9Sn3.1).
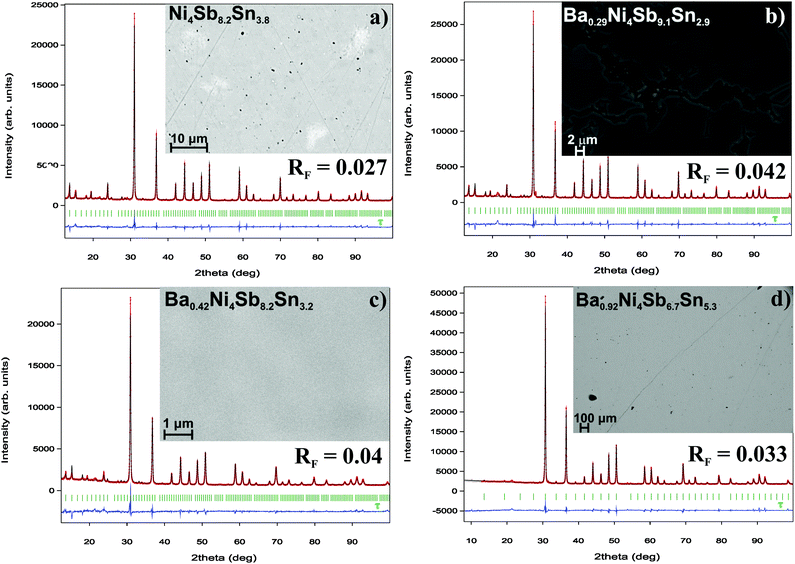 |
| | Fig. 4 Microstructure and Rietveld refinements for the single-phase samples of (a) Ni4Sb8.2Sn3.8, (b) Ba0.29Ni4Sb9.1Sn2.9, (c) Ba0.42Ni4Sb8.2Sn3.8 and (d) Ba0.92Ni4Sb6.7Sn5.3. | |
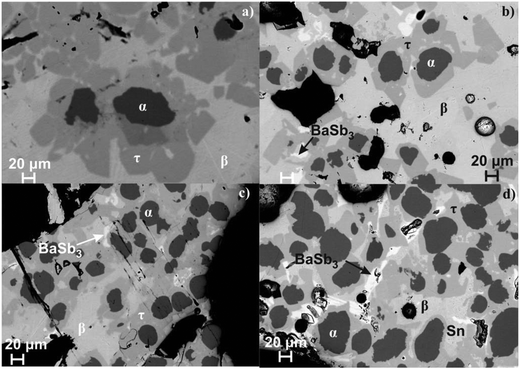 |
| | Fig. 5 Microstructure of the single-phase samples of (a) Ni4Sb8.2Sn3.8, (b) Ba0.29Ni4Sb9.1Sn2.9, (c) Ba0.42Ni4Sb8.2Sn3.8 and (d) Ba0.92Ni4Sb6.7Sn5.3 after DTA (τ denotes the skutterudite phase BayNi4Sb12−xSnx, α the continuous solid solution NiSb–Ni3Sn2 and β the binary compound SnSb). | |
Table 2 Composition-dependent melting points Tm of the filled and unfilled Ni–Sn–Sb based skutterudites
| Composition |
Formula |
|
| (EPMA; at%) |
(Normalized to Ni = 4 and (Sb + Sn) = 12) |
T
m [°C] |
| Ba |
Ni |
Sb |
Sn |
Ni4Sb12−xSnx |
From DTA |
| — |
24.6 |
55.8 |
19.6 |
Ni4Sb8.9Sn3.1 |
453 |
| — |
24.5 |
51.9 |
23.6 |
Ni4Sb8.2Sn3.8 |
410 |
| 1.8 |
24.2 |
56.1 |
17.9 |
Ba0.29Ni4Sb9.2Sn2.9 |
534 |
| 3.2 |
23.8 |
57.1 |
15.9 |
Ba0.55Ni4Sb9.4Sn2.6 |
521 |
| 2.5 |
23.9 |
50.4 |
23.2 |
Ba0.42Ni4Sb8.2Sn3.8 |
533 |
| 3.6 |
23.8 |
52.5 |
20.1 |
Ba0.61Ni4Sb8.7Sn3.3 |
540 |
| 5.1 |
23.6 |
42.1 |
29.1 |
Ba0.87Ni4Sb7.1Sn4.9 |
557 |
| 5.4 |
23.4 |
39.6 |
31.6 |
Ba0.92Ni4Sb6.7Sn5.3 |
554 |
Homogeneity region for the filled skutterudite BayNi4Sb12−xSnx
In general, the filling of the 2a site in the skutterudite structure has a maximal effect on the reduction of the lattice thermal conductivity.6,28 In order to define the solubility of the electropositive filler (Ba) in Ni4Sb12−xSnx, two samples with nominal compositions of 1Ba–4Ni–5Sb–7Sn and 1Ba–4Ni–8Sb–4Sn were investigated in the as-cast state and after annealing at 250, 350 and 450 °C.
Rietveld refinements for the occupancy in the 2a site in combination with EPMA measurements are shown in Fig. 6. No skutterudites were observed in the as-cast alloys. The skutterudite phase is formed after annealing and appears in the microstructure as the main phase for one of the three temperatures 250, 350 or 450 °C (Fig. 7). In all cases, we observed an increase in the filling level with increasing Sn-content reaching y = 0.93 for the Ba filled skutterudite, while Fig. 7 additionally shows a clear dependence of the filling level on the temperature. Furthermore, for the Sn-rich compositions, EPMA reveals two sets of skutterudite compositions in the samples annealed at 350 °C and 450 °C. Such phase segregation is not likely connected with diffusion, suppressed at these temperatures, because the heat treatment at 250 °C yields the formation of a skutterudite with a uniform composition. Considering the interesting behaviour of the Ba filled skutterudite, this compound was selected for detailed investigations at 450 °C.
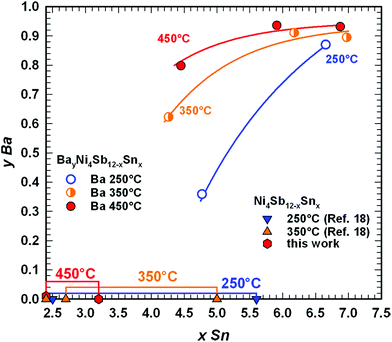 |
| | Fig. 6 Compositional dependence of the Ba filling level in BayNi4Sb12−xSnx at 250, 350 and 450 °C on the Sn-rich boundary of the skutterudite solid solution, as determined in the samples of 1Ba–4Ni–5Sb–7Sn and 1Ba–4Ni–8Sb (for their microstructures see Fig. 7). | |
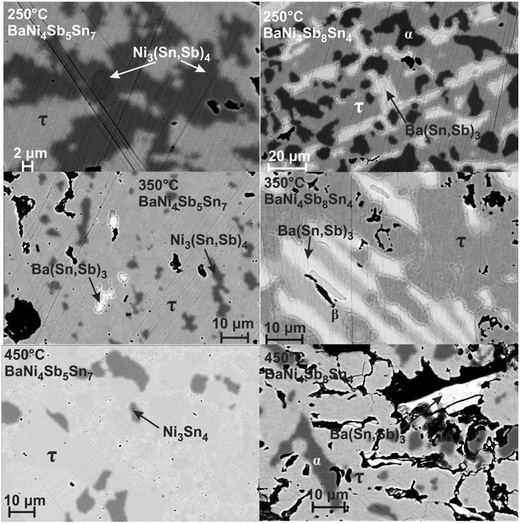 |
| | Fig. 7 Microstructure of the alloys BaNi4Sb5Sn7 and BaNi4Sb8Sn4, annealed at 250, 350 and 450 °C (τ denotes the skutterudite phase BayNi4Sb12−xSnx, α the continuous solid solution NiSb–Ni3Sn2 and β the binary compound SnSb). | |
For several quaternary samples, annealed at 450 °C, the Ba filling level in dependence of the Sn content was determined by Rietveld refinements combined with microprobe measurements and yielded a large homogeneity region of BayNi4Sb12−xSnx, as shown in a two-dimensional (2D) projection in Fig. 8. Obviously, the maximal solubility of Ba in the skutterudite (y > 0.93) responds to two cases: (i) an equilibrium with the Sn-rich liquid and (ii) the crystallization of skutterudites with two compositions (Ba0.94Ni4Sb6.1Sn5.9 and Ba0.93Ni4Sb5.1Sn6.9) that coexist with Ni3Sn4. Upon increasing the Sb-content, the solubility decreases to y = 0 in the three-phase equilibria with (Sb) and NiSb2 as well as with α and NiSb2.
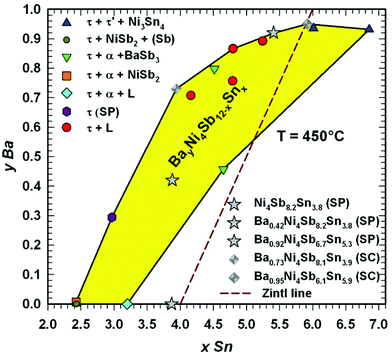 |
| | Fig. 8 Homogeneity region for BayNi4Sb12−xSnx at 450 °C as a function of Sn-content and Ba filling level. The composition of the single crystals (SC) and samples prepared for investigation of their physical properties (SP) are added. The ternary single-phase sample Ni4Sb8.2Sn3.8 was found to be outside the estimated homogeneity region because the temperature during its preparation was about 10 °C below 450 °C. | |
DTA provided further information on the stability of BayNi4Sb12−xSnx. Three single-phase samples were used: Ba0.42Ni4Sb8.2Sn3.8 and Ba0.92Ni4Sb6.7Sn5.3 (Fig. 4c and d) after ball milling and hot pressing, and the compound Ba0.29Ni4Sb9.1Sn2.9, which appeared to be a single-phase after annealing at 450 °C (Fig. 4b). For these alloys, three heating and three cooling curves were recorded using a scanning rate of 5 K min−1 (see Fig. II to IV of the ESI‡). In all the first heating curves, only one signal could be detected; however, at lower temperatures, the subsequent heating and cooling curves revealed additional thermal effects associated with the incongruent melting of the alloys (also see Table 2). This was confirmed by the microstructure of the samples after DTA (Fig. 5b–d). In all cases, we observe the formation of a high melting α-phase with subsequent crystallization of the β-phase and BaSb3. A tin-rich liquid was found to form during crystallisation of Ba0.92Ni4Sb6.7Sn5.3. Due to incongruent crystallization of BayNi4Sb12−xSnx, the composition of the skutterudite phase changes similarly to the ternary Ni–Sn–Sb skutterudite (see chapter above). The melting points, Tm, for the samples before and after DTA are listed in Table 2 and the compositional dependences of the solidus temperature were compared with data for the Ni–Sb–Sn skutterudite in Fig. 9. The filling of the skutterudite lattice with Ba-atoms clearly results in a significant increase in the melting temperature and this influence is particularly visible for the Sn-rich samples.
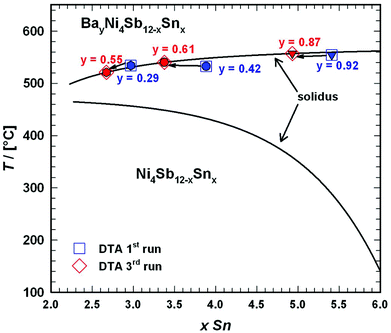 |
| | Fig. 9 Compositional dependence of the solidus curve for BayNi4Sb12−xSnx in comparison to that of Ni4Sb12−xSnx (for details see Fig. 3). For the melting temperatures, see Table 2. | |
Knowledge of the extension of the homogeneity region for BayNi4Sb12−xSnx as a function of temperature was used to prepare single-phase samples for measurements of their physical properties (Fig. 4a, c, d and Table 3) and to grow single crystals for structural investigations.
Table 3 Composition, densities and lattice parameters of the samples used for the investigation of the physical and mechanical properties
| Composition |
|
|
|
|
|
| (EPMA; at%) |
Formula(Normalized to Ni = 4 and (Sb + Sn) = 12) |
| Ba |
Ni |
Sb |
Sn |
Ni4Sb12−xSnx |
a [nm] |
ρ
X [g cm−3] |
ρ
s [g cm−3] |
ρ
s/ρX |
| — |
24.45 |
51.87 |
23.60 |
Ni4Sb8.2Sn3.8 |
0.91071(2) |
7.598 |
7.490 |
0.99 |
| 2.52 |
23.89 |
50.4 |
23.19 |
Ba0.42Ni4Sb8.2Sn3.8 |
0.91418(4) |
7.742 |
7.562 |
0.98 |
| 5.37 |
23.38 |
39.62 |
31.63 |
Ba0.92Ni4Sb6.7Sn5.3 |
0.91999(5) |
7.800 |
7.686 |
0.99 |
4. Crystal structure and vibration modes of BayNi4Sb12−xSnx
Rietveld refinements of the X-ray powder data for BayNi4Sb12−xSnx were fully consistent with the skutterudite structure CoAs3 in the unfilled case and LaFe4Sb12 in the filled case. The refinements combined with EPMA defined the degree of filling in the 2a site and the Sb/Sn ratio in the 24g site. The compositional data and corresponding lattice parameters for all new phases of BayNi4Sb12−xSnx are summarized in Table 4. The lattice parameters revealed neither a dependence on the filling level of Ba nor on the Sb/Sn ratio.
Table 4 Composition and lattice parameters of the skutterudites BayNi4Sb12−xSnx for the single crystals,a single phaseb and multiphasec alloys
| Composition |
|
|
|
| (EPMA; at%) |
Formula(Normalized to Ni = 4 and (Sb + Sn) = 12) |
|
|
| Ba |
Ni |
Sb |
Sn |
Ni4Sb12−xSnx |
a [nm] |
ρ
X [g cm−3] |
| — |
24.6 |
60.5 |
15.0 |
N4Sb9.6Sn2.4![[thin space (1/6-em)]](https://www.rsc.org/images/entities/char_2009.gif) c c |
0.91360(11) |
7.492 |
| — |
24.7 |
60.4 |
15.0 |
Ni4Sb9.6Sn2.4![[thin space (1/6-em)]](https://www.rsc.org/images/entities/char_2009.gif) c c |
0.91309(4) |
7.488 |
| — |
24.3 |
57.5 |
18.2 |
Ni4Sb9.1Sn2.9![[thin space (1/6-em)]](https://www.rsc.org/images/entities/char_2009.gif) c c |
0.90608(10) |
7.421 |
| — |
24.5 |
55.2 |
20.4 |
Ni4Sb8.8Sn3.2![[thin space (1/6-em)]](https://www.rsc.org/images/entities/char_2009.gif) c c |
0.91128(3) |
7.538 |
| 1.8 |
24.2 |
56.1 |
17.9 |
Ba0.29Ni4Sb9.2Sn2.9![[thin space (1/6-em)]](https://www.rsc.org/images/entities/char_2009.gif) b b |
0.91343(5) |
7.657 |
| 2.7 |
23.7 |
46.2 |
27.5 |
Ba0.46Ni4Sb7.5Sn4.5![[thin space (1/6-em)]](https://www.rsc.org/images/entities/char_2009.gif) c c |
0.91503(20) |
7.807 |
| 4.1 |
23.4 |
48.2 |
24.3 |
Ba0.71Ni4Sb8Sn4![[thin space (1/6-em)]](https://www.rsc.org/images/entities/char_2009.gif) c c |
0.91813(3) |
7.855 |
| 4.3 |
23.6 |
48.8 |
23.3 |
Ba0.73Ni4Sb8.1Sn3.9![[thin space (1/6-em)]](https://www.rsc.org/images/entities/char_2009.gif) a a |
0.91995(2) |
7.612 |
| 4.4 |
23.3 |
44.5 |
27.9 |
Ba0.76Ni4Sb7.4Sn4.6![[thin space (1/6-em)]](https://www.rsc.org/images/entities/char_2009.gif) c c |
0.91854(9) |
7.882 |
| 4.7 |
23.6 |
45.1 |
26.6 |
Ba0.80Ni4Sb7.6Sn4.4![[thin space (1/6-em)]](https://www.rsc.org/images/entities/char_2009.gif) c c |
0.92183(74) |
7.690 |
| 5.0 |
23.3 |
43.7 |
28.0 |
Ba0.87Ni4Sb7.3Sn4.7![[thin space (1/6-em)]](https://www.rsc.org/images/entities/char_2009.gif) c c |
0.92029(3) |
7.834 |
| 5.2 |
23.3 |
41.0 |
30.5 |
Ba0.89Ni4Sb6.9Sn5.1![[thin space (1/6-em)]](https://www.rsc.org/images/entities/char_2009.gif) c c |
0.92024(38) |
7.830 |
| 5.5 |
23.3 |
36.1 |
35.1 |
Ba0.94Ni4Sb6.1Sn5.9![[thin space (1/6-em)]](https://www.rsc.org/images/entities/char_2009.gif) c c |
0.92016(4) |
7.805 |
| 5.5 |
23.7 |
30.2 |
40.6 |
Ba0.93Ni4Sb5.1Sn6.9![[thin space (1/6-em)]](https://www.rsc.org/images/entities/char_2009.gif) c c |
0.92016(4) |
7.664 |
| 5.6 |
23.5 |
36.1 |
34.8 |
Ba0.95Ni4Sb6.1Sn5.9![[thin space (1/6-em)]](https://www.rsc.org/images/entities/char_2009.gif) a a |
0.92083(2) |
7.692 |
For two flux-grown single crystals, BayNi4Sb12−xSnx (for details see micrographs in Fig. 10), the X-ray diffraction intensities were recorded at three different temperatures (100, 200 and 300 K). The refinement in all cases proved isotypism with the LaFe4Sb12 type (filled skutterudite; space group Im![[3 with combining macron]](https://www.rsc.org/images/entities/char_0033_0304.gif) ) with Ni atoms occupying the 8c site, whereas Sb and Sn atoms randomly share the 24g site. The residual density at the 2a site was assigned to Ba atoms. The compositions derived from the structural refinement, namely, Ba0.73Ni4Sb8.1Sn3.9 and Ba0.95Ni4Sb6.1Sn5.9, are in accordance with the microprobe measurements. Final refinements with fixed occupancies (Tables 5 and 6) and anisotropic atom displacement parameters (ADPs) led to a reliability factor RF below 2%. The maximum residual electron density of ∼3 e− Å−3 appears at a distance of 1.5 Å from the centre of the 24g site. This density can be interpreted as a “diffraction ripple” of the Fourier series around the heavy Sb and Sn atoms located at this site. The interatomic distances for Ni and (Sn/Sb) lie within range of values known for CoSb3
) with Ni atoms occupying the 8c site, whereas Sb and Sn atoms randomly share the 24g site. The residual density at the 2a site was assigned to Ba atoms. The compositions derived from the structural refinement, namely, Ba0.73Ni4Sb8.1Sn3.9 and Ba0.95Ni4Sb6.1Sn5.9, are in accordance with the microprobe measurements. Final refinements with fixed occupancies (Tables 5 and 6) and anisotropic atom displacement parameters (ADPs) led to a reliability factor RF below 2%. The maximum residual electron density of ∼3 e− Å−3 appears at a distance of 1.5 Å from the centre of the 24g site. This density can be interpreted as a “diffraction ripple” of the Fourier series around the heavy Sb and Sn atoms located at this site. The interatomic distances for Ni and (Sn/Sb) lie within range of values known for CoSb3![[thin space (1/6-em)]](https://www.rsc.org/images/entities/char_2009.gif) 15 and LaFe4Sb12.52
15 and LaFe4Sb12.52
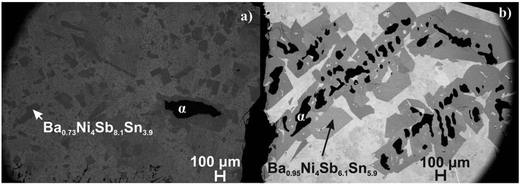 |
| | Fig. 10 Microstructure of the slowly cooled reguli used to grow the single crystals from the (a) (SnSb)-flux and (b) (Sn)-flux (α denotes the continuous solid solution of NiSb–Ni3Sn2). | |
Table 5 The X-ray single crystal data for skutterudite Ba0.73Ni4Sb8.26Sn3.94 (MoKα radiation; standardized with program Structure Tidy;50 temperature data for 100 K, 200 K and 300 K; redundancy >8); space group Im![[3 with combining macron]](https://www.rsc.org/images/entities/char_0033_0304.gif) ; no. 204. ADP (Uij) are given in [10−2 nm2]
; no. 204. ADP (Uij) are given in [10−2 nm2]
| Parameter |
100 K |
200 K |
300 K |
|
Normalized to Ni = 4 and (Sn + Sb) = 12.
Gathered with the program DIDO_95.51
Coordination numbers.
|
| Space group |
Im![[3 with combining macron]](https://www.rsc.org/images/entities/char_0033_0304.gif) |
Im![[3 with combining macron]](https://www.rsc.org/images/entities/char_0033_0304.gif) |
Im![[3 with combining macron]](https://www.rsc.org/images/entities/char_0033_0304.gif) |
| Composition from EPMAa |
Ba0.73Ni4Sb8.1Sn3.9 |
Ba0.73Ni4Sb8.1Sn3.9 |
Ba0.73Ni4Sb8.1Sn3.9 |
| Composition from refinement |
Ba0.79Ni4Sb8.1Sn3.9 |
Ba0.78Ni4Sb8.1Sn3.9 |
Ba0.78Ni4Sb8.1Sn3.9 |
| Crystal size |
50 × 20 × 20 μm3 |
50 × 20 × 20 μm3 |
50 × 20 × 20 μm3 |
|
a [nm] |
0.91791(2) |
0.91887(2) |
0.91995(2) |
|
μ
abs [mm−1] |
27.24 |
24.80 |
27.06 |
|
ρ
x (g cm−3) |
7.819 |
7.292 |
7.768 |
| Data collection, 2θ range (°) |
2 ≤ 2θ ≤ 72.6; 100 s per frame |
2 ≤ 2θ ≤ 72.6; 100 s per frame |
2 ≤ 2θ ≤ 72.6; 100 s per frame |
| Total number of frames |
240 for 6 sets; scan width = 2° |
240 for 6 sets; scan width = 2° |
240 for 6 sets; scan width = 2° |
| Reflections in refinement [total # of reflections] |
338 ≥ 4σ(Fo) of 354 [609] |
339 ≥ 4σ(Fo) of 354 [609] |
329 ≥ 4σ(Fo) of 354 [610] |
| Mosaicity |
<0.45 |
<0.45 |
<0.45 |
| Number of variables |
12 |
12 |
12 |
|
R1F = ∑|Fo − Fc|/∑Fo |
0.0193 |
0.0203 |
0.0221 |
|
R
Int
|
0.0079 |
0.0078 |
0.0089 |
| wR2 |
0.0328 |
0.0375 |
0.0485 |
| GOF |
1.181 |
1.178 |
1.133 |
| Extinction (Zachariasen) |
0.00117(5) |
0.00117(6) |
0.00118(10) |
| Ba in 2a (0,0,0); occ. = 0.79 |
|
U
11; U22; U33 |
0.0043(3); 0.0043(3); 0.0043(3) |
0.0071(3); 0.0071(3); 0.0071(3) |
0.0105(3); 0.0105(3); 0.0105(3) |
| Ni in 8c (¼, ¼, ¼); occ. = 1 |
|
U
11; U22; U33; U23; U13; U12 |
0.0058(1); 0.0040(1); 0.0040(1); 0.0002(1); 0.0002(1); 0.0002(1) |
0.0058(2); 0.0058(2); 0.0058(2); 0.0004(1); 0.0004(1); 0.0004(1) |
0.0078(2); 0.0078(2); 0.0078(2); 0.0005(1); 0.0005(1); 0.0005(1); |
| Sb in 24g (0, y, z); occ. = 0.68 |
0.16094(2); 0.34111(2) |
0.16101(3); 34![[thin space (1/6-em)]](https://www.rsc.org/images/entities/char_2009.gif) 114(3) 114(3) |
0.16110(3); 0.34119(3) |
|
U
11; U22; U33; U23 |
0.0029(1); 0.0036(1); 0.0073(1); 0.0006(1) |
0.0048(1); 0.0065(1); 0.0098(1); 0.0007(1) |
0.0068(1); 0.0093(1); 0.0127(1); 0.0008(1) |
| Sn in 24g (0, y, z); occ. = 0.32 |
0.16094(2); 0.34111(2) |
0.16101(3); 0.34144(3) |
0.16110(3); 0.34119(3) |
|
U
11; U22; U33; U23 |
0.0030(2); 0.0040(1); 0.0073(1); 0.0006(1) |
0.0048(1); 0.0065(1); 0.0098(1); 0.0007(1) |
0.0068(1); 0.0093(1); 0.0127(1); 0.0008(1) |
| Residual density; max; min [e− nm−3] |
2.03 × 10³ (0.149 nm from Sb1/Sn1); −1.23 × 10³ (0.160 nm from Sb1/Sn1) |
2.10 × 10³ (0.149 nm from Sb1/Sn1); −1.24 × 10³ (0.161 nm from Sb1/Sn1) |
2.66 × 10³ (0.150 nm from Sb1/Sn1); −1.55 × 10³ (0.051 nm from Sb1/Sn1) |
| Principal mean square atomic displacements U; Ueq |
Ba: 0.0043 0.0043 0.0043; 0.0043(3) |
Ba: 0.0071 0.0071 0.0071; 0.0071(3) |
Ba: 0.0043 0.0043 0.0043; 0.0105(3) |
| Ni: 0.0044 0.0037 0.0037; 0.0040(1) |
Ni: 0.0065 0.0055 0.0055; 0.0058(2) |
Ni: 0.0044 0.0037 0.0037; 0.0078(2) |
| Sb: 0.0074 0.0038 0.0029; 0.0047(1) |
Sb: 0.0100 0.0063 0.0048; 0.0070(1) |
Sb: 0.0074 0.0038 0.0029; 0.0096(1) |
| Sn: 0.0074 0.0038 0.0029; 0.0047(1) |
Sn: 0.0100 0.0063 0.0048; 0.0070(1) |
Sn: 0.0074 0.0038 0.0029; 0.0096(1) |
| Interatomic (standard deviations less than 0.0001 nm)b |
| Ba |
12 Sb/Sn |
0.3462 |
0.3466 |
0.3471 |
| 20c |
8 Ni |
0.3975 |
0.3979 |
0.3984 |
| Ni |
6 Sb/Sn |
0.2576 |
0.2578 |
0.2581 |
| 8 |
2 Ba |
0.3975 |
0.3979 |
0.3984 |
| Sb/Sn |
2 Ni |
0.2576 |
0.2578 |
0.2581 |
| 9 |
1 Sb/Sn |
0.2917 |
0.2929 |
0.2922 |
|
|
1 Sb/Sn |
0.2955 |
0.2959 |
0.2964 |
|
|
4 Sb/Sn |
0.3437 |
0.3440 |
0.3443 |
|
|
1 Ba |
0.3462 |
0.3466 |
0.3471 |
Table 6 The X-ray single crystal data for skutterudite Ba0.73Ni4Sb8.26Sn3.94 (MoKα radiation; standardized with program Structure Tidy;50 temperature data for 100 K, 200 K and 300 K; redundancy >8); space group Im![[3 with combining macron]](https://www.rsc.org/images/entities/char_0033_0304.gif) no. 204. ADP (Uij) are given in [10−2 nm2]
no. 204. ADP (Uij) are given in [10−2 nm2]
| Parameter |
100 K |
200 K |
300 K |
|
Normalized to Ni = 4 and (Sn + Sb) = 12.
Gathered with the program DIDO_95.51
Coordination numbers.
|
| Space group |
Im![[3 with combining macron]](https://www.rsc.org/images/entities/char_0033_0304.gif) |
Im![[3 with combining macron]](https://www.rsc.org/images/entities/char_0033_0304.gif) |
Im![[3 with combining macron]](https://www.rsc.org/images/entities/char_0033_0304.gif) |
| Composition from EPMAa |
Ba0.95Ni4Sb6.1Sn5.9 |
Ba0.95Ni4Sb6.1Sn5.9 |
Ba0.95Ni4Sb6.1Sn5.9 |
| Composition from refinement |
Ba0.99Ni4Sb6.1Sn5.9 |
Ba0.99Ni4Sb6.1Sn5.9 |
Ba0.99Ni4Sb6.1Sn5.9 |
| Crystal size |
80 × 30 × 30 μm3 |
80 × 30 × 30 μm3 |
80 × 30 × 30 μm3 |
|
a [nm] |
0.91854(2) |
0.91961(2) |
0.92083(2) |
|
μ
abs [mm−1] |
24.56 |
26.83 |
26.72 |
|
ρ
x (g cm−3) |
7.275 |
7.750 |
7.719 |
| Data collection, 2θ range (°) |
2 ≤ 2θ ≤ 72.6; 100 s per frame |
2 ≤ 2θ ≤ 72.6; 100 s per frame |
2 ≤ 2θ ≤ 72.6; 100 s per frame |
| Total number of frames |
240 for 6 sets; scan width = 2° |
240 for 6 sets; scan width = 2° |
240 for 6 sets; scan width = 2° |
| Reflections in refinement [total # of reflections] |
354 ≥ 4σ(Fo) of 359 [621] |
352 ≥ 4σ(Fo) of 357 [618] |
343 ≥ 4σ(Fo) of 354 [613] |
| Mosaicity |
<0.45 |
<0.45 |
<0.45 |
| Number of variables |
12 |
12 |
12 |
|
R1F = ∑|Fo − Fc|/∑Fo |
0.0171 |
0.0170 |
0.0197 |
|
R
Int
|
0.0112 |
0.0107 |
0.0122 |
| wR2 |
0.0414 |
0.0416 |
0.0470 |
| GOF |
1.422 |
1.324 |
1.181 |
| Extinction (Zachariasen) |
0.00217(10) |
0.00389(14) |
0.01030(32) |
| Ba1 in 2a (0,0,0); occ. = 0.99 |
|
U
11; U22; U33 |
0.0030(2); 0.0030(2); 0.0030(2) |
0.0059(2); 0.0059(2); 0.0059(2) |
0.0089(2); 0.0089(2); 0.0089(2) |
| Ni1 in 8c (¼, ¼, ¼); occ. = 1 |
|
U
11; U22; U33; U23; U13; U12 |
0.0032(2); 0.0032(2); 0.0032(2); 0.0004(1); 0.0004(1); 0.0004(1) |
0.0050(2); 0.0050(2); 0.0050(2); 0.0007(1); 0.0007(1); 0.0007(1) |
0.0069(2); 0.0069(2); 0.0078(2); 0.0008(1); 0.0008(1); 0.0008(1); |
| Sb1 in 24g (0, y, z); occ. = 0.51 |
0.16241(2); 0.34238(2) |
0.16252(2); 34![[thin space (1/6-em)]](https://www.rsc.org/images/entities/char_2009.gif) 241(2) 241(2) |
0.16266(3); 0.34245(3) |
|
U
11; U22; U33; U23 |
0.0023(1); 0.0036(1); 0.0028(1); 0.00002(6) |
0.0042(1); 0.0062(1); 0.0051(1); 0.0002(6) |
0.0063(1); 0.0089(1); 0.0076(1); −0.0001(1) |
| Sn1 in 24g (0, y, z); occ. = 0.49 |
0.16241(2); 0.34238(2) |
0.16252(2); 0.34241(2) |
0.16266(3); 0.34245(3) |
|
U
11; U22; U33; U23 |
0.0023(1); 0.0036(1); 0.0028(1); 0.00002(6) |
0.0042(1); 0.0062(1); 0.0051(1); 0.0002(6) |
0.0063(1); 0.0089(1); 0.0076(1); −0.0001(1) |
| Residual density; max; min [e− nm−3] |
1.27 × 10³ (0.077 nm from Sb1/Sn1); −1.12 × 10³ (0.056 nm from Sb1/Sn1) |
1.78 × 10³ (0.151 nm from Sb1/Sn1); −1.63 × 10³ (0.055 nm from Sb1/Sn1) |
2.07 × 10³ (0.152 nm from Sb1/Sn1); −1.78 × 10³ (0.054 nm from Sb1/Sn1) |
| Principal mean square atomic displacements U; Ueq |
Ba1: 0.0043 0.0043 0.0043; 0.0030(2) |
Ba1: 0.0059 0.0059 0.0059; 0.0059(2) |
Ba1: 0.0089 0.0089 0.0089; 0.0089(2) |
| Ni1: 0.0044 0.0037 0.0037; 0.0032(2) |
Ni1: 0.0062 0.0043 0.0043; 0.0050(2) |
Ni1: 0.0086 0.0061 0.0061; 0.0069(2) |
| Sb1: 0.0074 0.0038 0.0029; 0.0029(1) |
Sb1: 0.0062 0.0051 0.0042; 0.0052(1) |
Sb1: 0.0089 0.0076 0.0063; 0.0076(1) |
| Sn1: 0.0074 0.0038 0.0029; 0.0029(1) |
Sn1: 0.0062 0.0051 0.0042; 0.0052(1) |
Sn1: 0.0089 0.0076 0.0063; 0.0076(1) |
| Interatomic (standard deviations less than 0.0001 nm)b |
| Ba |
12 Sb/Sn |
0.3481 |
0.3486 |
0.3491 |
| 20c |
8 Ni |
0.3977 |
0.3982 |
0.3987 |
| Ni |
6 Sb/Sn |
0.2577 |
0.2580 |
0.2583 |
| 8 |
2 Ba |
0.3977 |
0.3982 |
0.3987 |
| Sb/Sn |
2 Ni |
0.2577 |
0.2580 |
0.2583 |
| 9 |
1 Sb/Sn |
0.2896 |
0.2898 |
0.2902 |
|
|
1 Sb/Sn |
0.2984 |
0.2989 |
0.2996 |
|
|
4 Sb/Sn |
0.3423 |
0.3426 |
0.3429 |
|
|
1 Ba |
0.3481 |
0.3486 |
0.3491 |
Fig. 11 shows the temperature dependence of the ADP for Ba0.73Ni4Sb8.1Sn3.9 and Ba0.95Ni4Sb6.1Sn5.9. Filler atoms in cage compounds such as skutterudites generally exhibit ADPs at RT, which are about three to four times higher than those of the framework atoms.6 In the case of BayNi4Sb12−xSnx, this factor is only slightly above 1.2. Despite their low ADPs, the Ba atoms may be tentatively described as harmonic Einstein oscillators uncoupled from a framework that behaves as a Debye solid. Least squares fitting of the temperature dependent ADPs of the Ba-atom, Ueq (isotropic by symmetry) with the Einstein model (eqn (4.1)) yields an Einstein temperature of 104 K for Ba0.73Ni4Sb8.1Sn3.9 and 111 K for Ba0.95Ni4Sb6.1Sn5.9. Similarly, the Debye model (eqn (4.2)) applied to the framework atoms (Ni, Sb and Sn) revealed only slight differences between θD for Ni and the random Sn/Sn mixture.
| |  | (4.1) |
| |  | (4.2) |
θE and
θD are listed in
Table 7. As the skutterudite framework is built by the Sn and Sb atoms forming octahedra with the Ni atoms in the octahedral centres, one may explain these results as follows: because of its position in an octahedral cage formed by Sb and Sn, the vibration of the strongly bonded Ni atom is not independent from that of the framework and therefore leads to values close to those obtained for Sb/Sn. While the Debye temperatures fit well (particularly for Sb/Sn), the Einstein temperatures are apparently lower than those of other filled skutterudites reported in the literature (see for example
ref. 23) and hint towards a tightly bonded Ba-atom squeezed into a smaller Ni
4(Sn,Sb)
12 icosahedron in relation to those formed by the larger filled Co
4Sb
12 cages. A calculation of the icosahedron volume (treated as a Voronoi polyhedron, calculated with the DIDO_95 program
51) reveals 294.5 nm
3 for Ba
0.35Co
4Sb
12 with respect to only 289.7 nm
3 for Ba
0.73Ni
4Sb
8.1Sn
3.9.
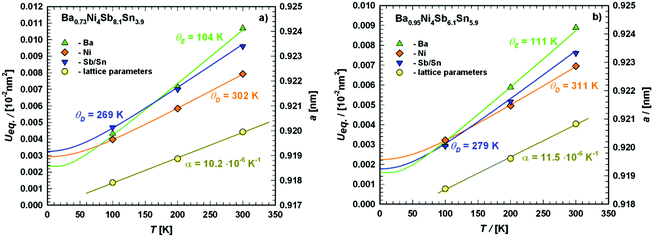 |
| | Fig. 11 Temperature dependence of the lattice parameter a (right axis) and the atomic displacement parameters (ADP) (left axis) of (a) Ba0.73Ni4Sb8.1Sn3.9 and (b) Ba0.95Ni4Sb6.1Sn5.9 obtained from the X-ray single-crystal measurements at 100, 200 and 300 K. The solid lines correspond to the least squares fitting according to eqn (4.1) and (4.2) for the ADPs and a simple linear fit for the thermal expansion coefficient. | |
Table 7 Comparison of Debye temperature θD, Einstein temperature θE and thermal expansion coefficients α gained using different experimental methods for various single crystalline (SC) and single phase (SP) BayNi4Sb12−xSnx skutterudites
| Composition |
Material |
Methodb |
γ [mJ mol−1 K−1] |
θ
D [K] |
θ
Ei [K] |
Methodc |
α × 10−6 [K−1] |
|
θ
E1
|
θ
E2
|
θ
E3
|
|
The average Debye temperature calculated via [θD(Ni) + 3·θD(Sb/Sn)]/4.
Method: ADP – fit of atomic displacement parameters; MB – fit of Lamb–Mössbauer factor; LTF – low temperature fit of Cp/T vs. T2; DEM – combined Debye and Einstein model; JF – Junod fit; FER – fit of electrical resistivity; FTC – fit of thermal conductivity; FTE – fit of thermal expansion; RUS – resonant ultrasound spectroscopy.
Method: LP – fit of temperature dependent lattice parameters; CD – fit of capacitance dilatometer measurement data; TDA – fit of thermodilatometric analysis measurement data.
|
| Ba0.73Ni4Sb8.1Sn3.9 |
SC |
ADP |
|
277a |
104 |
— |
— |
LP |
10.2 |
| Ba0.95Ni4Sb6.1Sn5.9 |
SC |
ADP |
|
289a |
111 |
— |
— |
LP |
11.5 |
| Ni4Sb8.2Sn3.8 |
SP |
MB |
|
217 |
— |
— |
— |
CD |
11.8 |
| LTF |
9 |
223 |
— |
— |
— |
TDA |
11.0 |
| DEM |
|
264 |
71 |
— |
534 |
|
|
| JF |
|
220 |
68 |
— |
— |
|
|
| FER |
|
220 |
— |
— |
— |
|
|
| FTC |
|
224 |
— |
— |
— |
|
|
| FTE |
|
223 |
— |
— |
— |
|
|
| RUS |
|
252 |
— |
— |
— |
|
|
| Ba0.29Ni4Sb9.2Sn2.9 |
SP |
MB |
|
229 |
— |
— |
— |
|
|
| Ba0.42Ni4Sb8.2Sn3.8 |
SP |
MB |
|
244 |
— |
— |
— |
CD |
12 |
| LTF |
15 |
265 |
— |
— |
— |
TDA |
11.8 |
| DEM |
|
256 |
57 |
97 |
599 |
|
|
| JF |
|
256 |
54.1 |
81 |
— |
|
|
| FER |
|
263 |
— |
— |
— |
|
|
| FTC |
|
262 |
— |
— |
— |
|
|
| FTE |
|
273 |
103 |
— |
— |
|
|
| RUS |
|
266 |
— |
— |
— |
|
|
| Ba0.92Ni4Sb6.7Sn5.3 |
SP |
MB |
|
260 |
— |
— |
— |
CD |
13.2 |
| LTF |
13.1 |
265 |
— |
— |
— |
TDA |
12.5 |
| DEM |
|
255 |
60 |
102 |
599 |
|
|
| JF |
|
269 |
54.7 |
98.4 |
— |
|
|
| FER |
|
261 |
— |
— |
— |
|
|
| FTC |
|
264 |
— |
— |
— |
|
|
| FTE |
|
278 |
100 |
— |
— |
|
|
| RUS |
|
270 |
— |
— |
— |
|
|
By fitting the temperature dependent lattice parameters via a linear function of the form a·x + b (with a = 1.02 × 10⁻⁵ and b = 0.92 in the case of Ba0.73Ni4Sb8.1Sn3.9, but a = 1.15 × 10⁻⁵ and b = 0.92 for Ba0.95Ni4Sb6.1Sn5.9), the thermal expansion coefficients for the two compositions could also be determined (Table 7). All values for α lie within the range discovered for other skutterudites and increase with higher filling levels.22,23
5. Mössbauer spectroscopy
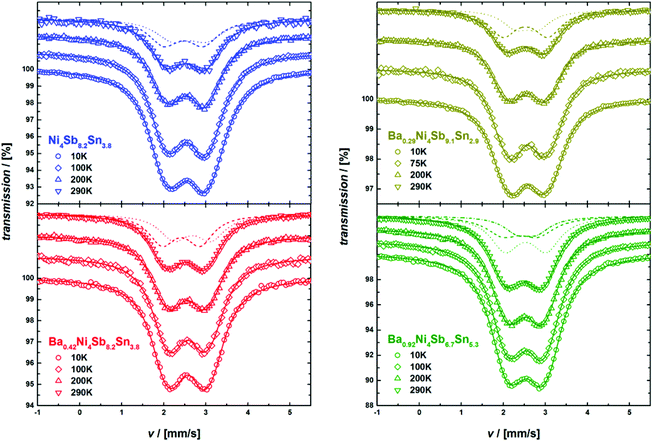
In order to access and quantify a potential occupation of the rattling 2a site by Sn, temperature dependent Mössbauer spectroscopy measurements were conducted for the 119Sn resonance from 10 to 290 K. As potential Sn on the 2a site should be rather weakly bonded, a very low Lamb–Mössbauer factor would be expected for the corresponding component, which necessitates the low temperature measurements. The 119Sn Mössbauer spectra are shown in Fig. 12 and are basically characterized by a broad, slightly asymmetric doublet-like structure. The spectra were fitted with a model consisting of up to three doublets, which represent the different configurations of Sn on the 24g site with zero, one or two Sb next neighbors (NN). As for each Sn atom, the probability of two NN Sn atoms is above 0.1 only for sample Ba0.92Ni4Sb6.7Sn5.3, the Mössbauer spectra of the other samples were analyzed using two doublets. Exemplarily, these different components are also shown in Fig. 12 for measurements at 290 K and the Mössbauer parameters of all components at all temperatures are summarized in Table I of the ESI.‡
 |
| | Fig. 12
119Sn-Mossbauer spectra obtained at different temperatures. The solid lines represent the corresponding fits. For the room temperature measurements, the different components I (dashed line), II (dotted line) and III (dot-and-dashed line) are also displayed (see text and Table I of the ESI‡ for further details). | |
With the exception of the Ba0.92Ni4Sb6.7Sn5.3 sample, which exhibits the highest filling fraction, component I (see Table I of the ESI‡) consistently shows the biggest quadrupole splitting, which can be related to the more covalent character of the bond53 in the case of Sb NN. The average isomer shifts and quadrupole splittings are shown in Fig. 13 and reasonably agree with the previously reported Mössbauer data on Ni4Sb9Sn3.18
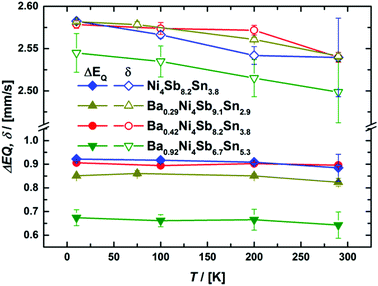 |
| | Fig. 13 Temperature dependent average isomer shift δ (top) and quadrupole splitting ΔEQ (bottom) for the 119Sn Mössbauer spectroscopy. | |
Notably, average isomer shifts and quadrupole splittings in the Ba0.92Ni4Sb6.7Sn5.3 sample significantly differ from the values obtained for the other compounds (see Fig. 13). Considering the available data, a correlation of Mössbauer parameters with the Ba- or Sn-content is, however, rather ambiguous. As there is no indication for a Mössbauer component with Einstein like behavior and/or significant contribution only at low temperature, which would be the case for Sn on the 2a site, the possibility of Sn on the rattling position is ruled out. The relative absorption area of a Mössbauer spectrum is proportional to the Lamb–Mössbauer factor fLM and thus, the temperature dependence of the former can be used to fit fLM within a Debye model:54
| |  | (5.1) |
where
Eγ is the Mössbauer resonance energy,
M is the nuclear mass and
θD is the Debye temperature (sometimes called Mössbauer temperature in this context). For all four skutterudites, the results are displayed in
Fig. 14 including the corresponding Debye temperatures. The latter values obtained from Mössbauer spectroscopy are in good agreement with the Debye temperatures based on the X-ray diffraction and heat capacity measurements (see
Table 7). In particular, the hardening of the host lattice with increasing filling fraction is reflected in the fitted Debye temperatures and exhibits an almost linear dependency with a slope of about 55(11) K per Ba per f.u.
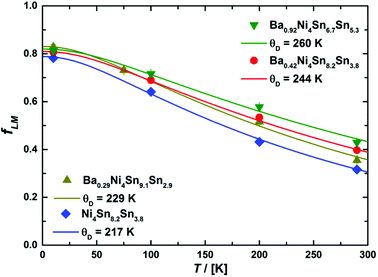 |
| | Fig. 14 Lamb–Mössbauer factors fLM calculated from the relative absorption area within the Debye model (see text for further details). | |
The 121Sb-Mössbauer spectra obtained at 10 K are shown in Fig. 15. They are characterized by a single asymmetric peak, which in the case of 121Sb indicates a quadrupole splitting. All the 121Sb-spectra could be fitted with a single component. The corresponding Mössbauer parameters are summarized in Table II of the ESI.‡ Due to the rather large linewidth of the 121Sb Mössbauer transition, linewidth, quadrupole splitting and the asymmetry term are highly correlated and particularly the asymmetry term cannot be reliably fitted. As fitting with a fixed, vanishing asymmetry term slightly improved the fitting quality when compared to fitting with a fixed, maximal asymmetry term, all the results presented herein were obtained with the vanishing asymmetry term. This aspect and the quadrupole splitting values are in contrast to the reports on CoSb3 mentioned in ref. 55 and 56, which can, however, be attributed to the reduction of Sb content in the present samples. In any case, the present findings validate the sample quality from the Sb perspective.
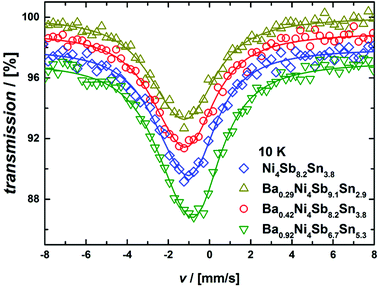 |
| | Fig. 15
121Sb Mössbauer spectra measured at 10 K. All fits (solid lines) were conducted with a fixed, vanishing asymmetry term. | |
6. Specific heat
To gather further information on the vibrational behavior of the filled and unfilled BayNi4Sb12−xSnx skutterudites, specific heat measurements in the temperature range from 3 to 140 K were applied to the single-phase specimens Ni4Sb8.2Sn3.8, Ba0.42Ni4Sb8.2Sn3.8 and Ba0.92Ni4Sb6.7Sn5.3. The data are displayed in Fig. 16 in the form of a Cp/T versus T plot. The specific heat, Cp, of simple non-magnetic materials can be expressed as| | | Cp = Cp,el + Cp,ph = γ·T + β·T3 | (6.1) |
with| |  | (6.2) |
γ is the Sommerfeld coefficient and β is inversely proportional to θD. NA is Avogadro's number, kB is the Boltzmann factor and n stands for the number of atoms per formula unit. Table 7 summarizes the parameters obtained from the least square fitting below 5 K. Fig. 16 suggests a moderate overall lattice softening with increasing Ba and Sn content. To extract the corresponding Einstein temperatures and Einstein frequencies, the specific heat data were analysed by applying two different methods. The first approach was based on an additive combination of the Debye and Einstein models. It is assumed that the phonon spectrum of a polyatomic compound contains three acoustic branches and 3n-3 optical branches, where the acoustic part of the phonon specific heat can be described by the Debye model (eqn (6.3))| |  | (6.3) |
with R being the gas constant and ωD = θD/T.
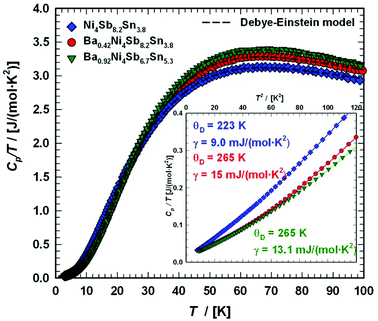 |
| | Fig. 16 Temperature-dependent specific heat divided by temperature Cp/T for Ni4Sb8.2Sn3.8, Ba0.42Ni4Sb8.2Sn3.8 and Ba0.92Ni4Sb6.78Sn5.41. The dashed lines correspond to the least squares fits according to eqn (6.5). | |
Herein, the three acoustic branches are taken as one triply degenerated branch. In a similar way, the Einstein model describes the optical branches,
| |  | (6.4) |
with
ci referring to the degeneracy of the corresponding Einstein modes. The three acoustic and nine optical branches of the phonon dispersion of the Ni
4Sb
12−xSn
x framework are then represented by (12 times) one Debye and two Einstein functions (27·
fE + 9·
fE) with
c1 = 27 and
c2 = 9. To additionally account for the filler atom in the icosahedral voids, a further Einstein function was added to describe the increase of phonon modes, with
c3 = 3·
y, where
y represents the filling level. The heat capacity of the skutterudites follows then from
| |  | (6.5) |
with the sum running over two or three Einstein modes. The least squares fittings obtained according to this model are presented as dashed lines in
Fig. 16 and the extracted data for Einstein and Debye temperatures are also listed in
Table 7.
The second approach uses the model introduced by Junod et al.57,58 to gain insight in the complex phonon spectrum. Special functionals of the phonon specific heat can take the form of convolutions of the phonon spectrum F(ω). Therefore, the electronic part of the specific heat is subtracted from Cp(T) (Cph(T) = Cp(T) − γ·T) and least squares fitting with two estimated Einstein-modes were applied to the phonon specific heat, as shown in Fig. 17, in the form of Cph/T3vs. T. Further details on this method are described for example in ref. 59. In Fig. 17, the corresponding phonon spectra are plotted as solid lines scaled to the right axis. The simple Debye function based on eqn (6.3) is presented as a dotted line using the θD-data extracted together with the Sommerfeld coefficients. A comparison between filled and unfilled skutterudites shows that the filler element Ba has a strong influence on the Ni–Sn–Sb network. These results are also consistent with the increase in the Debye temperature. All data referring to the specific heat are listed in Table 7. The Debye and Einstein temperatures extracted by the two different methods described above match well with each other for all three samples investigated.
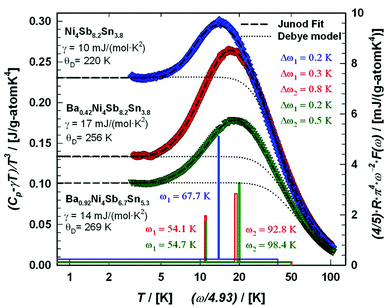 |
| | Fig. 17 Temperature-dependent specific heat of Ni4Sb8.2Sn3.8, Ba0.42Ni4Sb8.2Sn3.8 and Ba0.92Ni4Sb6.7Sn5.3 plotted as (Cp − γ·T)/T3versus ln(T). The least squares fitting was made to the experimental data using the model of Junod et al.57,58 The blue, red and green lines (referring to the right axis) sketch the corresponding phonon spectral functions F(ω) plotted as (4/5)·R·π4·ω−2·F(ω) versus ω/4.93 with ω in Kelvin. For comparison, a simple Debye model is added (dotted lines). | |
7. Electronic and thermal transport
As the BayNi4Sb12−xSnx compound exists within a wide homogeneity region, detailed investigations on the transport properties as a function of the composition were performed.
Electrical resistivity
Fig. 18a shows the temperature dependent electrical resistivities ρ(T) of the unfilled single-phase skutterudite Ni4Sb8.2Sn3.8 and the two Ba-filled skutterudites Ba0.42Ni4Sb8.2Sn3.8 and Ba0.92Ni4Sb6.7Sn5.3. These alloys show relatively low resistivities comparable to those of SnyNi4Sb12−xSnx reported by Grytsiv et al.18 While a decrease in the overall resistivity by filling Ni4Sb8.2Sn3.8 with Ba atoms seems to correlate with an increase of the free carrier concentration, increasing the Sn-content seems to exert the inverse effect. Although the concept introduced by E. Zintl60,61 is based on simple crystal chemistry, it appropriately describes the changes in ρ(T) with the composition of BayNi4Sb12−xSnx alloys on the basis of a simple counting of charge carriers nz, i.e.,| | | nz = y·2(Ba) + 4·10(Ni) − (12 − x)·3(Sb) − x·4(Sn) | (7.1) |
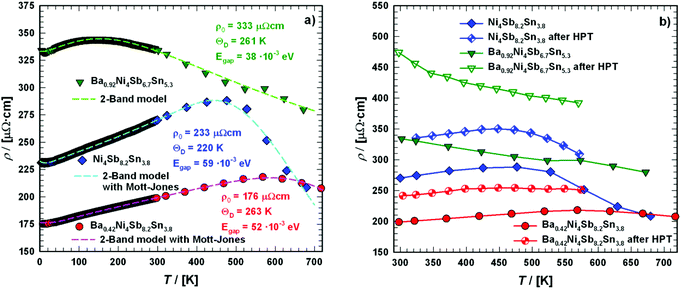 |
| | Fig. 18 Temperature-dependent electrical resistivities ρ of the skutterudites Ni4Sb8.2Sn3.8, Ba0.42Ni4Sb8.2Sn3.8 and Ba0.92Ni4Sb6.7Sn5.3 (a) in the temperature range from 4 to 700 K and (b) when compared before and after SPD via HPT above room temperature. The dashed lines correspond to the least squares fitting according to a two-band model. | |
This composition dependent change of carriers can also be seen from the Seebeck coefficients S(T) of the three samples, as discussed below.
For all the three samples, the temperature dependent electrical resistivity exhibits two different regimes. At low temperatures, a metallic-like behaviour was obtained, which changes to a semiconducting behaviour at higher temperatures, at least up to 700 K. This change cannot be explained by a simple activation-type conductivity mechanism. Thus, a rectangular model for the density of states was considered (2-band model), with a narrow gap lying either slightly above or below the Fermi energy EF,62 which successfully described resistivities ρ(T) of various clathrate and skutterudite systems (see for example ref. 18 and 59). While the former case describes holes as primary charge carriers, the latter one accounts for electrons as the dominating carriers. In these models, the unoccupied states above E = EF are available at T = 0 K. Simple metallic conductivity is possible at low temperatures but becomes semiconducting-like once electrons are excited across the energy gap of width Egap. The total number of carriers (electrons and holes) is strongly dependent on the absolute temperature as well as on Egap. On the basis of these assumptions, ρ(T) can be calculated using
| |  | (7.2) |
where
n0 gives the residual charge carrier density,
n(
T) the total charge carrier density,
ρ0 is the residual resistivity and
ρph accounts for the scattering of electrons on the phonons, taking into account the Bloch Grüneisen law:
| |  | (7.3) |
where

stands for a temperature independent electron–phonon interaction constant and
A·
T3 represents the Mott–Jones term.
63 Least squares fitting according to
eqn (7.2) was performed for Ni
4Sb
8.2Sn
3.8, Ba
0.42Ni
4Sb
8.2Sn
3.8 and Ba
0.92Ni
4Sb
6.7Sn
5.3 extracting
ρ0 and
Egap, which are listed in
Table 8. The Debye temperatures
θD are listed in
Table 7 and can be compared to data obtained using other methods (see below).
Table 8 Comparison of the physical properties for the filled and unfilled BayNi4Sb12−xSnx skutterudites
| Composition |
Filling level |
n
z
|
n × 1020 [cm−3] |
ρ
0 [μΩ cm] |
E
gap![[thin space (1/6-em)]](https://www.rsc.org/images/entities/char_2009.gif) a,b [meV] a,b [meV] |
|
Gained from the fit of temperature dependent electrical resistivity.
Gained from the minimum of the Seebeck coefficient.
|
| Ni4Sb8.2Sn3.8 |
0 |
0.2 |
2.13 |
233 |
59/53 |
| Ba0.42Ni4Sb8.2Sn3.8 |
0.42 |
1.04 |
4.15 |
176 |
52/49 |
| Ba0.92Ni4Sb6.7Sn5.3 |
0.92 |
0.54 |
4.63 |
333 |
38/36 |
Hall data
The Hall effect was studied for all three single-phase samples Ni4Sb8.2Sn3.8, Ba0.42Ni4Sb8.2Sn3.8 and Ba0.92Ni4Sb6.7Sn5.3, revealing electrons as the predominant charge carriers. In Fig. 19, the charge carrier densities for the three samples as a function of temperature are displayed. For Ni4Sb8.2Sn3.8 and Ba0.42Ni4Sb8.2Sn3.8, the charge carrier density does not change with temperature, which is a typical metallic-like behaviour. For Ba0.92Ni4Sb6.7Sn5.3, the early crossover from metallic to semi-conducting behaviour results in an increase of the charge carrier density with increasing temperature.
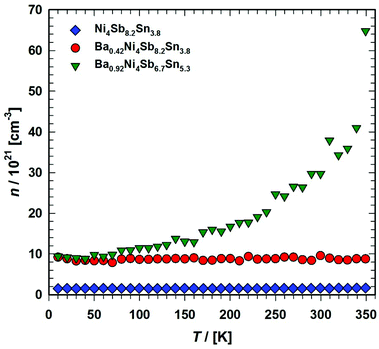 |
| | Fig. 19 Temperature dependent charge carrier densities n of the skutterudites Ni4Sb8.2Sn3.8, Ba0.42Ni4Sb8.2Sn3.8 and Ba0.92Ni4Sb6.7Sn5.3. | |
The charge carrier mobility μ for the three samples Ni4Sb8.2Sn3.8, Ba0.42Ni4Sb8.2Sn3.8 and Ba0.92Ni4Sb6.7Sn5.3 is shown in Fig. 20. The mobility μ was calculated from the relation μ = σ/n·e, with σ being the electrical conductivity, n the charge carrier density and e the carrier charge (in this case electron charge). The temperature independent mobility μ(T) below 100 K was revealed from detailed analysis, i.e., assuming non-degeneracy for charge carriers and a distribution function given by Maxwell–Boltzmann statistics, usually attributed to neutral impurity scattering in semiconductors.59 For Ni4Sb8.2Sn3.8 and Ba0.42Ni4Sb8.2Sn3.8, the decrease in μ with temperature between 100 to 300 K was close to T−1/2, which suggests alloy scattering as the main scattering process. This effect occurs whenever different atoms in the semiconductor compounds are not arranged periodically in the crystal structure.64
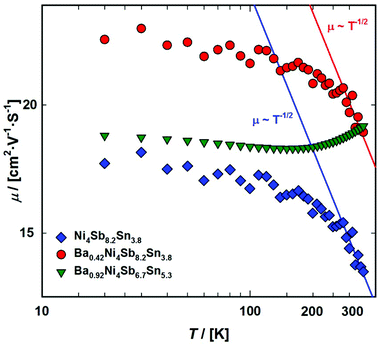 |
| | Fig. 20 Temperature dependent charge carrier mobilities μ of the skutterudites Ni4Sb8.2Sn3.8, Ba0.42Ni4Sb8.2Sn3.8 and Ba0.92Ni4Sb6.7Sn5.3. | |
The electron effective mass m* can be calculated using eqn (7.4), which is usually valid for a single parabolic band at high n and/or low T.65 Evaluation shows a significant increase in the effective mass with increasing filling level, rising from 3.7me for Ni4Sb8.2Sn3.8 to 7.6me for Ba0.42Ni4Sb8.2Sn3.8. For Ba0.92Ni4Sb6.7Sn5.3, a further increase up to a value of 15.2me was found. In addition to the increase in mobility at higher temperature, this indicates that the assumption of a single parabolic band is not valid. The Pisarenko plot (Fig. 21) shows the Seebeck coefficients at 300 K as a function of charge carrier density. The dashed line indicates the maximum thermoelectric performance for the unfilled sample Ni4Sb8.2Sn3.8 at 423 K.
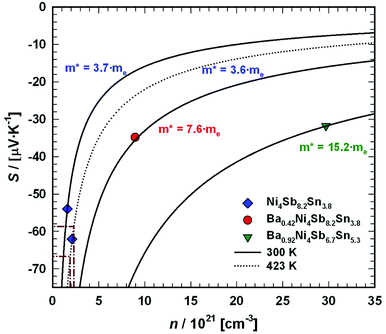 |
| | Fig. 21 Pisarenko plot showing the measured Seebeck coefficients at 300 K for the samples Ni4Sb8.2Sn3.8, Ba0.42Ni4Sb8.2Sn3.8 and Ba0.92Ni4Sb6.7Sn5.3 as a function of the charge carrier density. | |
Thermopower
The temperature-dependent Seebeck coefficients, S(T), for the samples with the composition Ni4Sb8.2Sn3.8, Ba0.42Ni4Sb8.2Sn3.8 and Ba0.92Ni4Sb6.7Sn5.3 are displayed in Fig. 22a. S(T) is negative at low temperatures up to at least 400 K, suggesting that the transport phenomena are dominated by electrons as charge carriers, indicating n-type behaviour. This can be explained by the Zintl concept in parallel to the electrical resistivity, as discussed above. Below about 400 K, S(T) behaves almost linearly before reaching a minimum between 400 and 500 K. The Seebeck coefficient can be understood in terms of Mott's formula:65| |  | (7.4) |
with m* being the effective mass and e the respective charge of the carriers involved. Eqn (7.4) is assumed to be valid for systems without significant electronic correlations.
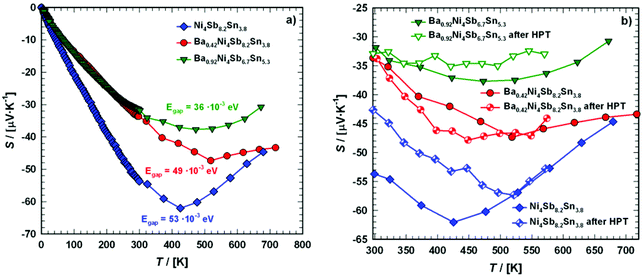 |
| | Fig. 22 Temperature dependent Seebeck coefficient S of the skutterudites Ni4Sb8.2Sn3.8, Ba0.42Ni4Sb8.2Sn3.8 and Ba0.92Ni4Sb6.7Sn5.3 (a) in the temperature range from 4 to 700 K and (b) when compared before and after HPT above room temperature. | |
Furthermore, Goldsmid and Sharp66 showed the possibility for estimating the gap width Egap from the maximum/minimum of S(T), i.e.,
| |  | (7.5) |
As in the present case, S(T) is negative over the entire temperature range investigated, the minima data were inserted into eqn (7.5), leading to the results summarized in Table 8. The estimated gap energies Egap are in accordance with those obtained from temperature dependent electrical resistivity and show a significant decrease from Ba0.42Ni4Sb8.2Sn3.8 to Ba0.92Ni4Sb6.7Sn5.3. A higher Sn content in the network (24g site) appears to influence the band structure more than an increased Ba filling level in the icosahedral voids (2a site).
Thermal conductivity
Fig. 23 presents the temperature-dependent thermal conductivities, κ(T), of the three compounds: Ni4Sb8.2Sn3.8, Ba0.42Ni4Sb8.2Sn3.8 and Ba0.92Ni4Sb6.7Sn5.3.
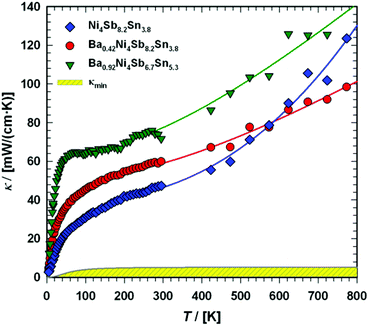 |
| | Fig. 23 Temperature dependent thermal conductivity κ of the skutterudites Ni4Sb8.2Sn3.8, Ba0.42Ni4Sb8.2Sn3.8 and Ba0.92Ni4Sb6.7Sn5.3. The shaded area represents the minimum thermal conductivity κmin. The solid lines are guides for the eye. | |
Radiation losses in the low-temperature steady-state heat flow measurements were corrected subtracting a Stefan–Boltzmann A·T3 term. In general, the thermal conductivities are quite high when compared with those of other skutterudites (see for example ref. 8–11), but they lie in the same range as those obtained by Grytsiv et al.18 for their Sn filled and unfilled SnyNi4Sb12−xSnx compounds. For a more detailed analysis (shown in Fig. 25), only data between 4 and 300 K were taken into account. The total thermal conductivity can be written as
where
κel presents the electronic part and
κph the phonon part. A number of scattering processes limits both contributions, so that a finite thermal conductivity will result in any case. For simple metals,
κel can be calculated from the temperature dependent electrical resistivity
via the Wiedemann Franz law:
| |  | (7.7) |
where the temperature dependent Lorentz number
L0(
T) is given by
| |  | (7.8) |
as proposed by Rowe
et al.67
In order to obtain the correct values for L0(T), the reduced Fermi energy,
| |  | (7.9) |
has to be extracted from the measured Seebeck coefficients according to
| |  | (7.10) |
and
Fn(
ξ) being the
nth order Fermi integral,
| |  | (7.11) |
with
kB being the Boltzmann constant,
e the electron charge,
EF the Fermi energy and
s the scattering parameter. Assuming acoustic phonon scattering as the main carrier scattering mechanism,
s = −1/2,
L0(
T) can be calculated by substituting
s and
ξ in
eqn (7.8). The calculated values for the three compounds, Ni
4Sb
8.2Sn
3.8, Ba
0.42Ni
4Sb
8.2Sn
3.8 and Ba
0.92Ni
4Sb
6.7Sn
5.3 are shown in
Fig. 24, ranging from 2.15 to 2.46 W Ω K
−2.
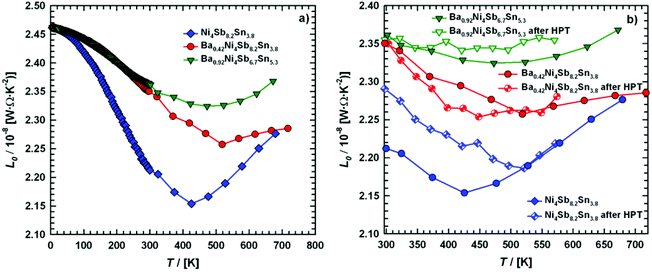 |
| | Fig. 24 (a) Temperature dependent Lorentz number L0 of the skutterudites Ni4Sb8.2Sn3.8, Ba0.42Ni4Sb8.2Sn3.8 and Ba0.92Ni4Sb6.7Sn5.3, and (b) a comparison before and after HPT above room temperature. | |
Subtracting the κel term from the measurement data results in κph, as shown in Fig. 25a, c and e. For all three samples, the electronic part is quite low but is enhanced at higher temperature. According to the Matthiessen rule, the electronic thermal resistivity, Wel of a simple metal can be written in terms of the thermal resistivity, Wel,0 caused by electron scattering due to impurities and defects as well as that caused by electrons scattered due to thermally excited phonons, Wel,ph:
| |  | (7.12) |
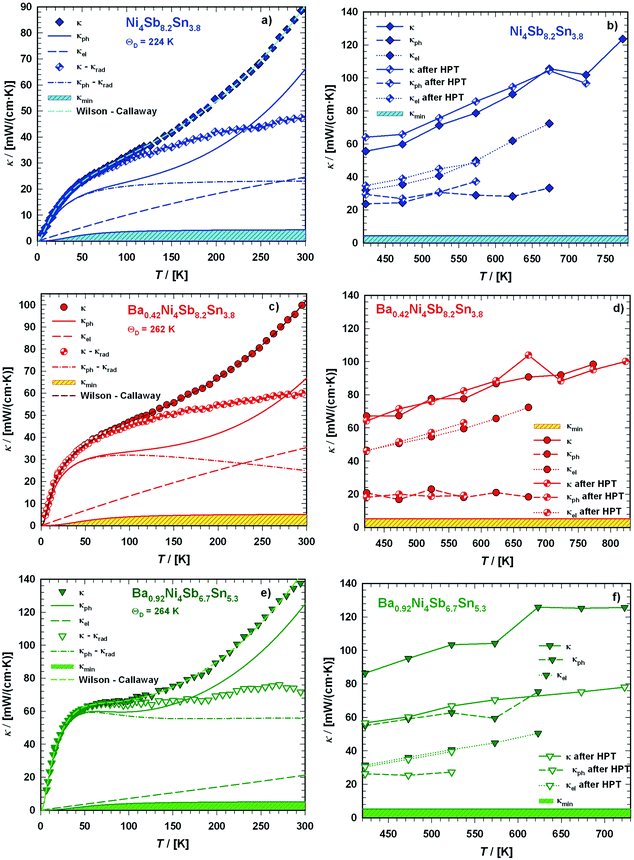 |
| | Fig. 25 Temperature dependent thermal conductivity κ of the skutterudites Ni4Sb8.2Sn3.8, Ba0.42Ni4Sb8.2Sn3.8 and Ba0.92Ni4Sb6.7Sn5.3 at low temperatures ((a), (c), (e)) and above room temperature ((b), (d), (f)) with a comparison to the values measured after HPT. The dashed lines are least squares fits according to a combination of the Wilson and Callaway models. | |
Using the Wilson equation,68Wel,ph can be expressed as
| |  | (7.13) |
with
kF being the wave vector at the Fermi surface,
qD the phonon Debye wave vector and
A a material constant, which depends on the strength of the electron–phonon interaction, Debye temperature, the effective mass of an electron, the number of unit cells per unit volume, Fermi velocity and the electron wavenumber at the Fermi surface. The integrals
Jn have the form,
| |  | (7.14) |
with

. In non-metallic systems, the lattice thermal conductivity is the dominant part of the thermal conduction mechanism, which can be described by a model introduced by Callaway.
69–71 Accordingly, heat carrying lattice vibrations can be described by
| |  | (7.15) |
with the velocity of sound as derived within the Debye model:
| |  | (7.16) |
and
| |  | (7.17) |
where
N is the number of atoms per unit volume and
ω the phonon frequency.
The second integral I2 in eqn (7.15) can be expressed as
| |  | (7.18) |
where
| | | τc−1 = τN−1 + τD−1 + τU−1 + τB−1 + τE−1. | (7.19) |
Here, τN−1, τD−1, τU−1, τB−1 and τE−1 denote the normal 3-phonon scattering process, scattering by low-dimensional lattice defects, Umklapp processes, boundary scattering and scattering of phonons by electrons, respectively.
The dashed lines in Fig. 25a, c and e refer to least squares fitting according to eqn (7.6) assuming a combination of the Wilson and Callaway models for κel and κph. The extracted values for the Debye temperatures θD are listed in Table 7 and show a good agreement with the values gained from various other methods described in this article and compare well with literature data.
The minimum thermal conductivity κmin, presented as shaded area in Fig. 25a, c and e, was estimated by the model of Cahill and Pohl:72,73
| |  | (7.20) |
Here, N is the number of atoms per unit volume and x is a dimensionless parameter connected to the phonon frequency ω via Fig. 25b, d and f compare the situation for temperatures above 300 K. For the two compounds, Ni4Sb8.2Sn3.8 and Ba0.42Ni4Sb8.2Sn3.8, κel is the dominant part of thermal conductivity, whereas κph is of the order of κmin. For Ba0.92Ni4Sb6.7Sn5.3, both the parts, κph as well as κel, are in the same order in magnitude but 2 to 3 times higher than those found for the previous samples. This may be caused by two effects: (i) substitution of Sb with Sn-atoms in the 24g site is combined with an increase in the thermal conductivity, or more likely, as reported in various articles,74,75 (ii) the vibrations of the filler atom are not independent from those of the network atoms.
Figure of merit
The dimensionless figure of merit zT characterizes the thermoelectric ability of a single material concerning power generation or cooling. For commercial applications, a zT above 1 is desirable. The temperature dependent figure of merit can be calculated using eqn (1.1) and is shown in Fig. 26a. Although the electrical resistivity for all the three investigated compounds Ni4Sb8.2Sn3.8, Ba0.42Ni4Sb8.2Sn3.8 and Ba0.92Ni4Sb6.7Sn5.3 is quite low, low absolute values of the Seebeck coefficients S(T) (<70 μV K−1) and high thermal conductivities κ(T) (>20 mW cm−1 K−1) prevent zT from reaching values above 0.11 at RT. As already could be seen from the Pisarenko plot, the highest values for zT are achieved from the unfilled sample Ni4Sb8.2Sn3.8.
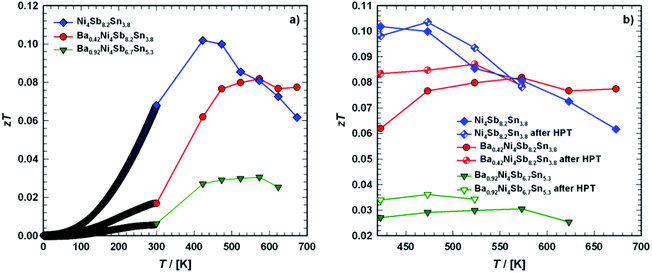 |
| | Fig. 26 Temperature dependent figure of merit zT for the skutterudites Ni4Sb8.2Sn3.8, Ba0.42Ni4Sb8.2Sn3.8 and Ba0.92Ni4Sb6.7Sn5.3 (a) in the temperature range from 4 to 700 K and (b) when compared before and after HPT above room temperature. | |
8. Transport properties after high-pressure torsion (HPT)
Severe plastic deformation (SPD) via HPT is one technique to significantly increase the performance of thermoelectric materials,76–78 with various effects being responsible for this behaviour. Because of the interdependence of ρ, S and κel, one strategy to increase zT is to reduce the κph by increasing the scattering of heat carrying phonons via various mechanisms, as already discussed in chapter 7 in terms of their corresponding relaxation times τn (eqn (7.19)). In general, I2 in eqn (7.18) is negligible for τN ≫ τU. A possible route to decrease κph therefore is either to reduce the grain size dg, because τB−1 = vs/dg, and to increase the density of dislocations, as τD−1 includes the contribution of dislocations. This term consists of the dislocation core,| |  | (8.1) |
with ND being the dislocation density, and of the dislocation strain field,| |  | (8.2) |
Here b represents the Burgers vector of the dislocation. Hence, a smaller grain size and/or higher dislocation density results in enhanced phonon scattering on both electrons as well as on lattice defects and this way decreases κph. Furthermore, Hicks and Dresselhaus79,80 demonstrated that grain sizes, approaching nanometer length scales (favourable <10 nm) are able to influence the Seebeck coefficient. On inspecting Mott's formula (eqn (7.4)), it can be seen that the Seebeck coefficient is primarily dependent on the logarithmic energy derivative of the electronic density of states (DOS) at the Fermi-energy. Therefore, any method that is able to increase the slope at EF for a given number of states N will increase S. HPT uses this concept by the transition from a parabolic electronic DOS curve to a spike-like curve while going from macroscopic bulk structures to nanosized ones. With these observations, a way is opened to influence S independently from ρ and κel. Based on this knowledge, HPT was performed by applying a hydrostatic pressure of 4 GPa, one revolution and a processing temperature of 400 °C on two skutterudite samples, Ni4Sb8.2Sn3.8 and Ba0.42Ni4Sb8.2Sn3.8, whereas for compound Ba0.92Ni4Sb6.7Sn5.3, a temperature of 300 °C was used. During the deformation, the sample's geometry remains constant and the application of enhanced hydrostatic pressure enables practically unlimited plastic strain without early failure and crack formation.81,82 Therefore, with the hydrostatic pressure not only low dimensional defects are created, but also grain boundaries are built up from these defects.82–87 The resulting shear strain corresponds to eqn (2.4); thus, the deformation affects the samples rim more than the centre. Therefore, the physical properties of the processed specimens always cover the more and less deformed parts. Pieces of all parts of the HPT processed samples were collected and used for X-ray powder analysis. In general, an increase in the half width of the X-ray patterns as well as of the lattice parameters was observed, indicating a reduction of the crystallite size and an increase of the dislocation density. For the Ni4Sb8.2Sn3.8 and Ba0.42Ni4Sb8.2Sn3.8 samples, this behaviour is distinct, whereas for compound Ba0.92Ni4Sb6.7Sn5.3, almost no change was visible (Fig. 27). The X-ray peak profile analysis shows a reduction in the grain size for all three samples (Fig. 28), whereas the largest effect was observed for the unfilled sample Ni4Sb8.2Sn3.8 (Fig. 28). In the EPMA micrographs before and after HPT (Fig. 29), no changes in the microstructure were observed. Due to microcracks, the density of the materials after HPT processing was lower than before (compare values given in Table 3 and Table 9). Fig. 18b, 22b, 24b, 25b, d and f summarize the effect of HPT treatment on the physical properties, ρ(T), S(T) and κ(T).
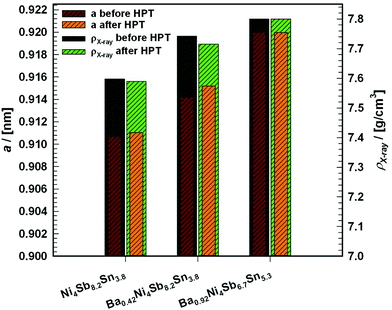 |
| | Fig. 27 Comparison of the lattice parameters a and corresponding X-ray densities ρX-ray of the skutterudites Ni4Sb82Sn3.8, Ba0.42Ni4Sb8.2Sn3.8 and Ba0.92Ni4Sb6.7Sn5.3 before and after SPD via HPT. | |
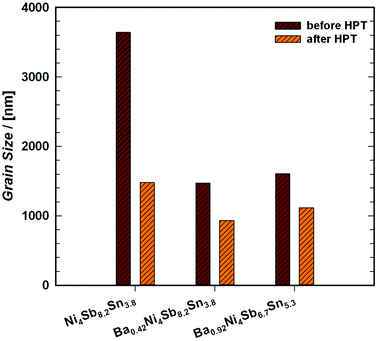 |
| | Fig. 28 Comparison of the grain sizes of the skutterudites Ni4Sb8.2Sn3.8, Ba0.42Ni4Sb8.2Sn3.8 and Ba0.92Ni4Sb6.7Sn5.3 before and after SPD via HPT. | |
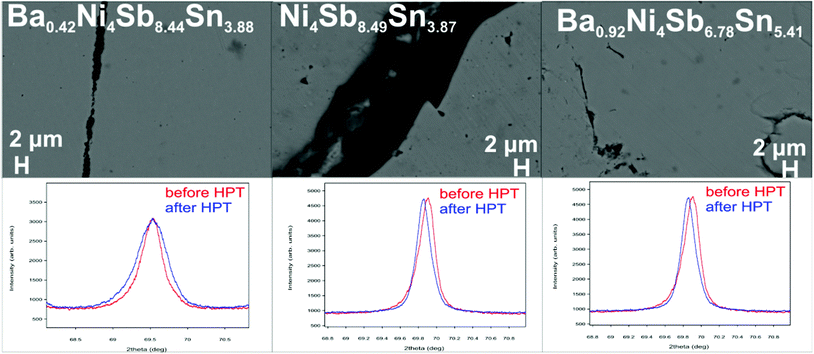 |
| | Fig. 29 Microstructure and X-ray profiles of the skutterudite samples Ni4Sb8.2Sn3.8, Ba0.42Ni4Sb8.2Sn3.8 and Ba0.92Ni4Sb6.7Sn5.3 after HPT. | |
Table 9 Lattice parameters a and corresponding densities for the investigated BayNi4Sb12−xSnx skutterudites after HPT
| Composition |
a [nm] |
ρ
X [g cm−3] |
ρ
s [g cm−3] |
| Ni4Sb8.2Sn3.8 |
0.91103(2) |
7.589 |
7.437 |
| Ba0.42Ni4Sb8.2Sn3.8 |
0.91518(8) |
7.715 |
7.026 |
| Ba0.92Ni4Sb6.7Sn5.3 |
0.91998(3) |
7.801 |
7.414 |
The electrical resistivity for all the samples (Fig. 18b) after HPT was higher. While a crossover from metallic to semiconducting behaviour was observed for Ni4Sb8.2Sn3.8 and Ba0.42Ni4Sb8.2Sn3.8, Ba0.92Ni4Sb6.7Sn5.3 was semiconducting over the entire temperature range investigated. The data for the Seebeck coefficients after HPT (Fig. 22b) stay in the same range as those before HPT or are even slightly lower, which results in no evident change in the temperature dependent Lorentz number L0(T) (Fig. 24b). The thermal conductivity of the Sb-rich samples (Fig. 25b and d) seems to stay almost the same. Determining κel and κph as shown in chapter 5 reveals that neither κel nor κph was influenced significantly, resulting in no-evident change in the thermal conductivity κ. For the Sn-rich sample (Fig. 25f), both components, κel as well as κph, are lowered leading to a decrease in the overall thermal conductivity κ. In contrast to the filled skutterudites without Sb–Sn substitution, all these observations show no significant change in the figure of merit above room temperature (Fig. 26).
9. Thermal expansion
Fig. 30 shows the thermal expansion (Δl/l0) for all the three single-phase samples, Ni4Sb8.2Sn3.8, Ba0.42Ni4Sb8.2Sn3.8 and Ba0.92Ni4Sb6.7Sn5.3, measured with a capacitance dilatometer in the temperature range of 4.2–300 K. Δl/l0 decreases almost linearly within the temperature range from room temperature to about 150 K, whereas for temperatures below 150 K, non-linear behaviour was observed. The data gained from the measurements using a dynamic mechanical analyser with the sample first cooled with liquid nitrogen and afterwards heated up or simply heated from room temperature to 400 K show a linear increase with increasing temperature (Fig. 31). The temperature derivative of the length change defines the thermal expansion coefficient α, i.e.| |  | (9.1) |
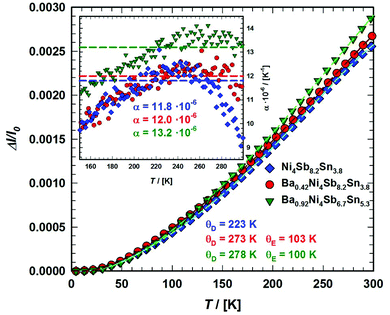 |
| | Fig. 30 Temperature dependent thermal expansion Δl/l0 of the skutterudites Ni4Sb8.2Sn3.8, Ba0.42Ni4Sb8.2Sn3.8 and Ba0.92Ni4Sb6.7Sn5.3 in the temperature range from 4.2 to 300 K. The inset shows the temperature dependence of α, whereas the dashed lines give the values obtained from the slope of the Δl/l0vs. T plot in their linear regions at higher temperatures. | |
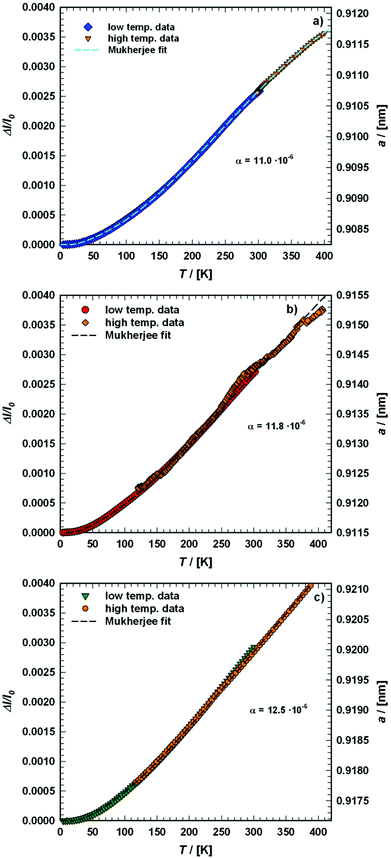 |
| | Fig. 31 Combination of the low and high temperature thermal expansion Δl/l0 data for the skutterudites (a) Ni4Sb8.2Sn3.8, (b) Ba0.42Ni4Sb8.2Sn3.8 and (c) Ba0.92Ni4Sb6.7Sn5.3. The dashed lines correspond to the least squares fits according to eqn (9.3). | |
Applying this model, α was calculated in the temperature range above 150 K up to 300 K (see dashed lines in the insert of Fig. 30) and also from a combination of the low and high temperature measurement data. The corresponding thermal expansion coefficients are listed in Table 7. The values obtained for the current samples lead to a good agreement between the high and low temperature data proven by the combination of the data according to Fig. 31. From Table 7, it follows that the thermal expansion coefficients α for BayNi4Sb12−xSnx based skutterudites lie within the range obtained for other skutterudites.22 A higher value of α occurs with a higher Ba filling level, visible at higher temperatures, which can be associated with the rattling behaviour of Ba on the 2a site inside the structural cage. For a cubic material, the lattice parameter varies with the temperature in parallel to the thermal expansion coefficient. Therefore, the lattice parameters an at various temperatures can be derived if an at a certain temperature is known, by applying eqn (9.2).
| |  | (9.2) |
The values according to all three specimens were added to Fig. 31. The higher Ba filling level results in larger lattice parameters for Ba0.42Ni4Sb8.2Sn3.8 and Ba0.92Ni4Sb6.7Sn5.3 when compared to Ni4Sb8.2Sn3.8. To analyse the thermal expansion as a function of temperature over the entire temperature range from 4.2 to 400 K, a semi-classical model, introduced by Mukherjee88 was used. This model takes into account three- and four-phonon interactions, considering anharmonic potentials and uses both the Debye model for the acoustic phonons and the Einstein model for the optical modes. The length change Δl/l(T0) is then given by
| |  | (9.3) |
with
| |  | (9.4) |
and
ε of the form,
| |  | (9.5) |
Herein, ξ stands for the electronic contribution to the average lattice displacement, θD is the Debye temperature, θE is the Einstein temperature and p is the average number of phonon branches actually exited over the temperature range with G, F, c, and g being material constants. Least squares fitting to the experimental data according to eqn (9.3) were added to Fig. 30 and 31 as dashed lines. The values obtained for θD and θE are listed in Table 7 and can be compared with the data gained from fitting to the electrical resistivity, thermal conductivity and specific heat. This comparison shows good agreement among data from the various methods as well as with those available in the literature.
10. Elastic properties
As the average symmetry of skutterudites is isotropic, the Young's modulus E and Poisson's ratio ν can be gained by fitting the variables of the materials eigenfrequencies obtained from the RUS measurements of all three single-phase samples Ni4Sb8.2Sn3.8, Ba0.42Ni4Sb8.2Sn3.8 and Ba0.92Ni4Sb6.7Sn5.3. Based on these data, all other elastic properties were calculated. The shear modulus G and the bulk modulus B can be obtained from| |  | (10.1) |
and| |  | (10.2) |
For an isotropic material, the elastic constant C11 is given by
| |  | (10.3) |
The longitudinal (vL) and the transversal (vT) sound velocities can be derived from one of the following relations:
Herein, ρs is the samples’ density measured via Archimedes’ principle. From the knowledge of vL and vT, the materials mean sound velocity vm can be calculated using eqn (10.6).
| |  | (10.6) |
Anderson's relation89 yields the Debye temperature θD from the elastic properties measurements.
| |  | (10.7) |
In eqn (10.7), h denotes Plank's constant, kB is the Boltzmann constant, NA is Avogadro's number, M is the molecular weight and nASU stands for the number of atoms in the asymmetric unit. The data extracted for compounds Ni4Sb8.2Sn3.8, Ba0.42Ni4Sb8.2Sn3.8 and Ba0.92Ni4Sb6.7Sn5.3 are listed in Table 10 and are shown in Fig. 32. A comparison with the elastic property data available in the literature (see for example ref. 23) shows that BayNi4Sb12−xSnx based skutterudites are characterized by a rather low Young's modulus and high Poisson's ratio, continuing this trend for the bulk modulus, longitudinal (vL), transversal (vT) and mean sound velocity. The extracted Debye temperatures (see Table 7) lie in the same range as the values gathered using other methods, as listed in the previous chapters.
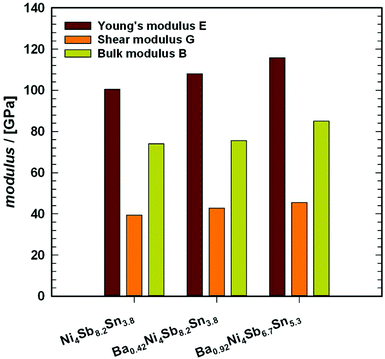 |
| | Fig. 32 Comparison of the Young's-, Shear- and Bulk-modulus obtained for the skutterudites Ni4Sb8.2Sn3.8, Ba0.42Ni4Sb8.2Sn3.8 and Ba0.92Ni4Sb6.7Sn5.3. | |
Table 10 Elastic properties of the BayNi4Sb12−xSnx skutterudites investigated
| Composition |
ν
|
E [GPa] |
G [GPa] |
B [GPa] |
C
11 [GPa] |
C
44 [GPa] |
v
L × 105 [cm s−1] |
v
T × 105 [cm s−1] |
v
m × 105 [cm s−1] |
| Ni4Sb8.2Sn3.8 |
0.274 |
100.49 |
39.44 |
74.11 |
126.69 |
39.44 |
4.11 |
2.29 |
2.55 |
| Ba0.42Ni4Sb8.2Sn3.8 |
0.262 |
108.00 |
42.79 |
75.63 |
132.68 |
42.79 |
4.19 |
2.38 |
2.64 |
| Ba0.92Ni4Sb6.7Sn5.3 |
0.273 |
115.8 |
45.48 |
85.02 |
145.67 |
45.48 |
4.35 |
2.43 |
2.71 |
11. Vickers hardness (HV)
Hardness is a measure for a the strength of a solid, i.e., the material's resistance against plastic deformation under an applied force and is dependent on ductility, elastic stiffness, plasticity, strain, strength, toughness, visco-elasticity and viscosity. This was the reason to perform the Vickers hardness test on a series of alloys, including the three single-phase bulk samples Ni4Sb8.2Sn3.8, Ba0.42Ni4Sb8.2Sn3.8 and Ba0.92Ni4Sb6.7Sn5.3 particularly on skutterudite crystallites above 200 nm in size. As the Vickers method is an indentation measurement, the specimen's resistance is determined against deformation due to a constant compression load from a sharp object. Fig. 33 shows the results for the skutterudites in the multiphase samples, while Fig. 34 presents data for the single-phase samples. A comparison with the data available in the literature (see for example ref. 23) shows that the HV of the BayNi4Sb12−xSnx skutterudites lay perfectly within the range of other skutterudites. From the measurements performed on the single-phase samples, two trends can be derived (Fig. 35): the hardness seems to decrease with (i) increasing Ba and Sn content and (ii) increasing Young's modulus and shear modulus. For the compounds, Ni4Sb8.49Sn3.87, Ba0.42Ni4Sb8.44Sn3.88 and Ba0.92Ni4Sb6.78Sn5.41, the Vickers hardness after HPT processing (Fig. 34 and 35) shows no measurable change.
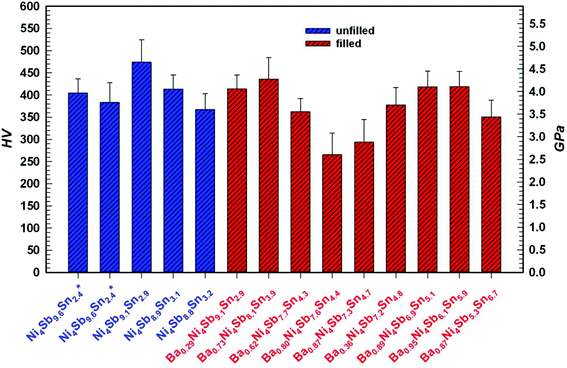 |
| | Fig. 33 Comparison of the Vicker's hardness HV for the various filled and unfilled Ni–Sn–Sb based skutterudites (* skutterudite composition in two different alloys). | |
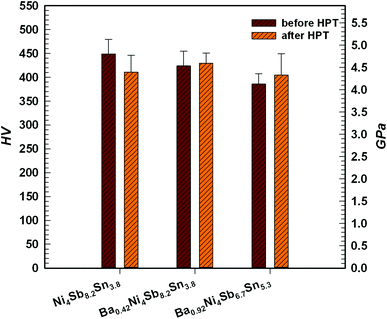 |
| | Fig. 34 Comparison of the Vicker's hardness HV for the skutterudite single-phase samples Ni4Sb8.2Sn3.8, Ba0.42Ni4Sb8.2Sn3.8 and Ba0.92Ni4Sb6.7Sn5.3 before and after HPT. | |
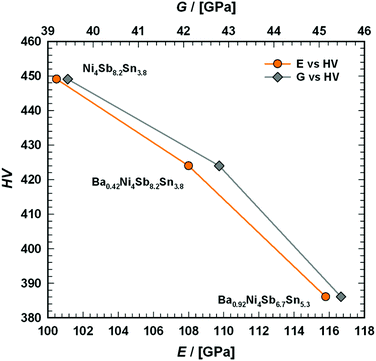 |
| | Fig. 35 Comparison of the Young's- and Shear-modulus in dependence of the Vicker's hardness HV for the skutterudites Ni4Sb8.2Sn3.8, Ba0.42Ni4Sb8.2Sn3.8 and Ba0.92Ni4Sb6.7Sn5.3. | |
12. Electron and phonon mean free path
To learn more about the transport properties caused by electrons and phonons, their mean free paths were calculated using simple models and then discussed in comparison with the resistivity and thermal conductivity data. Assuming a three-dimensional system with a spherical Fermi surface,90 the mean free path ![[small script l]](https://www.rsc.org/images/entities/i_char_e146.gif) el of the electrons can be calculated from the measured resistivity data,
el of the electrons can be calculated from the measured resistivity data,| |  | (12.1) |
Herein, e is the electronic charge and ħ is the reduced Planck's constant. The Fermi wave vector kF can be approximated by
| |  | (12.2) |
with
a as the lattice parameter.
Fig. 36 displays the temperature dependence of the electronic mean free path for the three single-phase samples, Ni
4Sb
8.2Sn
3.8, Ba
0.42Ni
4Sb
8.2Sn
3.8 and Ba
0.92Ni
4Sb
6.7Sn
5.3. For all three specimens,
![[small script l]](https://www.rsc.org/images/entities/i_char_e146.gif) el
el is five to ten times higher than the lattice parameter
a. This confirms the quite low resistivity
ρ(
T) found in these alloys. It seems that Ba filling in the 2a site has a positive effect on
![[small script l]](https://www.rsc.org/images/entities/i_char_e146.gif) el
el, whereas increasing the Sn content in site 24g decreases
![[small script l]](https://www.rsc.org/images/entities/i_char_e146.gif) el
el.
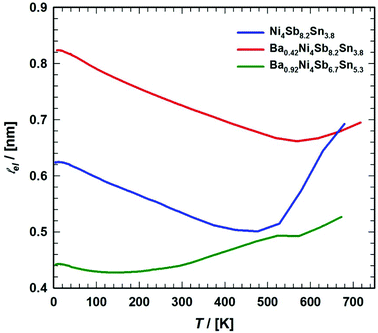 |
| | Fig. 36 Temperature dependent electron mean free paths ![[small script l]](https://www.rsc.org/images/entities/i_char_e146.gif) el obtained for the skutterudites Ni4Sb8.2Sn3.8, Ba0.42Ni4Sb8.2Sn3.8 and Ba0.92Ni4Sb6.7Sn5.3. el obtained for the skutterudites Ni4Sb8.2Sn3.8, Ba0.42Ni4Sb8.2Sn3.8 and Ba0.92Ni4Sb6.7Sn5.3. | |
From a simple kinetic theory, one can also estimate the phonon mean free path (eqn (12.3)), which is an important parameter for thermal conductivity:28
| |  | (12.3) |
In addition to the electronic part κel, heat transport is conducted by phonons with a group velocity vg and mean free path lengths ![[small script l]](https://www.rsc.org/images/entities/i_char_e146.gif) ph between the scattering processes. The amount of transported heat is also proportional to the molar heat capacity Cv. For the group velocity vg, a common approximation takes the mean sound velocity vm. Taking our data from elastic properties measurements, Cv can then be calculated by
ph between the scattering processes. The amount of transported heat is also proportional to the molar heat capacity Cv. For the group velocity vg, a common approximation takes the mean sound velocity vm. Taking our data from elastic properties measurements, Cv can then be calculated by
| |  | (12.4) |
with the measured heat capacity
Cp, the thermal expansion coefficient
α and the molar volume
Vm.
β is the isothermal compressibility, with
β = 1/
B and
B being the bulk modulus (see our data above). As for a solid
Cp ≈
Cv, the comparison between the calculated values for
Cv and the measured values for
Cp (
Fig. 16 and
37) confirms that
eqn (12.4) holds true in the affected temperature range.
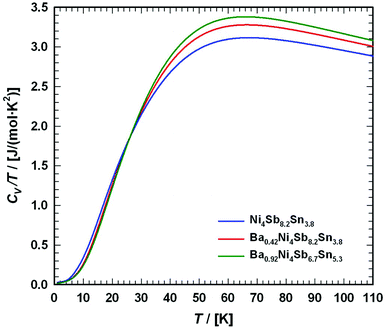 |
| | Fig. 37 Temperature-dependent specific heat divided by temperature Cv/T for Ni4Sb8.2Sn3.8, Ba0.42Ni4Sb8.2Sn3.8 and Ba0.92Ni4Sb6.7Sn5.3. | |
The results for the phonon mean free path lengths in the temperature range from 4 to 110 K are shown in Fig. 38. As one of the many strategies in designing high performance thermoelectric materials is to decrease κph by increasing the phonon scattering, one can see from Fig. 38 that for BayNi4Sb12−xSnx skutterudites, this cannot be done via filling the 2a site with Ba as a rattling atom.
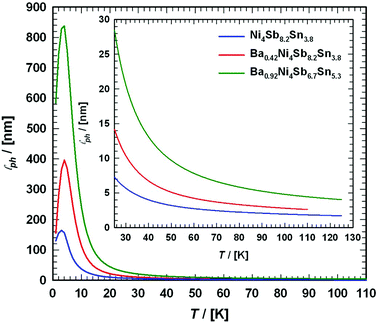 |
| | Fig. 38 Temperature dependent electron mean free paths ![[small script l]](https://www.rsc.org/images/entities/i_char_e146.gif) ph for the skutterudites Ni4Sb8.2Sn3.8, Ba0.42Ni4Sb8.2Sn3.8 and Ba0.92Ni4Sb6.7Sn5.3. ph for the skutterudites Ni4Sb8.2Sn3.8, Ba0.42Ni4Sb8.2Sn3.8 and Ba0.92Ni4Sb6.7Sn5.3. | |
As demonstrated in various papers,74,75 the reason for this may stem from the fact that the vibrational modes of the rattling atom are not entirely independent from the framework vibrations: the small icosahedral voids in BayNi4Sb12−xSnx squeeze the Ba-filler atoms into tight bonding (for relative cage sizes see chapter 4). It should be recalled here that reduction of the cage volume in isotypic EuFe4Sb12 by external pressure significantly changes the phonon structure increasing the “rattling mode” above the optical mode without avoided crossing.91
13. Conclusion
Phase equilibria in the ternary system Ni–Sn–Sb have been determined for the isothermal section at 450 °C, revealing a rather large extension of the Ni4Sn12−xSnx homogeneity region from 2.4 ≤ x ≤ 3.2. A combination of literature data and DTA measurements enabled us to determine the solidus surface for the unfilled Ni4Sn12−xSnx phase as well as for the Ba-filled BayNi4Sn12−xSnx skutterudite phase. The Ba- and Sn-concentration dependent homogeneity region of the BayNi4Sn12−xSnx phase was established. Although the homogeneity region seems to extend into a p-type region, so far only n-type material was obtained.
Single-phase skutterudites samples with the composition Ni4Sb8.2Sn3.8, Ba0.42Ni4Sb8.2Sn3.8 and Ba0.92Ni4Sb6.7Sn5.3 have been successfully prepared and characterised by their physical and mechanical properties with respect to their formation and crystal structure. Resistivity data were within a crossover from metallic to semiconducting behaviour and were successfully modeled in terms of a temperature-dependent carrier concentration in a rectangular density of states with the Fermi energy slightly below a narrow gap. The corresponding narrow gap widths – extracted from maxima in the Seebeck coefficient data as a function of temperature – are ranged about 0.050 eV. Although the resistivity ρ(T) of the compounds investigated (Ni4Sb8.2Sn3.8, Ba0.42Ni4Sb8.2Sn3.8 and Ba0.92Ni4Sb6.7Sn5.3) is quite low, the rather large thermal conductivity κ(T) prevents the material from reaching attractive figures of merit, zT. The Debye and Einstein temperatures gathered by various methods lie within the same range and are therefore comparable to those of other skutterudites and consistent with high levels of lattice thermal conductivity. As one of the reasons for the low zT, the Ba filler atoms with rather small ADPs (atom displacement factors) at the centres of tight Ni4(Sb,Sn)12 cages are unable to significantly decrease the phonon mean free paths and constitute a severe reduction of the “rattling behaviour”.
Severe plastic deformation (SPD) via high-pressure torsion (HPT) was used to introduce nanostructuring; however, the physical properties before and after HPT showed no significant effect on the materials thermoelectric behaviour.
Acknowledgements
This study was funded by the Austrian FWF as part of the project no. P224380-N20. Financial support by the German Research Society (DFG) within the framework of priority program SPP 1386 is acknowledged (BK). RPH acknowledges support from the U.S. Department of Energy, Office of Science, Basic Energy Sciences, Materials Sciences and Engineering Division.
References
- Y. Gelbstein, Z. Dashevsky and M. P. Dariel, Physica B, 2007, 396(1–2), 16–21 CrossRef CAS.
- J. Davidow and Y. Gelbstein, J. Electron. Mater., 2013, 42(7), 1542–1549 CrossRef CAS.
- K. Kirievsky, Y. Gelbstein and D. Fuks, J. Solid State Chem., 2013, 203, 247–254 CrossRef CAS.
- Y. Gelbstein, N. Tal, A. Yamek, Y. Rosenberg, M. P. Moshe, S. Ouardi, B. Balke, C. Felser and M. Kohne, J. Mater. Res., 2011, 26(15), 1919–1924 CrossRef CAS.
- Y. Sadia, L. Dinnerman and Y. Gelbstein, J. Electron. Mater., 2013, 42(7), 1926–1931 CrossRef CAS.
-
C. Uher, Thermoelectric Materials Research I, ed. T. M. Tritt, Elsevier, 2001, pp. 139–253 Search PubMed.
- G. J. Snyder and E. S. Toberer, Nat. Mater., 2008, 7(2), 105–114 CrossRef CAS PubMed.
- X. Shi, J. Yang, J. R. Salvador, M. Chi, J. Y. Cho, H. Wang, S. Bai, J. Yang, W. Zhang and L. Chen, J. Am. Chem. Soc., 2011, 133(20), 7837–7846 CrossRef CAS PubMed.
- G. Rogl, A. Grytsiv, P. Rogl, N. Peranio, E. Bauer, M. Zehetbauer and O. Eibl, Acta Mater., 2014, 63, 30–43 CrossRef CAS.
- G. Rogl, A. Grytsiv, P. Rogl, E. Bauer and M. Zehetbauer, Intermetallics, 2001, 19(4), 546–555 CrossRef.
- G. Rogl, A. Grytsiv, P. Rogl, E. Bauer and M. Zehetbauer, Solid State Phenomena, 2011, 170, 240–243 CrossRef CAS.
-
M. D. Hornbostel, K. Sellinschegg and D. C. Johnson, Thermoelectric Materials - New Directions and Approaches, Mater. Res. Soc. Symp. Proc. Ser., Pittsburgh, 1997, vol. 478, p. 211 Search PubMed.
- M. D. Hornbostel, E. J. Hyer, J. Thiel and D. C. Johnson, J. Am. Chem. Soc., 1997, 119(11), 2665–2668 CrossRef CAS.
- G. S. Nolas, H. Takizawa, T. Endo, H. Sellinschegg and D. C. Johnson, Appl. Phys. Lett., 2000, 77(1), 52–54 CrossRef CAS.
- H. Takizawa, K. Miura, M. Ito, T. Suzuki and T. Endo, J. Alloys Compd., 1999, 282(1–2), 79–83 CrossRef CAS.
- H. Takizawa, M. Ito, K. Uheda and T. Endo, J. Ceram. Soc. Jpn., 2000, 108(June), 530–534 CrossRef CAS.
-
H. Takizawa, K. Okazaki, K. Uheda and T. Endo, MRS Fall Meeting (Boston, MA, Nov., 2001) (abstracts), 2001, p. 123;
H. Takizawa, K. Okazaki, K. Uheda and T. Endo, MRS Fall Meeting (Boston, MA, Nov. 2001) (Mater. Res. Soc. Symp. Proc. Ser. vol 691), 2002.
- A. Grytsiv, P. Rogl, St. Berger, Ch. Paul, H. Michor, E. Bauer, G. Hilscher, R. Ferro, T. Roisnel and H. Noel, J. Phys.: Condens. Matter, 2002, 14(29), 7071–7090 CrossRef CAS.
- R. Mishra, A. Kroupa, A. Zemanova and H. Ipser, J. Electron. Mater., 2013, 42(4), 646–653 CrossRef CAS.
- G. Rogl, A. Grytsiv, N. Melnychenko-Koblyuk, E. Bauer, S. Laumann and P. Rogl, J. Phys.: Condens. Matter, 2011, 23(27), 275601 CrossRef CAS PubMed.
- G. Rogl, A. Grytsiv, E. Bauer, P. Rogl and M. Zehetbauer, Intermetallics, 2010, 18(1), 57–64 CrossRef CAS.
- G. Rogl, L. Zhang, P. Rogl, A. Grytsiv, M. Falmbigl, D. Rajs, M. Kriegisch, H. Müller, E. Bauer, J. Koppensteiner, W. Schranz, M. Zehtbauer, Z. Henkie and B. Maple, J. Appl. Phys., 2010, 107(4), 043507 CrossRef.
- G. Rogl and P. Rogl, Sci. Adv. Mater., 2011, 3(4), 517–538 CrossRef CAS.
- G. Rogl, A. Grytsiv, E. Royanian, P. Heinrich, E. Bauer, P. Rogl, M. Zehetbauer, S. Puchegger, M. Reinecker and W. Schranz, Acta Mater., 2013, 61(11), 4066–4079 CrossRef CAS.
- R. C. Mallik, R. Anbalagan, G. Rogl, E. Royanian, P. Heinrich, E. Bauer, P. Rogl and S. Suwas, Acta Mater., 2013, 61(18), 6698–6711 CrossRef CAS.
- M. Llunell, P. Alemany, S. Alvarez, V. P. Zhukov and A. Vernes, Phys. Rev. B: Condens. Matter, 1996, 53(16), 10605–10609 CrossRef CAS.
- W. Jeitschko, A. J. Foecker, D. Paschke, M. V. Dewalsky, Ch. B. H. Evers, B. Kunnen, A. Lang, G. Kotzyba, U. Ch. Rodewald and M. H. Moller, Z. Anorg. Allg. Chem., 2000, 626(5), 1112–1120 CrossRef CAS.
- E. S. Toberer, A. F. May and G. J. Snyder, Chem. Mater., 2010, 22(3), 624–634 CrossRef CAS.
-
K. Ishida and T. Nishizawa, Binary Alloy Phase Diagrams, ed. T. B. Massalski, H. Okamoto, P. R. Subramanian and L. Kacprzak, ASM International, Materials Park, Ohio, 2nd edn, 1990, vol. 1, pp. 269–270 Search PubMed.
- H. Okamoto, J. Phase Equilib., 1991, 12(2), 244–245 CrossRef.
-
W. Wacha, PhD Thesis, Vienna University of Technology, 1989.
-
J. Rodriguez-Carvajal, Satellite Mtg on Powder Diffraction of the 15th Congr. of the International Union of Crystallography (Toulouse, France) (abstracts), 1990, p. 127.
-
Nonius Kappa CCD Program Package COLLECT, DENZO, SCALEPACK, SORTAV, Nonius Delft, The Netherlands, 1998 Search PubMed.
-
G. M. Sheldrick, SHELXL-97: Program for crystal structure refinement, University of Göttingen, Germany; Windows version OSCAIL by McArdle, Natl. Univ. Ireland, Galway; 1997 Search PubMed.
- E. Bauer, A. Galatanu, H. Michor, G. Hilscher, P. Rogl, P. Boulet and H. Noel, Eur. Phys. J. B, 2000, 14(3), 483–493 CrossRef CAS.
- M. Rotter, H. Müller, E. Gratz, M. Dörr and M. Löwenhaupt, Rev. Sci. Instrum., 1998, 69(7), 2742–2746 CrossRef CAS.
- G. Braendii and R. Griessen, Cryogenics, 1973, 13(5), 299–302 CrossRef CAS.
- J. Genossar and M. Steinitz, Rev. Sci. Instrum., 1990, 61(9), 2469–2471 CrossRef CAS.
- J. Koppensteiner, W. Schranz and M. R. Puica, Phys. Rev. B: Condens. Matter, 2008, 78(5), 054203 CrossRef.
- W. Schranz, Phase Transitions, 1997, 64(1–2), 103–114 CrossRef CAS.
- W. Schranz and D. Havlik, Phys. Rev. Lett., 1994, 73(19), 2575–2578 CrossRef CAS PubMed.
-
R. Wyslouzil, Ph.D. thesis, University of Vienna, 1985.
- A. Migliori, J. L. Sarrao, W. M. Visscher, T. M. Bell, M. Lei, Z. Fisk and R. G. Leisure, Physica B, 1993, 183(1–2), 1–24 CrossRef CAS.
- P. Scherrer, Nachr. Ges. Wiss. Göttingen, 1918, 96–100 CAS.
- L. Zhang, A. Grytsiv, M. Kerber, P. Rogl, E. Bauer, M. J. Zehetbauer, J. Wonsik and G. E. Nauer, J. Alloys Compd., 2009, 481(1–2), 106–115 CrossRef CAS.
- C. Schmetterer, H. Flandorfer, K. W. Richter, U. Saeed, M. Kauffman, P. Roussel and H. Ipser, Intermetallics, 2007, 15(7), 869–884 CrossRef CAS.
-
G. H. Cha, S. Y. Lee and P. Nash, Binary Alloy Phase Diagrams, ed. T. B. Massalski, H. Okamoto, P. R. Subramanian and L. Kacprzak, ASM International, Materials Park, Ohio, 2nd edn, 1990, vol. 3, pp. 2853–2855 Search PubMed.
-
J. Polt, Master Thesis, University of Vienna, 2014.
- W. Burkhardt and K. Schubert, Z. Metallkd., 1959, 50, 442–452 CAS.
- L. M. Gelato and E. Parthé, J. Appl. Crystallogr., 1987, 20, 139–143 CrossRef.
- E. Koch and W. Fischer, Z. Kristallogr., 1996, 211(4), 251–253 CAS.
- D. J. Braun and W. Jeitschko, J. Less-Common Met., 1980, 72(1), 147–156 CrossRef CAS.
- J. Lees and P. A. Flinn, Phys. Lett., 1965, 19(3), 186–188 CrossRef CAS.
-
P. Gütlich, E. Bill and A. X. Trautwein, Mössbauer Spectroscopy and Transition Metal Chemistry, Springer, Berlin, 2011, pp. 13–15 Search PubMed.
- I. Devos, M. Womes, M. Heilemann, J. Olivier-Fourcade, J.-C. Jumas and J. L. Tirado, J. Mater. Chem., 2004, 14(11), 1759–1767 RSC.
- I. Lefebvre-Devos, M. Lassalle, X. Wallart, J. Olivier-Fourcade, L. Monconduit and J. C. Jumas, Phys. Rev. B: Condens. Matter, 2005, 63(12), 125110 CrossRef.
- A. Junod, D. Bichsel and J. Mueller, Helv. Phys. Acta, 1979, 52(5–6), 580–596 CAS.
- A. Junod, T. Jarlborg and J. Mueller, Phys. Rev. B: Condens. Matter, 1983, 27(3), 1568–1585 CrossRef CAS.
- N. Melnychenko-Koblyuk, A. Grytsiv, St. Berger, H. Kaldarar, H. Michor, F. Roehrbacher, E. Royanian, E. Bauer, P. Rogl, H. Schmid and G. Giester, J. Phys.: Condens. Matter, 2007, 19(4), 046203 CrossRef.
-
S. M. Kauzlarich, Encyclopedia of Inorganic chemistry, ed. R. B. King, Wiley, New York, 2nd edn, 2005 Search PubMed.
-
S. C. Sevov, Zintl Phases in Intermetallic Compounds, Principles and Practice: Progress, ed. J. H. Westbrook and R. L. Freisher, John Wiley & Sons. Ltd., Chichester, 2002, pp. 113–132 Search PubMed.
-
St. Berger, PhD Thesis, Vienna University of Technology, 2003.
- J. H. Chiu, Phys. Rev. B: Solid State, 1976, 13(4), 1507–1514 CrossRef CAS.
-
C. Hamaguchi, Basic Semiconductor Physics, Springer, Berlin, 2nd edn, 2010, ch. 6 Search PubMed.
-
F. J. Blatt, Physics of electronic conduction in solids, McGraw-Hill, New York, 1968 Search PubMed.
- H. J. Goldsmid and J. W. Sharp, J. Electron. Mater., 1999, 28(7), 869–872 CrossRef CAS.
-
D. W. Rowe and C. M. Bhandari, Modern Thermoelectrics, Reston Publishing Comp., Virginia, USA, 1983 Search PubMed.
- H. Wilson, Math. Proc. Camb. Phil. Soc., 1937, 33(3), 371–379 CrossRef.
- J. Callaway and H. C. von Baeyer, Phys. Rev., 1960, 120, 1149–1154 CrossRef CAS.
- J. Callaway, Phys. Rev., 1959, 113, 1046–1051 CrossRef CAS.
- J. Callaway, Phys. Rev., 1961, 122, 787–790 CrossRef CAS.
- D. Cahill and R. Pohl, Solid State Commun., 1989, 70(10), 927–930 CrossRef.
- K. Gianno, A. V. Sologubenko, M. A. Chernikov, H. R. Ott, I. R. Fisher and P. C. Canfield, Phys. Rev. B: Condens. Matter, 2000, 62(1), 292–300 CrossRef CAS.
- M. Christensen, A. B. Abrahamsen, N. B. Christensen, F. Juranyi, N. H. Andersen, K. Lefmann, J. Andreasson, C. R. Bahl and B. B. Iversen, Nat. Mater., 2008, 7(10), 811–815 CrossRef CAS PubMed.
- M. M. Koza, M. R. Johnson, R. Viennois, H. Mutka, L. Girard and D. Ravot, Nat. Mater., 2008, 7(10), 805–810 CrossRef CAS PubMed.
- G. Rogl, M. Zehetbauer, M. Kerber, P. Rogl and E. Bauer, Mater. Sci. Forum, 2011, 667–669, 1089–1094 CAS.
- G. Rogl, D. Setman, E. Schafler, J. Horky, M. Kerber, M. Zehetbauer, M. Falmbigl, P. Rogl, E. Royanian and E. Bauer, Acta Mater., 2012, 60(5), 2146–2157 CrossRef CAS.
- G. Rogl, Z. Aabdin, E. Schafler, J. Horky, D. Setman, M. Zehetbauer, M. Kriegisch, O. Eibl, A. Grytsiv and E. Bauer,
et al.
, J. Alloys Compd., 2012, 537, 183–189 CrossRef CAS.
- L. D. Hicks, T. C. Harman and T. C. Dresselhaus, Appl. Phys. Lett., 1993, 63(23), 3230–3232 CrossRef CAS.
-
M. S. Dresselhaus and J. P. Heremans, Thermoelectrics handbook, Wiley, New York, 2003, p. 1338 Search PubMed.
-
M. J. Zehetbauer and Y. Estrin, Bulk nanostructured materials, ed. M. J. Zehetbauer and Y. T. Zhu, VCH Wiley, New York, 2009 Search PubMed.
- L. Zhang, A. Grytsiv, B. Bonarski, M. Kerber, D. Setman, E. Schafler, P. Rogl, E. Bauer, G. Hirschler and M. Zehetbauer, J. Alloys Compd., 2010, 494(1–2), 78–83 CrossRef CAS.
- E. Schafler, A. Dubravina, B. Mingler, H. P. Karnthaler and M. Zehetbauer, Mater. Sci. Forum, 2006, 503–504, 57–64 Search PubMed . See also: G. M. Sheldrick, Acta Crystallogr., Sect. A: Fundam. Crystallogr., 2008, 64(Pt 1), 112–122 CrossRef CAS PubMed.
- T. Ungar and M. Zehetbauer, Scr. Mater., 1996, 35(12), 1467–1473 CrossRef CAS.
- M. Zehetbauer and V. Seumer, Acta Metall. Mater., 1993, 41(2), 577–588 CrossRef CAS.
- M. Zehetbauer, H. P. Stuwe, A. Vorauer, E. Schafler and J. Kohout, Adv. Eng. Mater., 2003, 5(5), 330–337 CrossRef CAS.
- M. Zehetbauer, E. Schafler, G. Steiner and A. Korznikova, Mater. Sci. Forum, 2006, 503–504, 57–64 CrossRef CAS.
- G. D. Mukherjee, C. Bansal and A. Chatterjee, Phys. Rev. Lett., 1996, 76(11), 1876–1879 CrossRef CAS PubMed.
- O. L. Anderson, J. Phys. Chem. Solids, 1963, 24, 909–917 CrossRef CAS.
- O. Gunnarsson, M. Calandra and J. E. Han, Rev. Mod. Phys., 2003, 75(4), 1085–1099 CrossRef.
- I. Sergueev, K. Glazyrin, I. Kantor, M. A. McGuire, A. I. Chumakov, B. Klobes, B. C. Sales and R. P. Hermann, Phys. Rev. B: Condens. Matter, 2015, 91(22), 1–7 CrossRef.
Footnotes |
| † In Memoriam of Dr John F. “Jack” Smith. |
| ‡ Electronic supplementary information (ESI) available. See DOI: 10.1039/c6dt01298a |
| § Present address: Gesellschaft für Anlagen- und Reaktionssicherheit (GRS) gGmbH, Schwertnergasse 1, 50667 Köln, Germany. |
|
| This journal is © The Royal Society of Chemistry 2016 |
Click here to see how this site uses Cookies. View our privacy policy here.  Open Access Article
![[3 with combining macron]](https://www.rsc.org/images/entities/char_0033_0304.gif) ) with the general formula FxT4M12, where T is a transition metal of the VIIIth group located in position 8c (¼, ¼, ¼) and M is a pnictogen, chalcogen or an element of the IVth main-group in the Wyckoff site 24g (0, y, z). These atoms form a cage-like structure with a large icosahedral void at the 2a site (0, 0, 0), which may accommodate various filler atoms F, including alkaline and alkaline earth metals, lanthanoids, actinoids, as well as halogens or in particular cases Y, Hf,12,13 Pb and Sn.14–17 A ternary skutterudite in the system Ni–Sn–Sb was first reported by Grytsiv et al.18 who defined a wide homogeneity range at 250 °C and 350 °C by establishing the isothermal sections in the Sn–Sb–NiSb–Ni3Sn2 subsystem at these temperatures. Investigations by Mishra et al.19 in the Sn-rich part of the Ni–Sn–Sb phase diagram suggested that the phase equilibria determined by Grytsiv et al.18 lies within 10 °C above or below the declared temperatures.
) with the general formula FxT4M12, where T is a transition metal of the VIIIth group located in position 8c (¼, ¼, ¼) and M is a pnictogen, chalcogen or an element of the IVth main-group in the Wyckoff site 24g (0, y, z). These atoms form a cage-like structure with a large icosahedral void at the 2a site (0, 0, 0), which may accommodate various filler atoms F, including alkaline and alkaline earth metals, lanthanoids, actinoids, as well as halogens or in particular cases Y, Hf,12,13 Pb and Sn.14–17 A ternary skutterudite in the system Ni–Sn–Sb was first reported by Grytsiv et al.18 who defined a wide homogeneity range at 250 °C and 350 °C by establishing the isothermal sections in the Sn–Sb–NiSb–Ni3Sn2 subsystem at these temperatures. Investigations by Mishra et al.19 in the Sn-rich part of the Ni–Sn–Sb phase diagram suggested that the phase equilibria determined by Grytsiv et al.18 lies within 10 °C above or below the declared temperatures.
![[thin space (1/6-em)]](https://www.rsc.org/images/entities/char_2009.gif) 29 and CoSb3,30 and there are no data either on the influence of the filler on the melting points or on the thermal stability of ternary or multi-component skutterudites.
29 and CoSb3,30 and there are no data either on the influence of the filler on the melting points or on the thermal stability of ternary or multi-component skutterudites.


![[thin space (1/6-em)]](https://www.rsc.org/images/entities/char_2009.gif) c
c![[thin space (1/6-em)]](https://www.rsc.org/images/entities/char_2009.gif) c
c![[thin space (1/6-em)]](https://www.rsc.org/images/entities/char_2009.gif) c
c![[thin space (1/6-em)]](https://www.rsc.org/images/entities/char_2009.gif) c
c![[thin space (1/6-em)]](https://www.rsc.org/images/entities/char_2009.gif) b
b![[thin space (1/6-em)]](https://www.rsc.org/images/entities/char_2009.gif) c
c![[thin space (1/6-em)]](https://www.rsc.org/images/entities/char_2009.gif) c
c![[thin space (1/6-em)]](https://www.rsc.org/images/entities/char_2009.gif) a
a![[thin space (1/6-em)]](https://www.rsc.org/images/entities/char_2009.gif) c
c![[thin space (1/6-em)]](https://www.rsc.org/images/entities/char_2009.gif) c
c![[thin space (1/6-em)]](https://www.rsc.org/images/entities/char_2009.gif) c
c![[thin space (1/6-em)]](https://www.rsc.org/images/entities/char_2009.gif) c
c![[thin space (1/6-em)]](https://www.rsc.org/images/entities/char_2009.gif) c
c![[thin space (1/6-em)]](https://www.rsc.org/images/entities/char_2009.gif) c
c![[thin space (1/6-em)]](https://www.rsc.org/images/entities/char_2009.gif) a
a![[3 with combining macron]](https://www.rsc.org/images/entities/char_0033_0304.gif) ) with Ni atoms occupying the 8c site, whereas Sb and Sn atoms randomly share the 24g site. The residual density at the 2a site was assigned to Ba atoms. The compositions derived from the structural refinement, namely, Ba0.73Ni4Sb8.1Sn3.9 and Ba0.95Ni4Sb6.1Sn5.9, are in accordance with the microprobe measurements. Final refinements with fixed occupancies (Tables 5 and 6) and anisotropic atom displacement parameters (ADPs) led to a reliability factor RF below 2%. The maximum residual electron density of ∼3 e− Å−3 appears at a distance of 1.5 Å from the centre of the 24g site. This density can be interpreted as a “diffraction ripple” of the Fourier series around the heavy Sb and Sn atoms located at this site. The interatomic distances for Ni and (Sn/Sb) lie within range of values known for CoSb3
) with Ni atoms occupying the 8c site, whereas Sb and Sn atoms randomly share the 24g site. The residual density at the 2a site was assigned to Ba atoms. The compositions derived from the structural refinement, namely, Ba0.73Ni4Sb8.1Sn3.9 and Ba0.95Ni4Sb6.1Sn5.9, are in accordance with the microprobe measurements. Final refinements with fixed occupancies (Tables 5 and 6) and anisotropic atom displacement parameters (ADPs) led to a reliability factor RF below 2%. The maximum residual electron density of ∼3 e− Å−3 appears at a distance of 1.5 Å from the centre of the 24g site. This density can be interpreted as a “diffraction ripple” of the Fourier series around the heavy Sb and Sn atoms located at this site. The interatomic distances for Ni and (Sn/Sb) lie within range of values known for CoSb3![[thin space (1/6-em)]](https://www.rsc.org/images/entities/char_2009.gif) 15 and LaFe4Sb12.52
15 and LaFe4Sb12.52
![[3 with combining macron]](https://www.rsc.org/images/entities/char_0033_0304.gif) ; no. 204. ADP (Uij) are given in [10−2 nm2]
; no. 204. ADP (Uij) are given in [10−2 nm2]
![[3 with combining macron]](https://www.rsc.org/images/entities/char_0033_0304.gif)
![[3 with combining macron]](https://www.rsc.org/images/entities/char_0033_0304.gif)
![[3 with combining macron]](https://www.rsc.org/images/entities/char_0033_0304.gif)
![[thin space (1/6-em)]](https://www.rsc.org/images/entities/char_2009.gif) 114(3)
114(3)![[3 with combining macron]](https://www.rsc.org/images/entities/char_0033_0304.gif) no. 204. ADP (Uij) are given in [10−2 nm2]
no. 204. ADP (Uij) are given in [10−2 nm2]
![[3 with combining macron]](https://www.rsc.org/images/entities/char_0033_0304.gif)
![[3 with combining macron]](https://www.rsc.org/images/entities/char_0033_0304.gif)
![[3 with combining macron]](https://www.rsc.org/images/entities/char_0033_0304.gif)
![[thin space (1/6-em)]](https://www.rsc.org/images/entities/char_2009.gif) 241(2)
241(2)


 stands for a temperature independent electron–phonon interaction constant and A·T3 represents the Mott–Jones term.63 Least squares fitting according to eqn (7.2) was performed for Ni4Sb8.2Sn3.8, Ba0.42Ni4Sb8.2Sn3.8 and Ba0.92Ni4Sb6.7Sn5.3 extracting ρ0 and Egap, which are listed in Table 8. The Debye temperatures θD are listed in Table 7 and can be compared to data obtained using other methods (see below).
![[thin space (1/6-em)]](https://www.rsc.org/images/entities/char_2009.gif) a,b [meV]
a,b [meV]


 . In non-metallic systems, the lattice thermal conductivity is the dominant part of the thermal conduction mechanism, which can be described by a model introduced by Callaway.69–71 Accordingly, heat carrying lattice vibrations can be described by


 Fig. 25b, d and f compare the situation for temperatures above 300 K. For the two compounds, Ni4Sb8.2Sn3.8 and Ba0.42Ni4Sb8.2Sn3.8, κel is the dominant part of thermal conductivity, whereas κph is of the order of κmin. For Ba0.92Ni4Sb6.7Sn5.3, both the parts, κph as well as κel, are in the same order in magnitude but 2 to 3 times higher than those found for the previous samples. This may be caused by two effects: (i) substitution of Sb with Sn-atoms in the 24g site is combined with an increase in the thermal conductivity, or more likely, as reported in various articles,74,75 (ii) the vibrations of the filler atom are not independent from those of the network atoms.


![[small script l]](https://www.rsc.org/images/entities/i_char_e146.gif) el of the electrons can be calculated from the measured resistivity data,
el of the electrons can be calculated from the measured resistivity data,

![[small script l]](https://www.rsc.org/images/entities/i_char_e146.gif) el is five to ten times higher than the lattice parameter a. This confirms the quite low resistivity ρ(T) found in these alloys. It seems that Ba filling in the 2a site has a positive effect on
el is five to ten times higher than the lattice parameter a. This confirms the quite low resistivity ρ(T) found in these alloys. It seems that Ba filling in the 2a site has a positive effect on ![[small script l]](https://www.rsc.org/images/entities/i_char_e146.gif) el, whereas increasing the Sn content in site 24g decreases
el, whereas increasing the Sn content in site 24g decreases ![[small script l]](https://www.rsc.org/images/entities/i_char_e146.gif) el.
el.

![[small script l]](https://www.rsc.org/images/entities/i_char_e146.gif) el obtained for the skutterudites Ni4Sb8.2Sn3.8, Ba0.42Ni4Sb8.2Sn3.8 and Ba0.92Ni4Sb6.7Sn5.3.
el obtained for the skutterudites Ni4Sb8.2Sn3.8, Ba0.42Ni4Sb8.2Sn3.8 and Ba0.92Ni4Sb6.7Sn5.3.
![[small script l]](https://www.rsc.org/images/entities/i_char_e146.gif) ph between the scattering processes. The amount of transported heat is also proportional to the molar heat capacity Cv. For the group velocity vg, a common approximation takes the mean sound velocity vm. Taking our data from elastic properties measurements, Cv can then be calculated by
ph between the scattering processes. The amount of transported heat is also proportional to the molar heat capacity Cv. For the group velocity vg, a common approximation takes the mean sound velocity vm. Taking our data from elastic properties measurements, Cv can then be calculated by


![[small script l]](https://www.rsc.org/images/entities/i_char_e146.gif) ph for the skutterudites Ni4Sb8.2Sn3.8, Ba0.42Ni4Sb8.2Sn3.8 and Ba0.92Ni4Sb6.7Sn5.3.
ph for the skutterudites Ni4Sb8.2Sn3.8, Ba0.42Ni4Sb8.2Sn3.8 and Ba0.92Ni4Sb6.7Sn5.3.


