 Open Access Article
Creative Commons Attribution 3.0 Unported Licence
Ternary borides Nb7Fe3B8 and Ta7Fe3B8 with Kagome-type iron framework†
Qiang
Zheng‡
*a,
Roman
Gumeniuk
ab,
Horst
Borrmann
a,
Walter
Schnelle
a,
Alexander A.
Tsirlin
c,
Helge
Rosner
a,
Ulrich
Burkhardt
a,
Michael
Reissner
d,
Yuri
Grin
a and
Andreas
Leithe-Jasper
a
aMax-Planck-Institut für Chemische Physik fester Stoffe, Nöthnitzer Str. 40, 01187 Dresden, Germany. E-mail: zheng@cpfs.mpg.de; qiangzhengsic@gmail.com
bInstitut für Experimentelle Physik, TU Bergakademie Freiberg, Leipziger Str. 23, 09596 Freiberg, Germany
cExperimentalphysik VI, EKM, Institut für Physik, Universität Augsburg, D-86135 Augsburg, Germany
dInstitut für Festkörperphysik, TU Wien, Wiedner Hauptstr. 8-10, 1040 Wien, Austria
First published on 16th May 2016
Abstract
Two new ternary borides TM7Fe3B8 (TM = Nb, Ta) were synthesized by high-temperature thermal treatment of samples obtained by arc-melting. This new type of structure with space group P6/mmm, comprises TM slabs containing isolated planar hexagonal [B6] rings and iron centered TM columns in a Kagome type of arrangement. Chemical bonding analysis in Nb7Fe3B8 by means of the electron localizability approach reveals two-center interactions forming the Kagome net of Fe and embedded B, while weaker multicenter bonding present between this net and Nb atoms. Magnetic susceptibility measurements reveal antiferromagnetic order below TN = 240 K for Nb7Fe3B8 and TN = 265 K for Ta7Fe3B8. Small remnant magnetization below 0.01μB per f.u. is observed in the antiferromagnetic state. The bulk nature of the magnetic transistions was confirmed by the hyperfine splitting of the Mössbauer spectra, the sizable anomalies in the specific heat capacity, and the kinks in the resistivity curves. The high-field paramagnetic susceptibilities fitted by the Curie–Weiss law show effective paramagnetic moments μeff ≈ 3.1μB/Fe in both compounds. The temperature dependence of the electrical resistivity also reveals metallic character of both compounds. Density functional calculations corroborate the metallic behaviour of both compounds and demonstrate the formation of a sizable local magnetic moment on the Fe-sites. They indicate the presence of both antiferro- and ferrromagnetic interactions.
Introduction
Transition-metal borides are remarkable for their physical, chemical and mechanical properties, in particular, combining refractory behavior, high hardness, chemical inertness, and metallic conductivity.1–7 To exemplify a few well-known materials of high technological relevance, there are boride-containing metallic glasses,8 LaB6 cathodes for electron microscopes,9 and Nd2Fe14B-based permanent magnets.10 On the other hand, soft magnetic properties particularly found in ferrous amorphous boron-containing alloys have led to several highly useful applications, such as electro-magnetic materials.11,12 The structural complexity of electron-deficient boron and its compounds is caused by the intricate ways how their valence requirements are satisfied.13–15 Therefore, in metal-borides this not only gives rise to the formation of one-, two-, or three-dimensional arrangements of covalently bonded boron atoms,16–21 but also, due to complex structures, results in a multitude of physical interactions which can lead to superconductivity22–26 or magnetism.27–31In a crystal structure, these interactions are governed by the spatial arrangement and coordination of the constituents which carry a magnetic moment. Accordingly, in borides phases with exotic and complex magnetic ground states can be expected and merit explorative research. To this purpose, we investigated the ternary TM–Fe–B (TM = Nb, Ta) systems which have been studied since the 1960s. The hitherto known ternary compounds in these two systems are TMFeB, TM2FeB2, TM3Fe3B4 and TaFeB3.32–35 We attempted to synthesize TM3Fe3B4 but failed. Instead, the analysis of samples with nominal compositions TM3Fe3B4 revealed the appearance of new compounds TM7Fe3B8, which crystallize in a primitive hexagonal lattice. This new type of structure comprises TM slabs containing planar hexagonal boron rings and iron centered TM columns in a Kagome type of arrangement (see below).
The interest in the Kagome lattices of magnetic ions is triggered by their strongly frustrated nature. No ordered antiferromagnetic configuration can be stabilized in such a geometry, and an exotic spin-liquid ground state is formed instead.36,37 However, in order to suppress any ordering a two-dimensional isotropic next-neighbor coupling is the prerequisite. Systems with the Kagome-like arrangement of magnetic ions range from Cu2+ minerals38,39 to Ce-based intermetallic compounds,40 but only few of them reveal the anticipated spin-liquid state at low temperatures.41–43 Even subtle geometrical distortions or interactions beyond nearest neighbors are usually sufficient to alleviate the frustration and stabilize the magnetic order.44,45
The majority of the kagome-lattice compounds reported so far are magnetic insulators. Kagome lattices in itinerant systems are by far more exotic, and no magnetic metals with the ideal kagome geometry have been reported to date. In the following, we fill this gap by investigating the TM7Fe3B8 borides, where three-fold symmetry of the crystal structure ensures perfect frustration on individual triangles of the kagome lattice. However, these compounds are magnetically ordered with relatively high Néel temperatures. We suggest that strong interplane couplings arising from the geometrical proximity of the kagome planes may be instrumental in stabilizing the magnetically ordered state in these novel ternary Fe-containing borides.
Experimental section
Sample preparation
The following elements were used to prepare the samples: Ta and Nb foil (Chempur, 99.9 mass%), Fe foil (Alfa Aesar, 99.999 mass%) and crystalline B powder (Alfa Aesar, 99.999 mass%). The mixtures of the elements with compositions TM3Fe3B4 and TM7Fe3B8 were arc-melted several times to obtain homogeneous samples, and the mass losses during arc-melting were 1–3.3%. The obtained ingots were placed inside Al2O3 crucibles and then sealed in Ta tubes. The annealing was carried out at 1000 °C for 12 h and then 1500 °C for 48 h in a high-temperature furnace (HTM Reetz, LORA). Additionally, all above manipulations were performed inside argon-filled glove boxes (p(O2/H2O) ≤ 1 ppm). The resulting samples are stable in air for a long time.Powder and single-crystal X-ray diffraction
Powder X-ray diffraction (XRD) data were collected on a HUBER G670 imaging plate Guinier camera equipped with Co Kα1 radiation (λ = 1.78897 Å). Phase analysis and indexing were performed using the WinXPow program package.46 Lattice parameters were refined by least-squares fitting with LaB6 internal standard within the program package WinCSD.47TM7Fe3B8 single crystals were selected from the samples with the nominal compositions TM3Fe3B4. Single crystal diffraction data were collected on a R-Axis Rapid or Rigaku AFC7 diffractometer equipped with Mercury CCD detectors (Mo Kα radiation, λ = 0.71073 Å). Absorption correction was made using a multi-scan procedure. The crystal structures were solved by a direct phase determination method and refined by a full-matrix least-squares procedure within the program package WinCSD.47 Details on the single-crystal diffraction data collection and structural refinement are listed in Table 1.
| Composition | Nb7Fe3B8 | Ta7Fe3B8 |
|---|---|---|
| Crystal system | hexagonal | |
| Space group | P6/mmm (no. 191) | |
| Lattice parameters | ||
| a (Å) | 8.3346(2) | 8.2788(3) |
| c (Å) | 3.2941(1) | 3.2934(3) |
| V (Å3) | 198.17(2) | 195.48(3) |
| Formula unit/cell, Z | 1 | 1 |
| Calculated density (g cm−3) | 7.5777(6) | 12.916(2) |
| Crystal size (mm3) | 0.02 × 0.02 × 0.02 | 0.04 × 0.04 × 0.04 |
| Diffraction system | Rigaku R-Axis Rapid | Rigaku AFC7 |
| Radiation; λ (Å) | Mo Kα ; 0.71073 Å | |
| 2θmax (°) | 131.69 | 66.40 |
| Absorption coefficient (mm−1) | 14.751 | 108.146 |
| N(hkl)measured | 5932 | 1774 |
| N(hkl)unique | 719 | 179 |
| N(hkl)observed (Fhkl > 4σ(F)) | 614 | 174 |
| R int/Rσ | 0.050/0.023 | 0.045/0.016 |
| Refined parameters | 17 | 14 |
| R F /wRF2 | 0.047/0.053 | 0.017/0.017 |
| Extinction coefficient | 0.063(4) | 0.026(1) |
Metallography
Pieces with several millimeters size were cut from the annealed samples for metallographic investigations. They were embedded in conductive resin and then subjected to a multistep grinding and polishing process to achieve high-quality polished surfaces. The microstructures were investigated by optical microscopy (Axioplan2, Zeiss) as well as scanning electron microscopy (Philips XL 30 with a LaB6 cathode, FEI). The chemical compositions were analyzed by means of energy dispersive X-ray spectroscopy (EDXS, Philips XL 30) and wavelength dispersive X-ray spectroscopy (WDXS, Cameca SX 100, W cathode, S-UTW-Si-(Li) detector).The determination of the boron content by microprobe WDXS is challenging due to the general issue that the measured intensities are related to the mass concentrations, while boron is extremely light as compared to niobium, tantalum, and iron. Also, the very low energies of boron X-ray lines give rise to a strong influence of absorption effects. Therefore, completely detected intensities originating from the uppermost surface layer and its extending area are strongly influenced by the quality of the local area that is probed by the electron beam, and the energy and shape of the boron X-ray lines are influenced significantly by the local chemical environment and bonding situation of boron. For this reason, reference compounds should be materials, in which boron should have a similar chemical environment and bonding situation with the two analyzed compounds. Subsequently, single crystals of NbFeB, TaFeB in sizes of several millimeters were successfully grown in melt fluxes and satisfy requirement for WDXS reference materials. By applying ICP-MS technique, their analyzed compositions are Nb1.00(1)Fe1.02(1)B1.01(2) and Ta1.00(1)Fe1.03(1)B1.01(1), respectively, revealing both are stoichiometric.48 The intensities of Ta Lα, Fe Kα and B Kα lines were measured for the Ta-containing compound, while due to the overlapping of B Kα line with Nb Mγ line, the intensities of Nb Lα, Fe Kα and B Kα2 lines were measured for the Nb-containing compound.
The matrix correction model according to Pouchou and Pichoir49 was applied to calculate the chemical compositions. Different conditions have been applied for the measurement of the X-ray lines of the heavy elements and boron. For the Ta-containing compound, currents of 15 nA and 40 nA under an acceleration voltage of 20 kV were applied for the measurement of the intensities of Ta Lα and Fe Kα lines, respectively, with the dwelling time of 3 seconds for each position. The intensity of the boron Kα line was measured by the area intensity method, with larger current of 100 nA, acceleration voltage of 7 kV and dwelling time 3 seconds for each position. For the Nb compound, the intensities of Nb Lα and Fe Kα lines were measured by applying a current of 60 nA under an acceleration voltage of 15 kV with dwelling time 3 seconds for each position. The intensity of the B Kα2 line was measured by applying the same acceleration voltage and current used for the Ta compound, however, due to the much weaker intensity of the B Kα2 line, dwelling time for each position was 1136 seconds.
Transmission electron microscopy (TEM) observations
Electron diffraction and high-resolution TEM (HRTEM) observations were both performed using a field-emission electron microscope JEM 2100F (JEOL, Japan) operating at 200 kV. HRTEM image simulations were carried out with program STEM_CELL.50Physical properties
Magnetization at external magnetic fields μ0H ranging from 0.01 T to 7 T (temperature range 1.8 K–400 K) was measured in a SQUID magnetometer (MPMS XL-7, Quantum Design) on polycrystalline samples. The electrical resistance was recorded by a four contact method using low-frequency alternating current (ACT option, PPMS, Quantum Design) on small bar-shapes pieces in zero field and in a field μ0H = 9 T. Heat capacity was determined by a relaxation method (HC option, PPMS, Quantum Design) in fields μ0H of 0, 3, 6, and 9 T.Mössbauer spectroscopy
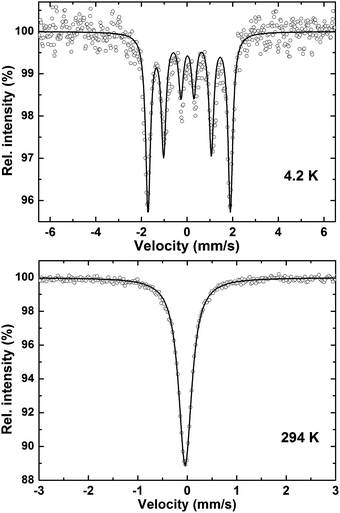
57Fe Mössbauer spectra were recorded at 294 K and 4.3 K. The measurements were performed with a standard constant acceleration spectrometer in transmission geometry in a continuous flow cryostat with the sample kept at helium atmosphere. The 57CoRh source was mounted on the driving system and kept at room temperature. All center shift (CS) data are given relative to this source. Calibration of the velocity scale was carried out with α-Fe foils. The spectra were analysed by solving the full Hamiltonian including electrostatic and magnetic hyperfine interactions. Sample thickness was taken into account by the method of Mørup and Both.51Electronic structure calculations
The electronic structure of TM7Fe3B8 was calculated within the framework of density functional theory (DFT) using the full-potential code FPLO.52 The local density approximation (LDA) to the exchange–correlation potential was chosen.53 Reciprocal space was sampled by a fine k-mesh with 630 points in the symmetry-irreducible part of the first Brillouin zone for the crystallographic unit cell of TM7Fe3B8 and 190 points for the supercell doubled along the c direction. Convergence with respect to the k-mesh was carefully checked. For the spin-polarized calculations, the highest crystallographic symmetry compatible with the magnetic ordering pattern was used in order to facilitate the convergence.Chemical bonding analysis
Analysis of chemical bonding was performed for Nb7Fe3B8 using the lattice parameters and atomic coordinates from the crystal structure refinement of single-crystal X-ray diffraction data (Tables 1 and 2). The TB-LMTO-ASA program package54 was employed using the Barth-Hedin exchange potential55 for the LDA calculations. The radial scalar-relativistic Dirac equation was solved to obtain the partial waves.56 Addition of empty spheres was not necessary because the calculation within the atomic sphere approximation (ASA) includes corrections for the neglect of interstitial regions and partial waves of higher order.57 The following radii of the atomic spheres were applied for the calculations r(Nb1) = 1.69 Å, r(Nb2) = 1.49 Å, r(Fe) = 1.48 Å, r(B1) = 1.02 Å, r(B2) = 1.19 Å. A basis set containing Nb(5s,5p,4d), Fe(4s,4p,3d) and B(2s,2p) orbitals was employed with Nb(4f) and B(3d) functions being downfolded.| Atom | Site | x | y | z |
B
iso/Beq![[thin space (1/6-em)]](https://www.rsc.org/images/entities/char_2009.gif) a a |
|---|---|---|---|---|---|
a ![[thin space (1/6-em)]](https://www.rsc.org/images/entities/char_2009.gif) Beq = 1/3[a*2a2B11 + b*2b2B22 + c*2c2B33 + 2aba*b*(cos Beq = 1/3[a*2a2B11 + b*2b2B22 + c*2c2B33 + 2aba*b*(cos![[thin space (1/6-em)]](https://www.rsc.org/images/entities/char_2009.gif) γ)B12 + 2aca*c*(cos γ)B12 + 2aca*c*(cos![[thin space (1/6-em)]](https://www.rsc.org/images/entities/char_2009.gif) β)B13 + 2bcb*c*(cos β)B13 + 2bcb*c*(cos![[thin space (1/6-em)]](https://www.rsc.org/images/entities/char_2009.gif) α)B23]. α)B23].
|
|||||
| Nb 7 Fe 3 B 8 | |||||
| Nb1 | 1a | 0 | 0 | 0 | 0.30(2) |
| Nb2 | 6l | 0.21202(3) | 2x | 0 | 0.313(8) |
| Fe | 3g | 1/2 | 0 | 1/2 | 0.41(2) |
| B1 | 2d | 1/3 | 2/3 | 1/2 | 0.5(1) |
| B2 | 6k | 0.2186(8) | 0 | 1/2 | 0.51(9) |
| Ta 7 Fe 3 B 8 | |||||
| Ta1 | 1a | 0 | 0 | 0 | 0.20(2) |
| Ta2 | 6l | 0.21233(3) | 2x | 0 | 0.27(2) |
| Fe | 3g | 1/2 | 0 | 1/2 | 0.34(5) |
| B1 | 2d | 1/3 | 2/3 | 1/2 | 0.3(1) |
| B2 | 6k | 0.221(1) | 0 | 1/2 | 0.4(1) |
The electron localizability indicator (ELI, ϒ) was evaluated in the ELI-D representation58–60 with an ELI-D module within the TB-LMTO-ASA program package. Topological analysis of the electron localizability indicator, e.g., localization of the ELI maxima as indicators of the direct atomic interactions, estimation of their basins were performed with the program DGrid.61
Results and discussion
Phase formation and crystal structure determination
Both as-cast samples with the nominal compositions TM3Fe3B4 and TM7Fe3B8 contain Fe2B, TMB and a little amount of other TM–B binary phases, however, with no traces of any other ternary phases. The TM7Fe3B8 compounds were firstly discovered as matrix phases in the samples with nominal composition TM3Fe3B4 annealed at 1500 °C for 48 h. Subsequently, bulk samples of TM7Fe3B8 with minor amounts of impurity phases were obtained by annealing at 1500 °C for 48 h. However, both compounds decomposed into TMB, Fe2B phases (and sometimes with α-Fe) at temperatures of about 1600 °C. The decomposition was proved by an endothermal peak in DSC curves at ≈1580 °C for the Nb7Fe3B8 sample.Powder XRD patterns of the sample TM7Fe3B8 annealed at 1500 °C are shown in Fig. 1. 26 strongest reflections in the Nb-containing sample were indexed successfully in a hexagonal primitive lattice with unit cell parameters a = 8.3346(2) Å, c = 3.2941(1) Å (Figure of merit (FOM) = 72.7) using the automatic indexing algorithm TREOR within WinXPow program package. In the same way, 23 strongest reflections in the Ta-containing sample were also successfully indexed in a hexagonal primitive unit cell with lattice parameters a = 8.2788(3) Å, c = 3.2934(3) Å (FOM = 78.2). No extinction conditions were observed in the two data sets. The remaining reflections belong to the TMB phases (∼1 vol% and ∼3 vol% in Nb7Fe3B8 and Ta7Fe3B8, respectively).
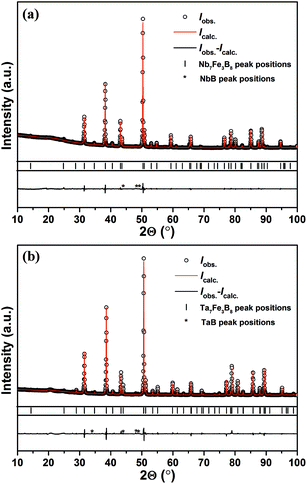 | ||
| Fig. 1 Powder XRD patterns of the samples with nominal composition (a) Nb7Fe3B8 and (b) Ta7Fe3B8 annealed at 1500 °C. | ||
The results of the single-crystal X-ray diffraction experiment are well consistent with the powder pattern indexing. Analysis of the reflection conditions revealed Laue class 6/mmm, and the most symmetric space group P6/mmm was chosen to solve the crystal structures. Since light B atoms give only a small contribution to the reflection intensities, reflexes were measured up to high angles (2θmax = 131.69°) for the Nb-containing single crystal in order to facilitate the determination of the positions of B atoms. The initial positions of Nb/Ta and Fe atoms were obtained by the direct phase determination method, while the positions of B atoms were found from difference Fourier maps. The refinement was carried out with anisotropic approximation for the atomic displacement parameters for all the atoms (except B atoms in Ta7Fe3B8 where refinement due to relatively large absorption is questionable). Occupations of the Ta, Nb and Fe positions were also refined, revealing that all are fully occupied. Crystallographic data and final atomic coordinates as well as isotropic displacement parameters are listed in Tables 1 and 2. Anisotropic displacement parameters are deposited in Table S1 in the ESI.† Compositions are in good agreement with WDXS results. By WDXS, the compositions for the two compounds were achieved as follows: Ta7.00(5)Fe3.13(3)B7.92(7) and Nb7.00(6)Fe3.10(3)B7.4(2). They are satisfactorily close to the compositions TM7Fe3B8 obtained from single crystal diffraction data, and the former one is nearly the same. The lower precision and accuracy of the obtained boron content for the Nb-containing compound results mainly from using the much weaker B Kα2 line. Moreover, WDXS compositions are consistent with the results by standardless EDXS analysis, which yield the Ta![[thin space (1/6-em)]](https://www.rsc.org/images/entities/char_2009.gif) :
:![[thin space (1/6-em)]](https://www.rsc.org/images/entities/char_2009.gif) Fe and Nb
Fe and Nb![[thin space (1/6-em)]](https://www.rsc.org/images/entities/char_2009.gif) :
:![[thin space (1/6-em)]](https://www.rsc.org/images/entities/char_2009.gif) Fe atomic ratios 70.6(8)
Fe atomic ratios 70.6(8)![[thin space (1/6-em)]](https://www.rsc.org/images/entities/char_2009.gif) :
:![[thin space (1/6-em)]](https://www.rsc.org/images/entities/char_2009.gif) 29.4(8) and 70(1)
29.4(8) and 70(1)![[thin space (1/6-em)]](https://www.rsc.org/images/entities/char_2009.gif) :
:![[thin space (1/6-em)]](https://www.rsc.org/images/entities/char_2009.gif) 30(1), respectively.
30(1), respectively.
TEM investigation
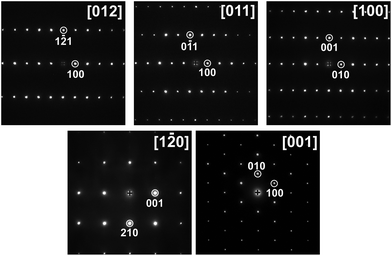
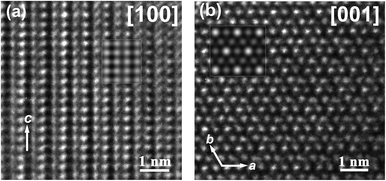
The TEM study of Ta7Fe3B8 confirmed the results of the crystal structure determined by the X-ray diffraction. The electron diffraction patterns along relevant zone axes are shown in Fig. 2. All five patterns can be well indexed in a hexagonal primitive lattice with the cell parameters obtained from powder XRD diffraction (Table 1). There are no superstructure reflections or diffuse reflections characteristic for disorder.The atomic arrangement in the TM7Fe3B8 structure determined from single crystal diffraction (as shown in Fig. 4a) is proved by HRTEM observations (Fig. 3). For the image along [100] (Fig. 3a), the simulated image (the inset in Fig. 3a) was calculated at defocus Δf = −40 nm and thickness t = 6.7 nm, in which the dark contrast mainly comes from the projection of Ta and Fe atoms. For the HRTEM image along [001] (Fig. 3b; the inset shows the simulated image at a defocus Δf = −20 nm and thickness t = 6.6 nm), the bright spots are caused by the projection of Ta1 and Fe atoms. HRTEM images also reveal no extended defects in Ta7Fe3B8.
Crystal structure
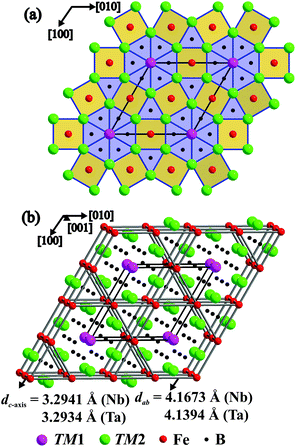
The crystal structures of TM7Fe3B8 adopt a new type of atomic arrangement. As shown in Fig. 4, the structures consist of two alternating layers: the layer of the TM atoms at z = 0 and the layer of the B and Fe atoms at z = 1/2. The B and Fe atoms reside inside [TM6] trigonal prisms and center [(TM2)8] tetragonal prisms, respectively. The trigonal prisms comprise two different types: one is represented by [(B2)(TM1)2(TM2)4], and the other one by [(B1)(TM2)6], respectively. Both represent typical structural building blocks observed in intermetallic borides. The former type of the polyhedra is corrugated and forms hexagonal columns along [001]. Such kind of hexagonal columns has been previously observed in the ternary borides TM7TM′6B8 (M = Nb, Ta; M′ = Ru, Rh, Ir)62 and their disordered variant Ti7Rh4Ir2B8.63 In TM7Fe3B8, the hexagonal columns are separated by Fe and B1 atoms. This gives rise to the formation of [Fe(TM2)8] tetragonal prisms and the second type of trigonal prisms. Such buildup of trigonal prims and tetragonal prims in TM7Fe3B8 structures is observed in borides for the first time. This type of structure pattern was previously found in the crystal structure of BaFe2Al9.64 Here the aluminum atoms are occupying the positions of TM2 and Fe, iron atoms are located at the B2 positions, barium is shifted by [00½] in respect to Nb1 site, and the positions of B2 are not occupied: Ba1Al6Al3Fe2□6 is equivalent to (TM1)1(TM2)6Fe3(B1)2(B2)6. Later another ordering variant for this atomic motif was discovered in Hf5Nb5Ni3P5: Hf1(Hf,Nb)6(Hf,Nb)3P2(Ni,P)6.65The structural motif of TM7Fe3B8 can be described as a 2D intergrowth of the AlB2-type (RX2 fragment) and CsCl-type (RR′ fragment) slabs with the general formula Rm+nR′mX2n66 where m = 3 and n = 4 are the numbers of outlined structural fragments per unit cell of TM7Fe3B8. In the AlB2-type TMB2 structures,67,68 condensed [BTM6] trigonal prisms form 3D blocks completely filling the space. Due to such an arrangement, the boron atoms come in close contact and form infinite two dimensional graphite-like nets. Interestingly, in the TM7Fe3B8 structure, the planar six-membered rings of boron are now separated by CsCl-type TMFe slabs, and this also additionally results in the isolated B1 atoms in this structure. Such kind of isolated planar [B6] rings and the isolated B atoms were also observed in the ternary borides TM7TM′6B862 and their disorder variant Ti7Rh4Ir2B8.63 Moreover, the TM7Fe3B8 structure is also related to the Mo2FeB2-type TM2FeB2 structure,33,34 which can also be described as an intergrowth of the AlB2-type and CsCl-type slabs, now with m = 2 and n = 2 in Rm+nR′mX2n. One nearly single-phase Ta2FeB2 sample was also synthesized during this study and its structure was refined from powder XRD data.69 In TM2FeB2, the boron atoms centering the trigonal prism sites come together in B2-pairs, while in TM7Fe3B8, these pairs are fused into [B6] rings or broken up into isolated B atoms.
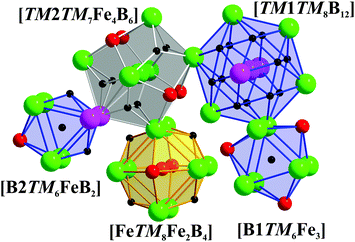
Coordination polyhedra of all the atoms in TM7Fe3B8 are depicted in Fig. 5. The polyhedron of TM1 is a 20-vertices polyhedron consisting of 12 B and 8 TM atoms, which could also be observed for TM atoms in TM7TM′6B8,62 TMB2,67,68 and TM3B4.70 TM2 and Fe are coordinated by a 17-vertices [TM7Fe4B6] polyhedron and a six-capped [TM8Fe2B4] cube, respectively. The same coordination polyhedra for TM as well as Fe are found in TM2FeB2.33,34 Finally, B atoms are coordinated by tricapped trigonal prisms formed either by 6 TM and 3 Fe atoms or by 6 TM, 1 Fe and 2 B atoms.
Selected interatomic distances in the crystal structures of TM7Fe3B8 compounds are listed in Table 3. All of them are close or slightly larger than the sum of atomic radii of the elements (rTa = 1.43 Å, rNb = 1.43 Å, rFe = 1.24 Å, rB = 0.83 Å).71 TM–TM contacts in the (001) plane for Nb7Fe3B8 (3.0333(6) Å and 3.0607(4) Å) and Ta7Fe3B8 (3.0053(6) Å and 3.0447(2) Å) are both shorter than these distances in the (001) plane in TM7Ru6B8 (3.1257 Å and 3.1189 Å for Nb7Ru6B8 and Ta7Ru6B8, respectively)62 and AlB2-type TMB2 (3.1115 Å and 3.076 Å for NbB267 and TaB2,68 respectively). TM–TM contacts along the [001] direction for Nb7Fe3B8 (3.2941(1) Å) and Ta7Fe3B8 (3.2934(3) Å) are both longer than these distances along [001] in TM7Ru6B8 (3.1284(3) Å and 3.1370(3) Å for Nb7Ru6B8 and Ta7Ru6B8, respectively)62 and TMB2 (3.2657 Å and 3.275 Å for NbB267 and TaB2,68 respectively). B2 atoms in the isolated hexagonal [B6] rings in TM7Fe3B8 reside slightly off-center in the trigonal prisms towards the Fe atom caps, resulting in longer B2–B2 distances in the hexagonal rings (1.822(5) Å and 1.830(6) Å for Nb7Fe3B8 and Ta7Fe3B8, respectively) than the distances in TMB2 (1.7962 Å and 1.7759 Å in NbB267 and TaB2,68 respectively), however, still shorter than the distances in the isolated hexagonal rings in TM7TM′6B8 (1.868(4) Å, 1.870(6) Å and 1.84(4)−1.87(7) Å in Nb7Ru6B8, Ta7Ru6B8 and Nb7Rh6B8).
| Atoms | Nb7Fe3B8 | Ta7Fe3B8 | CN | |
|---|---|---|---|---|
| TM1 | –12B2 | 2.456(3) | 2.462(3) | 20 |
| –6TM2 | 3.0607(4) | 3.0447(2) | ||
| –2TM1 | 3.2941(1) | 3.2934(3) | ||
| TM2 | –4B2 | 2.396(2) | 2.383(6) | 17 |
| –2B1 | 2.4041(3) | 2.3921(3) | ||
| –4Fe | 2.7120(2) | 2.6995(3) | ||
| –2TM2 | 3.0333(6) | 3.0053(6) | ||
| –1TM1 | 3.0607(4) | 3.0447(2) | ||
| –2TM2 | 3.0607(4) | 3.0447(2) | ||
| –2TM2 | 3.2941(1) | 3.2934(3) | ||
| Fe | –2B2 | 2.345(3) | 2.310(4) | 14 |
| –2B1 | 2.4060(1) | 2.3899(1) | ||
| –8TM2 | 2.7120(2) | 2.6995(3) | ||
| –2Fe | 3.2941(1) | 3.2934(3) | ||
| B1 | –6TM2 | 2.4041(3) | 2.3921(3) | 9 |
| –3Fe | 2.4060(1) | 2.3899(1) | ||
| B2 | –2B2 | 1.822(5) | 1.830(6) | 9 |
| –1Fe | 2.345(3) | 2.310(4) | ||
| –4TM2 | 2.396 (2) | 2.383(6) | ||
| –2TM1 | 2.456(3) | 2.462(3) |
The iron atoms in the crystal structure of TM7Fe3B8 form a planar Kagome net at z = 1/2. With the relatively large Fe–Fe distances within the Kagome plane (4.17 Å for Nb and 4.14 Å for Ta compound) and the shorter distances of d(Fe–Fe) = 3.29 Å along [001] in both compounds (Fig. 4b), this atomic pattern plays important role in the magnetic behavior of these materials (cf. below).
Physical properties
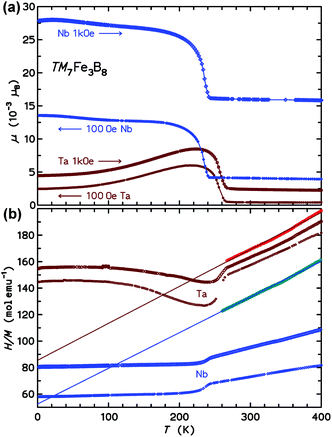
Above the ordering transitions, the high-field paramagnetic susceptibilities χ(T) = M(T)/H were analyzed. First, the intrinsic susceptibility χint(T) was extrapolated by the Honda-Owen method from data taken in 3.5 T and 7 T field. Above 250 K, the χint(T) data are well described by the Curie–Weiss law (see the plot of H/M in Fig. 6b), χint(T) = C/(T − θ). The effective paramagnetic moment μeff calculated from C and the Weiss parameter θ are 5.45μB and −195 K for the Nb compound and 5.35μB and −306 K for the Ta homologue.
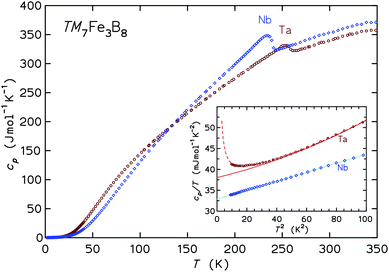
The inset to Fig. 8 presents the low-T specific heats in a cp/T vs. T2 representation. For temperatures below 10 K the cp(T) may be analyzed following the ansatz cp(T) = aT−2 + γT + βT3, where the first term captures the upturn towards the lowest temperatures (observed in the Ta compound only), γT is the contribution from conduction electrons, and βT3 represents the Debye approximation of the lattice heat capacity. The Sommerfeld coefficients γ are 32.9 and 38.0 mJ mol−1 K−1 for the Nb and Ta compound, respectively. The coefficients β correspond to initial Debye temperatures θD of 688 K and 640 K, respectively, the lower θD of the latter compound being due to the large atomic mass of tantalum. The origin of the upturn at the lowest T observed for Ta7Fe3B8 is unclear. The application of magnetic fields μ0H of 3, 6, and 9 T leads to a progressive shift of entropy connected to this upturn to higher temperatures, however the involved entropy is very small compared to NAkB. This contribution is probably not due to hyperfine splitting of the nuclear multiplet of 181Ta (I = 7/2), especially since no corresponding effect is observed for Nb (93Nb with I = 9/2).
| T (K) | H hf (mm s−1) | eQV zz/4 (mm s−1) | CS (mm s−1) | G/2 (mm s−1) |
|---|---|---|---|---|
| 294 | 0 | −0.020 | −0.033 | 0.158 |
| 4.3 | 3.611 | 0.038 | 0.058 | 0.126 |
Electronic structure
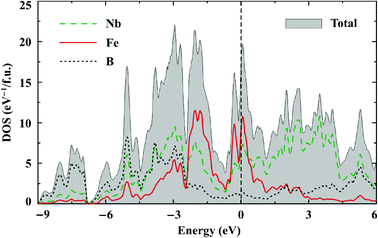
Both Nb7Fe3B8 and Ta7Fe3B8 are metallic. Their electronic density of states (DOS) features remarkably large contributions of d states of both Nb/Ta and Fe at the Fermi level (EF) (Fig. 10). According to the Stoner criterion band splitting and thus spontaneous ferromagnetic ordering are therefore very likely to occur. The Nb/Ta 4d/5d bands are very broad and span the energy range between −5 eV and 5 eV, where clear bonding (Nb and B) and antibonding (Nb only) combinations are formed below and above the Fermi level, respectively. The Fe 3d bands are about half as wide and weakly hybridize with the boron states. The electronic structures of the Nb and Ta compounds are very similar.The Fermi level is close to a local minimum of the DOS. The number of states at the Fermi level of about 16.5 eV per f.u. and 13.5 eV per f.u. in the spin-unpolarized calculation yields the Sommerfeld coefficients of γ = 38 mJ mol−1 K−1 and 32 mJ mol−1 K−1 for Nb7Fe3B8 and Ta7Fe3B8, respectively. These values are close to those found experimentally (32.9 and 38.0 mJ mol−1 K−1, respectively), but, surprisingly, reveal a different trend: γNb > γTa in DFT, whereas γNb < γTa experimentally. Spin fluctuations and magnetic order may affect the number of states at the Fermi level. However, this effect is difficult to assess computationally because the magnetic ground state of TM7Fe3B8 is not known.
Spin-polarized calculations suggest that both Nb7Fe3B8 and Ta7Fe3B8 are magnetic. The magnetic moment on iron is about 1.72μB regardless of the spin configuration. This value should not be confused with the paramagnetic effective moment of about 3.1μB/Fe, which is intrinsically higher than the ordered moment and reflects the full fluctuating spin moment, while 1.72μB revealed by DFT is only its ordered part. On the other hand, this moment is much higher than the tiny remnant magnetization on the order of 0.01μB, which is seen below TN.
In order to gain further insight into the nature of the magnetic order in TM7Fe3B8, we analyzed nearest-neighbor exchange couplings by calculating total energies of several spin configurations. The following ordering patterns were considered: ferromagnetic order (I); ferromagnetic order in the ab plane and antiferromagnetic order along c (II); ferrimagnetic (up-up-down) order in the ab plane and ferromagnetic order along c (III). Note that we considered collinear spin configurations only. Therefore, a fully antiferromagnetic order in the ab plane is not possible given the frustrated nature of the kagome spin lattice.
Our spin-polarized calculations revealed the lowest energy of configuration III that we further refer to as zero. The energies of the other two configurations are EI = +65.9 meV per f.u. and EII = +127.1 meV per f.u., respectively. This way, effective nearest-neighbor exchange couplings are Jab = 16.5 meV/Fe and Jc = −21.2 meV/Fe, where the positive and negative signs stand for the antiferromagnetic and ferromagnetic couplings, respectively, and we do not divide energies by S2 because in itinerant magnets it is not a good quantum number. We conclude that the couplings in the ab plane are antiferromagnetic, while the coupling along c is ferromagnetic. Therefore, despite large Fe–Fe distances (cf. above), TM7Fe3B8 are magnetically frustrated, as no collinear spin configuration satisfies the antiferromagnetic couplings in the Kagome net. It is worth noting that effective exchange couplings of +190 K and −247 K are comparable in magnitude to the Curie–Weiss temperature of −195 K in Nb7Fe3B8. However, both ferro- and antiferromagnetic interactions are observed.
Chemical bonding analysis in real space
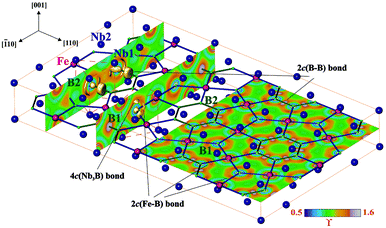
A striking feature of the TM7Fe3B8 crystal structure is the spatial separation of the TM atoms from the Fe and B ones forming separated planar nets perpendicular to the [001] direction at z = 0 and z = ½ respectively. The reasons for such atomic arrangement were evaluated by the real space analysis of chemical bonding in Nb7Fe3B8 employing electron localizability indicator ELI in its ELI-D representation59 (Fig. 11).While the ELI-D distribution in the penultimate shell of boron atoms has a spherical shape as expected for a p element, the penultimate shells of niobium and iron atoms show strong inhomogeneity being the fingerprint of the participation of these electrons in the bonding interactions in the valence region.60,72 In the valence region around B1 atoms reveal five ELI-D maxima (attractors). Three of them are located on the Fe–B contacts visualizing the 2c(Fe–B) bonds. The basins of the remaining two attractors are located above and below the boron nucleus being in contact with the core basins of three Nb atoms beside ones of B1. This arrangement reflects the four-center interaction. ELI-D reveals similar distribution around B2. According to the local symmetry, two of the attractors in the plane at z = ½ visualize the 2c(B–B) bonds, the third one shows mainly 2c(Fe–B) interaction. The basins of the attractors above and below the plane are not present, being united with that of the Fe–B interaction indicating here a delocalization of a 2c bond toward a multicenter one. Thus, the plane of Fe and B atoms at z = ½ with its Kagome topology mentioned above is formed mainly by two-center interactions. Between this plane and the niobium atoms at z = 0 the multicenter bonding is observed. Assuming that the multicenter bonding is weaker than the two-center interactions, such bonding picture should yield a pronounced cleavage of the material perpendicular to the [001] direction.
Conclusions
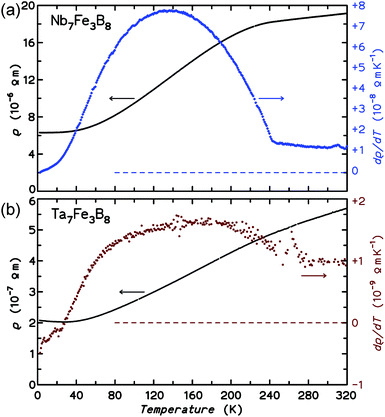
In this study, two new ternary borides TM7Fe3B8 (TM = Nb, Ta) with Kagome-type iron sublattices were synthesized by arc-melting of the elements and subsequent annealing at 1500 °C. Their hexagonal primitive structure is an intergrowth of AlB2-type and CsCl-type slabs, involving [BTM6] trigonal prisms and [FeTM8] tetragonal prisms. The condensation of trigonal prisms results in the formation of hexagonal columns along c-axis, hence, also forming isolated planar [B6] rings in this structure.Metallic character of TM7Fe3B8 is confirmed by temperature dependence of the electrical resistivity as well as by the sizable linear term in the specific heat for both compounds.
Magnetic susceptibility measurements reveal predominantly antiferromagnetic order below TN = 240 K for Nb7Fe3B8 and TN = 265 K for Ta7Fe3B8. The sextet in the Mössbauer spectra of Nb7Fe3B8, the sizable anomalies in the specific heat at TN, and the kinks in the resistivity curves confirm the bulk character of the magnetic transitions for both compounds. These transitions are related to the presence of sizable magnetic moments localized on the Fe atoms within the planar Kagome-type iron sublattice. DFT calculations indicate metallic behaviour for both compounds and show that interactions in the ab plane are antiferromagnetic and thus subject to a strong geometrical frustration that should prevent Néel type magnetic ordering. On the other hand, strong interplane coupling (of any sign) can effectively suppress this frustration and trigger the formation of long-range-ordered states,73 which is probably the case in TM7Fe3B8. However, the presence of remnant magnetization unanticipated in a regular Kagome antiferromagnet indicates a more complex nature of the magnetic order.
Quantum-chemical analysis of the chemical bonding in Nb7Fe3B8 within the electron localizability approach reveals five ELI-D maxima around B1, visualizing three in-layer Fe–B bonds and two interactions with core basins of three Nb atoms above and below, while only three maxima around B1, showing two B–B bonds and one Fe–B interaction. The analysis also indicates that the Kagome net of Fe and B is mainly formed by two-center interactions, whereas multicenter bonding between this net and Nb atoms is observed.
Acknowledgements
We thank Mr S. Hückmann and Dr Yu. Prots for performing powder X-ray diffraction measurements, Ms P. Scheppan, Ms M. Eckert and Ms S. Kostmann for metallographic analysis, and Mr R. Koban for physical property measurements. We are grateful to Dr G. Auffermann and Ms. U. Schmidt for ICP-MS analysis of the samples. We thank Dr K. Hradil for preliminary low temperature powder XRD measurements at the X-ray center of the TU Wien. AT was supported by the Federal Ministry for Education and Research through the Sofja Kovalevskaya award of Alexander von Humboldt Foundation.References
- V. I. Matkovich, Boron and Refractory Borides, Springer, New York, 1977 Search PubMed.
- K. Upadhya, J. M. Yang and W. P. Hoffman, Am. Ceram. Soc. Bull., 1997, 76, 51–56 CAS.
- J. B. Levine, S. H. Tolbert and R. B. Kaner, Adv. Funct. Mater., 2009, 19, 3519–3533 CrossRef CAS.
- R. G. Munro, J. Res. Natl. Inst. Stand. Technol., 2000, 105, 709–720 CrossRef CAS.
- P. Schwarzkopf, R. Kieffer, W. Leszynski and K. Benesovsky, Refractory Hard Metals, Borides, Carbides, Nitrides, and Silicides, Macmillan, New York, 1953 Search PubMed.
- C. Buzea and T. Yamashita, Supercond. Sci. Technol., 2001, 14, R115–R146 CrossRef CAS.
- W. G. Fahrenholtz, G. E. Hilmas, I. G. Talmy and J. A. Zaykoski, J. Am. Ceram. Soc., 2007, 90, 1347–1364 CrossRef CAS.
- A. Inoue, Acta Mater., 2000, 48, 279–306 CrossRef CAS.
- J. M. Lafferty, J. Appl. Phys., 1951, 22, 299–309 CrossRef CAS.
- J. F. Herbst, Rev. Mod. Phys., 1991, 63, 819–898 CrossRef CAS.
- K. Moorjani and J. M. D. Coey, Magnetic Glasses, Elsevier, Amsterdam, 1984 Search PubMed.
- C. H. Smith, in Rapidly solidified alloys, ed. H. H. Liebermann, Marcel Dekker, New York, 1993 Search PubMed.
- L. Pauling, The Nature of the Chemical Bond and the Structure of Molecules and Crystals: An Introduction to Modern Structural Chemistry, Cornell University Press, Ithaca, 3rd edn, 1960 Search PubMed.
- B. Albert and H. Hillebrecht, Angew. Chem., Int. Ed., 2009, 48, 8640–8668 CrossRef CAS PubMed.
- T. Mori, in Handbook on the Physics and Chemistry of Rare Earths, ed. K. A. Gschneidner, J.-C. Bünzli and V. Pecharsky, North-Holland, Amsterdam, 2008, vol. 38, pp. 105–173 Search PubMed.
- P. Rogl and H. Nowotny, J. Less-Common Met., 1978, 61, 39–45 CrossRef CAS.
- H. Nowotny and P. Rogl, in Boron and Refractory Borides, ed. V. Matkovich, Springer, New York, 1977, ch. 23, pp. 413–438 Search PubMed.
- Yu. B. Kuz'ma, Crystallochemistry of Borides, Lviv University Publishers, Lviv, 1983 Search PubMed.
- P. Rogl, in Inorganic Reactions and Methods, ed. A. P. Hagen, Wiley, 1991 Search PubMed.
- Q. Zheng, F. R. Wagner, A. Ormeci, Yu. Prots, U. Burkhardt, M. Schmidt, W. Schnelle, Yu. Grin and A. Leithe-Jasper, Chem. – Eur. J., 2015, 21, 16532–16540 CrossRef CAS PubMed.
- M. Ade and H. Hillebrecht, Inorg. Chem., 2015, 54, 6122–6135 CrossRef CAS PubMed.
- J. M. Vandenberg, B. T. Matthias, E. Corenzwit and H. Barz, Mater. Res. Bull., 1975, 10, 889–894 CrossRef CAS.
- H. C. Ku, G. P. Meisner, F. Acker and D. C. Johnston, Solid State Commun., 1980, 35, 91–96 CrossRef CAS.
- B. T. Matthias, E. Corenzwit, J. M. Vandenberg and H. E. Barz, Proc. Natl. Acad. Sci. U. S. A., 1977, 74, 1334–1335 CrossRef CAS.
- Q. Zheng, R. Gumeniuk, H. Rosner, W. Schnelle, Yu. Prots, U. Burkhardt, Yu. Grin and A. Leithe-Jasper, J. Phys.: Condens. Matter, 2015, 27, 415701 CrossRef PubMed.
- Q. Zheng, W. Schnelle, Yu. Prots, M. Bobnar, U. Burkhardt, A. Leithe-Jasper and R. Gumeniuk, Dalton Trans., 2016, 45, 3943–3948 RSC.
- D. Gignoux and D. Schmitt, in Handbook of Magnetic Materials, ed. K. H. J. Buschow, North-Holland, Amsterdam, 1997, vol. 10, p. 239 Search PubMed.
- R. Dronskowski, K. Korczak, H. Lueken and W. Jung, Angew. Chem., Int. Ed., 2002, 41, 2528–2532 CrossRef CAS.
- O. Isnard and D. Fruchart, J. Alloys Compd., 1994, 205, 1–15 CrossRef CAS.
- B. P. T. Fokwa, Eur. J. Inorg. Chem., 2010, 2010, 3075–3092 CrossRef.
- M. Mbarki, R. St. Touzani and B. P. T. Fokwa, Angew. Chem., Int. Ed., 2014, 53, 13174–13177 CrossRef CAS PubMed.
- Yu. B. Kuz'ma, Dopov. Akad. Nauk URSR, Ser. A, 1967, 16, 939–940 Search PubMed.
- Yu. B. Kuz'ma, T. I. Ts'olkovskii and O. P. Baburova, Inorg. Mater. (Engl. Trans.), 1968, 4, 950–953 Search PubMed.
- Yu. B. Kuz'ma, A. S. Sobolev and T. F. Fedorov, Sov. Powder Metall. Met. Ceram., 1971, 10, 410–414 CrossRef.
- P. Rogl, in Iron Systems: Phase Diagrams, Crystallographic and Thermodynamic Data, ed. G. Effenberg and S. Ilyenko, Springer, 2008, vol. 11D1 Search PubMed.
- L. Balents, Nature, 2010, 464, 199–208 CrossRef CAS PubMed.
- S. Yan, D. A. Huse and S. R. White, Science, 2011, 332, 1173–1176 CrossRef CAS PubMed.
- O. Janson, J. Richter and H. Rosner, Phys. Rev. Lett., 2008, 101, 106403 CrossRef CAS PubMed.
- M. P. Shores, E. A. Nytko, B. M. Bartlett and D. G. Nocera, J. Am. Chem. Soc., 2005, 127, 13462–13463 CrossRef CAS PubMed.
- A. Dönni, G. Ehlers, H. Maletta, P. Fischer, H. Kitazawa and M. Zolliker, J. Phys.: Condens. Matter, 1996, 8, 11213–11229 CrossRef.
- P. Mendels and F. Bert, J. Phys. Soc. Jpn., 2010, 79 Search PubMed.
- T.-H. Han, J. S. Helton, S. Chu, D. G. Nocera, J. A. Rodriguez-Rivera, C. Broholm and Y. S. Lee, Nature, 2012, 492, 406–410 CrossRef CAS PubMed.
- M. Fu, T. Imai, T.-H. Han and Y. S. Lee, Science, 2015, 350, 655–658 CrossRef CAS PubMed.
- H. Ishikawa, Y. Okamoto and Z. Hiroi, J. Phys. Soc. Jpn., 2013, 82, 063710 CrossRef.
- I. Rousochatzakis, J. Richter, R. Zinke and A. A. Tsirlin, Phys. Rev. B: Condens. Matter, 2015, 91, 024416 CrossRef.
- WinXPow, STOE and Cie GmbH, Darmstadt, 2003 Search PubMed.
- L. Akselrud and Yu. Grin, J. Appl. Crystallogr., 2014, 47, 803–805 CrossRef CAS.
- More information about NbFeB and TaFeB single crystals are given in ESI.† The metallography analysis, crystal structure and magnetic data for NbFeB and TaFeB single crystals are shown in Fig. S1 to Fig. S3,† respectively. Refined crystallographic data from powder XRD patterns of NbFeB and TaFeB crytals are given in Tables S2 and S3.†.
- J. L. Pouchou and F. Pichoir, in Electron Probe Quantitation, ed. K. F. J. Heinrich and D. E. Newbury, Plenum Press, New York, 1991, ch. 31–70 Search PubMed.
- V. Grillo, STEM-Cell program Search PubMed.
- S. Mørup and E. Both, in Nuclear Instruments and Methods, Elsevier, Amsterdam, 1975, pp. 445–448 Search PubMed.
- K. Koepernik and H. Eschrig, Phys. Rev. B: Condens. Matter, 1999, 59, 1743–1757 CrossRef CAS.
- J. P. Perdew and Y. Wang, Phys. Rev. B: Condens. Matter, 1992, 45, 13244–13249 CrossRef.
- O. Jepsen, A. Burkhardt and O. K. Andersen, The Program TB-LMTO-ASA, version 4.7, Max-Planck-Institut für Festkörperforschung, Stuttgart, 1999 Search PubMed.
- U. von Barth and L. J. Hedin, J. Phys. C: Solid State Phys., 1972, 5, 1629–1641 CrossRef CAS.
- O. K. Andersen, Phys. Rev. B: Solid State, 1975, 12, 3060–3083 CrossRef CAS.
- W. R. L. Lambrecht and O. K. Andersen, Phys. Rev. B: Condens. Matter, 1986, 34, 2439–2449 CrossRef CAS.
- M. Kohout, Int. J. Quantum Chem., 2004, 97, 651–658 CrossRef CAS.
- M. Kohout, Faraday Discuss., 2007, 135, 43–54 RSC.
- F. R. Wagner, V. Bezugly, M. Kohout and Y. Grin, Chem. – Eur. J., 2007, 13, 5724–5741 CrossRef CAS PubMed.
- M. Kohout, DGrid, version4.6, 2011.
- Q. Zheng, M. Kohout, R. Gumeniuk, N. Abramchuk, H. Borrmann, Yu. Prots, U. Burkhardt, W. Schnelle, L. Akselrud, H. Gu, A. Leithe-Jasper and Yu. Grin, Inorg. Chem., 2012, 51, 7472–7483 CrossRef CAS PubMed.
- B. P. T. Fokwa and M. Hermus, Angew. Chem., Int. Ed., 2012, 51, 1702–1705 CrossRef CAS PubMed.
- K. Turban and H. Schäfer, J. Less-Common Met., 1975, 40, 91–96 CrossRef CAS.
- H. Kleinke and H. F. Franzen, J. Am. Chem. Soc., 1997, 119, 12824–12830 CrossRef CAS.
- E. I. Gladyshevsky and Yu. Grin, Sov. Phys. Crystallogr., 1981, 26, 683–689 Search PubMed.
- S. Okada, K. Hamano, T. Lundström and I. Higashi, AIP Conf. Proc., 1991, 231, 456–459 CrossRef CAS.
- S. Okada, K. Kudou, I. Higashi and T. Lundström, J. Cryst. Growth, 1993, 128, 1120–1124 CrossRef CAS.
- a = 5.8619(2) Å, c = 3.2762(2) Å; Ta at (4 h) (0.1797, x + 1/2, 1/2), Fe at (2a) (0, 0, 0), and B at (4f) (0.3880, x + 1/2, 0).
- R. Kiessling, Acta Chem. Scand., 1949, 3, 603–615 CrossRef CAS.
- J. Emsley, The Elements, Clarendon Press, Oxford, 1998 Search PubMed.
- M. Kohout, R. F. Wagner and Yu. Grin, Theor. Chem. Acc., 2002, 108, 150–156 CrossRef CAS.
- O. Götze and J. Richter 2015, arXiv:1510.04898.
Footnotes |
| † Electronic supplementary information (ESI) available. CCDC 1470521 and 1470522. For ESI and crystallographic data in CIF or other electronic format see DOI: 10.1039/c6dt01164k |
| ‡ Present address: Materials Science & Technology Division, and the Center for Nanophase Materials Sciences (CNMS), Oak Ridge National Laboratory, Oak Ridge, TN 37831, USA. |
| This journal is © The Royal Society of Chemistry 2016 |

