 Open Access Article
High-pressure synthesis of L10 MnAl with near-stoichiometric composition
Y.
Kinemuchi
*,
A.
Fujita
and
K.
Ozaki
National Institute of Advanced Industrial and Science and Technology (AIST), Nagoya 463-8560, Japan. E-mail: y.kinemuchi@aist.go.jp
First published on 2nd June 2016
Abstract
L10 MnAl, which is a nonequilibrium ferromagnetic phase, is fabricated successfully with various compositions via high-pressure synthesis. The L10 phase is observed at pressures higher than 5 GPa, indicating that the volume effect is crucial for the stabilization of this phase. The employed synthesis route does not require a Mn-rich ε-phase, which has conventionally been used as the precursor compound. This allows for the synthesis of the L10 phase with a near-stoichiometric composition. In addition to variations in the composition in terms of the Mn/Al ratio, the axial ratio (c/a) as well as the ordering parameter (S) are modified systematically, with the maximum c/a and S values corresponding to the stoichiometric composition. With this structural change, the highest coercive force is also observed at the stoichiometric composition.
Introduction
Magnetic materials with high saturation magnetization (Ms) as well as large magnetic anisotropic energy (MAE) are important materials in modern society and find wide use in automotive vehicles, wind generators, and storage devices. A high Ms value can be achieved by employing the Slater–Pauling concept,1 which involves the use of 3d elements such as Fe, Co, or Mn; however, attaining a large MAE value remains a challenge. L10-ordered binary alloys are known to have higher MAE values compared to those of disordered compounds. Among these alloys, L10 FePt shows a MAE value as high as 5 MJ m−3,2,3 which is comparable to those of advanced rare-earth magnets. Basically, heavy elements such as Pt increase the MAE, owing to the enhancement in the degree of spin–orbit coupling. However, the scarcity of these elements often limits their use in practice. Thus, discovering magnetic materials composed of abundant elements is of significant technological importance. MAE values of the order of 1–2 MJ m−3 have been reported for the compounds FeNi,4 CoNi,5 MnAl,6 and MnGa,7 of which MnAl is regarded as being more cost-effective and comparable or superior to hard ferrites and alnicos.8L10 MnAl can be considered as having a body-centered tetragonal structure and has been synthesized by using the ε-phase (hcp) as the mother phase. The ε-phase is a Mn-rich (typical composition of Mn0.55Al0.45) high-temperature phase that is stable at temperatures greater than 873 °C. The quenching of the ε-phase and its subsequent annealing (typically at approximately 500 °C) results in the formation of the L10 phase.9 L10 MnAl is known to decompose into nonmagnetic phases and is thus regarded as a metastable phase. In addition, synthesized MnAl compounds have a non-stoichiometric composition that deviates from the ideal one (Mn1Al1), depending on the synthesis route used. The excess Mn must occupy an antisite (Al site), which leads to antiferromagnetic (AFM) coupling with the Mn site and thus a decrease in the Ms value.
Historically, L10 MnAl has been considered a product formed by the displacive or martensitic transformation of the ε-phase.10 However, a detailed analysis performed using high-resolution transmission electron microscopy revealed that the growth front of the L10 phase is compositionally invariant with regard to the ε-phase that can be regarded as the mother phase. Furthermore, although the L10 phase nucleates heterogeneously at the previously existing ε-phase grain boundary, it forms incoherent interfaces.11 Hence, the proposed displacive or martensitic transformation must be discarded as the underlying mechanism. In other words, the formation of the ε-phase is not a necessary condition for the formation of the L10 phase.
The intrinsic properties of the L10 phase have been examined extensively using density functional theory (DFT). According to previous DFT studies, the Ms value of the L10 phase is 2.4μB per u.c., while its MAE value is 1.5–1.8 MJ m−3.12–14 It has also been predicted that extending the axial ratio (c/a) increases the MAE value.13 On the experimental side, however, pure MnAl has not yet been synthesized, owing to issues related to the synthesis method used, as mentioned earlier. Thus, the Ms value is lower than the theoretical value (1.9μB per u.c.).9 Therefore, there is a need to develop an alternative synthesis route that does not require the ε-phase.
It is interesting to note that the L10 MnAl phase possesses the smallest unit cell among all the phases near the stoichiometric composition in this system. Hence, the volume effect is thought to stabilize the L10 phase. In the present work, the high-pressure synthesis (HPS) of L10 MnAl was performed as an alternative synthesis route. Furthermore, the effects of the composition on the L10 structure as well as the resultant magnetic properties are discussed.
Experimental
The source materials, Mn (3Nup, 300 μm passed powder, Kojundo Chemical Laboratory Co., Ltd Japan) and Al (2Nup, 300 μm passed powder, Kojundo Chemical Laboratory Co., Ltd Japan), were homogeneously mixed using a planetary mixing apparatus, and the mixture was subsequently pelletized in a cylindrical form. Next, these pellets were placed in an Al2O3 crucible and melted in a furnace filled with a mixture of 5% H2/Ar at 1300 °C for 10 min. After being melted, the samples were crushed into a course powder using a vibration milling apparatus made of tungsten carbide. The powder obtained was used as the source material for the HPS process. We confirmed that the source materials were alloyed homogeneously and resulted in compounds corresponding to the phase diagrams:15 those corresponding to the formation of γ2 (R3m) and/or β-Mn (P4132) phases, depending on the composition.The HPS process was performed using a cubic anvil setup. The source materials were pelletized into cylinders with a diameter of 4.3 mm and a length of 6.2 mm. These small pellets were placed in a gold capsule, in order to prevent them from being contaminated during the synthesis process. Pyrophyllite was used as the pressure medium. Prior to the start of the experiments, the pressure acting on the sample was calibrated based on the phase transitions of Bi and Ba. The temperature was raised once the pressure had reached the desired level. It was then held at that level for 1 h and subsequently reduced while the pressure was maintained. Finally, the pressure was released once the temperature had dropped to room temperature. Typical samples after the HPS had dimensions of 4 mm in diameter and 4 mm in length.
The sample composition was analyzed using an energy-dispersive X-ray fluorescence spectrometer (EDX-8000, Shimadzu, Japan, for the average composition; and Quantax 70, Bruker AXS Japan, for the microanalysis). The X-ray powder diffraction pattern was obtained using parallel beam optics (RINT 2000, Rigaku, Japan). The pattern was then investigated using Rietveld analysis (Rietan 2000).16 The fraction of the product phases was estimated from the scale factors optimized in the Rietveld analysis. The ordering parameter (S) of the L10 phase was deduced from the relative intensity of the superlattice (h + k + l = odd) and fundamental (h + k + l = even):
The magnetic properties at room temperature were measured using a physical property measurement system (PPMS, Quantum Design Co.) equipped with a vibrating sample magnetometer.
Results and discussion
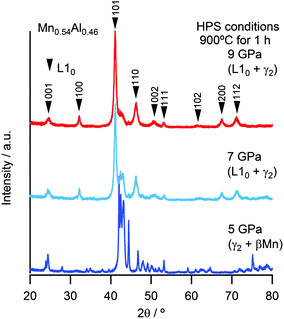
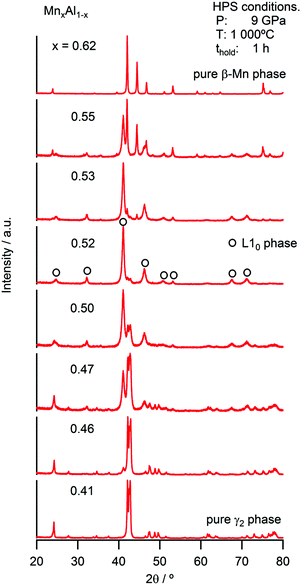
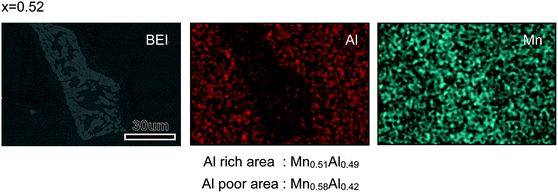
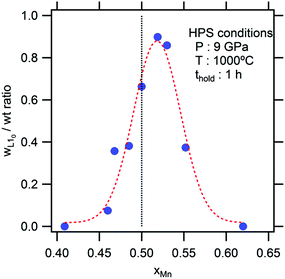
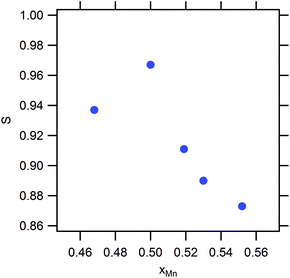
During conventional synthesis, the L10 phase emerges during annealing at approximately 500 °C. However, the effects of pressure at this temperature are not observed. Hence, the HPS process was performed at a higher temperature such as 900 °C. This increase in the HPS process temperature had a dramatic impact on L10 formation, as shown in Fig. 1. At pressures lower than 5 GPa, the γ2- and β-phases, that is, the phases that are stable under atmospheric conditions, still existed. On further increasing the pressure, a transformation to the L10 phase was observed clearly, and so was a gradual increase in the phase fraction. However, we did not succeed in eliminating the secondary phase even after applying the maximum pressure that the apparatus used allowed (9 GPa). Nevertheless, it is clear that the pressure effect, that is, a reduction in the volume, is the key to stabilizing the L10 phase. This newly discovered synthesis route contradicts conventional wisdom in that the ferromagnetic (FM) phase preferentially exhibits an increase in volume. When the distance between magnetic atoms is small, it tends to result in AFM coupling.17 Thus, the HPS process has not been used for the synthesis of ferromagnetic phases. Hence, it was interesting to determine the Mn–Mn distances in this system. At the nominal stoichiometric composition of MnAl, L10 competes with the γ2-phase, which has a Cr5Al8-type structure (space group of R3m) composed of several icosahedra. The smallest Mn–Mn distance in the γ2-phase is 2.59 Å, which is much shorter than that of L10 (2.75 Å). As expected on the basis of this distance, the γ2-phase is an AFM compound. On the other hand, the γ2-phase exhibits a longer length for the Al–Al bond. With respect to the Al–Mn bonds, even though their length exhibits a wide distribution, they are basically comparable to or longer than those in the L10 phase. The fact that the Al atoms are dispersed with respect to the Mn atoms as well as with respect to the other Al atoms leads to the density of the γ2-phase being lower than that of the L10 phase. In other words, the pressure compresses the dispersed Al atoms. Meanwhile, the Mn–Al distance also reduces and eventually the approached Al starts to interfere with the Mn–Mn bonds, resulting in the emergence of an FM phase owing to the increase in the Mn–Mn bond length. Although this simple explanation does not account for the mechanism of ordering, it may open a new perspective for finding FM phases.Fig. 2 shows the strong effect of compositional variation on the constituent phases. With the increase in the Mn content, the L10 phase becomes stable instead of the γ2-phase, with the β-phases eventually becoming stable. In addition, Mn composition denoted as x corresponds to that of the sample: the averaged Mn content among the product phases. Fig. 3 shows the images of compositional mapping of a Mn0.52Al0.48 sample. The Mn rich phase exists as a secondary phase. On the other hand, the composition of the L10 phase was found to be similar to the average composition within the analytical variation of EDS. A similar trend was found for the other samples: the composition of L10 was the same as the average composition. The highest fraction of L10, which was approximately 90%, was found when the composition was slightly rich in Mn (0.52 at%); this concentration of Mn is still lower than that corresponding to the conventional synthesis route based on the ε-phase (approximately 0.54 at%) (see Fig. 4). In terms of the chemical ordering, the ordering parameter (S) as well as site occupancy at 1a and 1d sites were deduced (Fig. 5 and Table 1). As demonstrated in both analyses, chemical ordering was rationally dependent on the composition—the stoichiometric composition is crucial for the high degree of ordering.
| x | 1a (0 0 0) | 1d (1/2 1/2 1/2) | ||
|---|---|---|---|---|
| Mn | Al | Mn | Al | |
| 0.47 | 0.932 | 0.068 | 0.008 | 0.992 |
| 0.50 | 0.993 | 0.007 | 0.007 | 0.993 |
| 0.52 | 0.995 | 0.005 | 0.045 | 0.955 |
| 0.53 | 0.994 | 0.006 | 0.066 | 0.934 |
| 0.55 | 0.986 | 0.014 | 0.114 | 0.886 |
The lattice parameters of the L10 phases are listed in Fig. 6. Although the cell volume was almost constant for all the compositions, the axial length, c, was the maximum at the stoichiometric composition, while the a-axis was the minimum. As a result, the axial ratio, c/a, was the highest value at this composition. This trend is conventionally thought to originate due to the decrease in the extent of Mn occupancy at the antisites in the case of the Mn-rich compositions, resulting in an increase in the c-axis length owing to the reduction in AFM coupling. On the other hand, the c/a value also decreased when the amount of Al was excessive. In an early DFT study, Sakuma pointed out that the tetragonal distortion resulting from the transformation of the cubic B2 structure into the L10 structure results in the splitting of the d bands, owing to the destruction of the degeneracy at the Fermi level, and suggested the existence of the solid-state Jahn–Teller effect in this system.7 Later, the structural stability of this system was investigated based on DFT. It was found that nonmagnetic MnAl preferentially forms a cubic B2 structure, highlighting the importance of magnetic interaction in the structure.18 In short, the FM state prefers the tetragonal L10 structure, and the tetragonality is expected to be weakened with a reduction in the magnetic moment. Thus, the reduction in tetragonality with the increase in the nonmagnetic Al content can be explained on this basis.
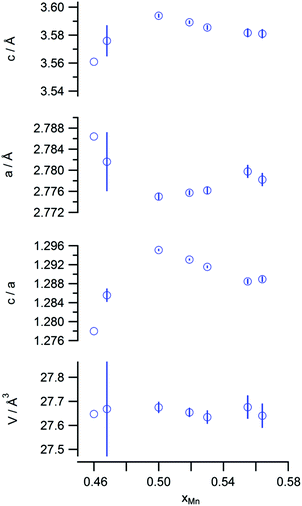 | ||
| Fig. 6 Lattice constants (c and a), axial ratio (c/a), and cell volume (V) values of the L10 phases. | ||
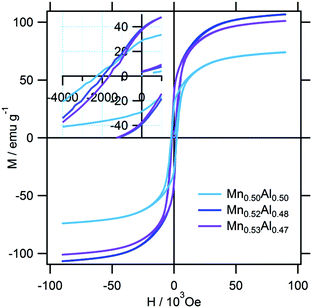
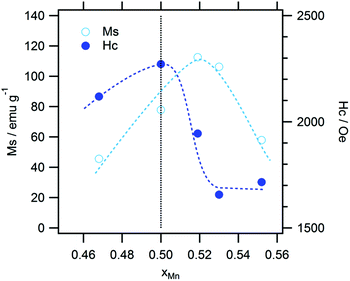
The typical magnetization curves of the test samples are shown in Fig. 7. Owing to the difference in the L10 contents, the saturation magnetization (Ms) varied from sample to sample, while the coercive force (Hc) values of the samples were almost similar. These are plotted against the Mn content in Fig. 8. The highest Ms value was observed in the case of a slightly Mn-rich composition, for which the volume extent of the L10 phase in the product was the highest. In order to account for the effect of the secondary phases, the observed Ms value was normalized with respect to the L10 phase weight fraction, which was evaluated as being 1.8μB for the samples. This value corresponds to 75% of the theoretical one. In addition, we expected that the normalization would increase the Ms towards the stoichiometric composition. However, this trend was not observed, so that the ordering parameter did not matter either. On the other hand, the highest Hc value was observed at the stoichiometric composition. A plot of Hc against the axial ratio (c/a) (see Fig. 9) shows that the increase in tetragonality increased Hc. It is interesting to note that the reduction in c/a did not significantly decrease Hc in the case of the Al-rich composition.
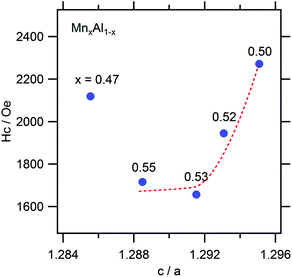 | ||
| Fig. 9 Coercive force (Hc) as a function of the axial ratio (c/a). The guiding line represents Mn-rich samples. | ||
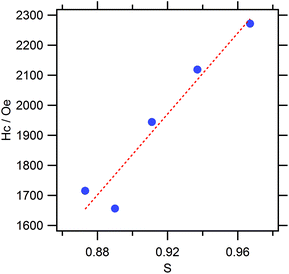
The effect of c/a on the MAE value of several L10 compounds has been investigated theoretically using a second-order perturbation formula.13 According to the obtained results, the MAE value of L10 compounds tends to become higher with the c/a value. This can be roughly explained from that the reduction in the dimensionality results in localized valence electrons, leading to the increase in the gradient in the electrostatic potential and subsequent strengthening in the spin–orbit interactions. More specifically, for the MnAl system, an increase in the MAE value of approximately 18% is predicted for an increase in c/a of 5%. The theory reasonably explains the obtained experimental results; however, the degree of quantitative agreement is rather low. In the present work, an increase in Hc of 37% was caused by a mere difference of 0.3% in c/a. This suggests that the Mn present at the antisite was the dominant factor affecting MAE: the ordering was more critical than the c/a in the case of the studied samples. Indeed, we found a linear relationship between Hc and S among the samples (Fig. 10). In addition, the rough estimation of the anisotropic field based on the initial magnetization and corresponding differential curves showed a marginal difference among them, which suggests that the microstructural influence was observed in the Hc of present samples as well.
Conclusions
The HPS process was used for the synthesis of the L10 MnAl phase, resulting in the emergence of L10 at pressures higher than 5 GPa at 900 °C. The increase in the phase fraction with the pressure indicated that the L10 phase forms preferentially at small volumes. In contrast to the conventional synthesis method, which is based on the use of the ε-phase, the proposed synthesis route was found to be advantageous in terms of the fact that various compositional Mn/Al ratios, including the stoichiometric composition, could be attained. The structural analysis of the L10 phases revealed that the lattice constants varied systematically with the composition, with the highest c/a and S values being observed at the stoichiometric composition. The maximum Ms value was observed at a slightly Mn-rich composition; this was because the fraction of the L10 phase in the product was the highest in this case. In addition, the Ms value normalized with respect to the L10 fraction was estimated to be 1.8μB, which was 75% of the theoretical one. On the other hand, Hc tended to increase with S and reached its maximum at the stoichiometric composition. The change in Hc with S suggests that the elimination of Mn at the antisite is crucial.Acknowledgements
This paper is based on the results obtained during the Future Pioneering Program “Development of magnetic material technology for high-efficiency motors”, which was commissioned by the New Energy and Industrial Technology Development Organization (NEDO), Japan.References
- J. C. Slater, J. Appl. Phys., 1937, 8, 385 CrossRef CAS.
- S. Okamoto, N. Kikuchi, O. Kitakami, T. Miyazaki, Y. Shimada and K. Fukamichi, Phys. Rev. B: Condens. Matter, 2002, 66, 024413 CrossRef.
- P. Ravindran, A. Kjekshus, H. Fjellvåg, P. James, L. Nordström, B. Johansson and O. Eriksson, Phys. Rev. B: Condens. Matter, 2001, 63, 144409 CrossRef.
- Y. Miura, S. Ozaki, Y. Kuwabara, M. Tsujikawa, K. Abe and M. Shirai, J. Phys.: Condens. Matter, 2013, 25, 106005 CrossRef PubMed.
- S. Fukami, H. Sato, M. Yamanouchi, S. Ikeda and H. Ohno, Appl. Phys. Express, 2013, 6, 073010 CrossRef.
- S. H. Nie, L. J. Zhu, J. Lu, D. Pan, H. L. Wang, X. Z. Yu, J. X. Xiao and J. H. Zhao, Appl. Phys. Lett., 2013, 102, 152405 CrossRef.
- A. Sakuma, J. Magn. Magn. Mater., 1998, 187, 105 CrossRef CAS.
- J. M. Coey, J. Phys.: Condens. Matter, 2014, 26, 064211 CrossRef CAS PubMed.
- J. Z. Wei, Z. G. Song, Y. B. Yang, S. Q. Liu, H. L. Du, J. Z. Han, D. Zhou, C. S. Wang, Y. C. Yang, A. Franz, D. Többens and J. B. Yang, AIP Adv., 2014, 4, 127113 CrossRef.
- J. J. Van Den Broek, H. Donkersloot, G. Van Tendeloo and J. Van Landuyt, Acta Metall., 1979, 27, 1497 CrossRef CAS.
- C. Yanar, J. M. K. Wiezorek, V. Radmilovic and W. A. Soffa, Metall. Mater. Trans. A, 2002, 33, 2413 CrossRef.
- A. Sakuma, J. Phys. Soc. Jpn., 1994, 63, 1422 CrossRef CAS.
- T. Kosugi, T. Miyake and S. Ishibashi, J. Phys. Soc. Jpn., 2014, 83, 044707 CrossRef.
- A. Edström, J. Chico, A. Jakobsson, A. Bergman and J. Rusz, Phys. Rev. B: Condens. Matter, 2014, 90, 014402 CrossRef.
- M. Ellner, Metall. Trans. A, 1990, 21, 1669 CrossRef.
- F. Izumi and K. Momma, Solid State Phenom., 2007, 130, 15 CrossRef CAS.
- E. Şaşioğlu, L. M. Sandratskii and P. Bruno, Phys. Rev. B: Condens. Matter, 2005, 71, 214412 CrossRef.
- Y. Kurtulus and R. Dronskowski, J. Solid State Chem., 2003, 176, 390 CrossRef CAS.
| This journal is © The Royal Society of Chemistry 2016 |


