 Open Access Article
Creative Commons Attribution 3.0 Unported Licence
Role of crystal size on swing-effect and adsorption induced structure transition of ZIF-8†
Tian
Tian
a,
Michael T.
Wharmby
b,
José B.
Parra
c,
Conchi O.
Ania
c and
David
Fairen-Jimenez
 *a
*a
aDepartment of Chemical Engineering and Biotechnology, University of Cambridge, Pembroke St., Cambridge CB2 3RA, UK. E-mail: df334@cam.ac.uk
bDiamond Light Source Ltd., Diamond House, Harwell Science & Innovation Campus, Didcot, Oxon., OX11 0DE, UK
cInstituto Nacional del Carbón, INCAR-CSIC, Oviedo, Spain
First published on 26th February 2016
Abstract
The flexibility and structure transition behaviour of ZIF-8 in a series of samples with different particle size has been studied using a combination of high-resolution N2 gas adsorption isotherms and, for the first time, a broad in situ PXRD and Rietveld analysis. During the stepped adsorption process, large particles showed a narrow adsorption/desorption pressure range with a shorter equilibrium time due to lower kinetic hindrance, deriving from higher amount of active sites. In situ PXRD showed that both the rotation of imidazole ring and a bend in the methyl group led to the gate opening of ZIF-8.
Introduction
Zeolitic imidazole frameworks (ZIFs) are a subfamily of metal–organic frameworks (MOFs) with zeolitic topologies. ZIFs have attracted great interest for combining the advantages of MOFs (i.e. large pore volume, high surface area, tuneable chemical functionality) and zeolites (i.e. high thermal and chemical stability).1 These properties make ZIFs excellent candidates in gas adsorption,2,3 separation4,5 and catalysis.6,7Among all ZIFs, ZIF-8 [Zn(mIM)2] (mIM = 2-methylimidazolate, C4H5N2−) is of particular interest due to its high thermal and chemical stability, and characteristic porosity.8,9 ZIF-8 presents a large BET area (SBETca. 1700 m2 g−1) and relative high crystal densities (0.95 g cm−3), and can be prepared in large and chemically robust monolithic morphologies with large volumetric adsorption capacities (SBET(vol) = 1660 m2 cm−3).10 ZIF-8 possesses a sodalite (SOD) topology containing relatively large pore cavities (ca. 11.6 Å diameter) interconnected by small windows (ca. 3.4 Å diameter).11 Due to its small window size, ZIF-8 was expected to separate molecules with different kinetic diameters. However, it was found that gas molecules with diameter larger than 3.4 Å, e.g. N2 (3.6 Å), could also be adsorbed.12
In a previous study, we combined the use of grand canonical Monte Carlo (GCMC) simulations and in situ powder X-ray diffraction (PXRD) to demonstrate that the structural transition of ZIF-8 was induced by gas adsorption, from an ambient to a high pressure structure, ZIF-8AP and ZIF-8HP, respectively.13 The structural change implies the reorientation of the mIM ligands and the increase in the size of both the 4- and 6-ring windows present in this material. In particular, the swing effect of the imidazole rings is responsible for the stepwise adsorption of N2 at 77 K at 0.02 p/p0. We have also shown the existence of the swing effect and phase transition in ZIF-8 during the adsorption of other alkanes at ca. 0.1 p/p0 and 125 K for methane; as well as 0.3 p/p0, 0.02 p/p0 and 6 × 10⁻³p/p0 at 273 K for ethane, propane and butane, respectively.14 Interestingly, in all these later cases the phase transition takes place without observing a stepped behaviour in the adsorption process (i.e. Type I adsorption isotherms). Using DFT calculations, we showed that the driving force for this transition was related to the insertion of additional molecules in the 4-ring windows, which in turn stabilizes the “high-loading” ZIF-8HP structure. Following this work, Ania et al. studied the structural transition of ZIF-8 using high resolution adsorption isotherms of different gases (CO, N2, O2, Ar) at different temperatures (77 and 90 K) and found that polarizability, size and shape of gas molecules affected the swing effect and phase transition behaviour.15 Contrary to our previous results,13 Ania et al.15 and Park et al.,1 observed hysteresis during the desorption of N2 and Ar at cryogenic temperatures as well as some other gases such as CO and O2, and reported the existence of two adsorption substeps around the transition pressure, attributing this behaviour to the reorganization of the adsorbed gas molecules and their interactions with the framework. In addition to these studies, the swing effect of ZIF-8 has been further studied both experimentally and computationally.16,17 For example, by using single crystal XRD and Raman spectroscopy, it has been observed that the structural transition of ZIF-8 was also induced by reducing the temperature beyond 150 K under N2.18,19 We and others have also shown recently the use of THz radiation and inelastic neutron scattering for the study of the flexibility modes of ZIF-8.20–22 Although the adsorption mechanism of multiple gases as well as the shape of the adsorption isotherms of ZIF-8 have been widely investigated, the origin of the substeps in the adsorption isotherms of various gases at cryogenic temperatures, and of the occurrence of a hysteresis loop during the desorption are still unclear.
During the preparation of this manuscript, Zhang et al. demonstrated that the particle size of ZIF-8 affected its structural transition during N2 adsorption at 77 K.23 By applying the osmotic framework adsorbed solution theory (OFAST),24 they observed that the pressure for the phase transition shifted to higher values when the particle size was reduced. This finding is especially relevant because ZIF-8 can be synthesized with particle sizes in the nanometre to micrometre range.25 In this regard, the flexibility of ZIF-8 is of particular importance as it affects the diffusivity of gas molecules through the porous network. Indeed, previous molecular dynamic studies have shown tremendous differences in the diffusivity of gas molecules between the rigid and the flexible structure of ZIF-8.14,26,27
In this work, we synthesised ZIF-8 with a wide range of particle sizes and studied the role of the particle size on the gas-induced structural transition on adsorption of N2 at 77 K, as well as the kinetics of the process. We also include, for the first time, a detailed study about the mechanisms of the phase transition during the adsorption process by using in situ PXRD experiments during N2 adsorption at cryogenic temperature on two different sized ZIF-8 samples.
Experimental
Materials
Zn(NO3)·6H2O (98%), 2-methylimidazole (97%), sodium formate (98%) and methanol (99%) were purchased from Alfa Aesar. All chemicals were used as received.Synthesis of ZIF-8s
Six different ZIF-8 samples with different particle size were prepared using different methods. ZIF-8-0.14 was synthesised based on the method reported by Pan et al.28 Aqueous solutions of Zn(NO3)·6H2O (8 ml, 0.492 M) and 2-methylimidazole (80 ml, 3.46 M) were mixed and stirred for 5 minutes under ambient conditions.ZIF-8-0.21, ZIF-8-0.61 and ZIF-8-1.6 were synthesised based on methods reported by Kida et al.29 Aqueous solutions of Zn(NO3)·6H2O (10 ml, 0.25 M) and 2-methylimidazole (90 ml, 2.77 M) were mixed and stirred for 24 h under ambient conditions to synthesise ZIF-8-0.21. ZIF-8-0.61 and ZIF-8-1.6 were synthesised by reducing the concentration of 2-methylimidazole to 1.66 M and 1.11 M, respectively, while keeping other conditions unchanged.
ZIF-8-10 and ZIF-8-98 were synthesised based on methods reported by Zhang et al.30 For ZIF-8-10, 2-methylimidazole (0.099 M) and sodium formate (0.198 M) were dissolved in 40 ml of methanol, which was then poured into a solution of Zn(NO3)·6H2O (40 ml, 0.049 M) in methanol. The mixture was placed in a Teflon-lined steel autoclave and heated at 363 K overnight. For ZIF-8-98, 2-methylimidazole (0.593 M) and sodium formate (0.281 M) were dissolved in 40 ml of methanol, and then poured into a solution of Zn(NO3)·6H2O (40 ml, 0.3 M) in methanol. The mixture was placed in a Teflon-lined steel autoclave and heated at 363 K overnight.
All as synthesised solids were collected by centrifugation, washed with ethanol (20 ml, 3 times) and dried at 373 K under vacuum.
Characterisation of materials
Powder X-ray diffraction (PXRD) patterns were recorded with a Bruker D8 diffractometer using Cu Kα1 (λ = 1.54056 Å) radiation with a step of 0.02° at a scanning speed of 0.1° s−1. Scanning electron microscope (SEM) images were taken using a Hitachi S-5500 FE SEM with an accelerating voltage of 1 kV.High resolution N2 adsorption–desorption isotherms were measured at 77 K using a Micromeritics ASAP 2020 instrument in the relative pressure range from 10−6 to 1 for the adsorption branch and down to 10−3 for the desorption branch. The instrument was equipped with a molecular drag vacuum pump and three pressure transducers (0.1, 10, 1000 mmHg, uncertainty within 0.15% of reading) to enhance the sensitivity in the low-pressure range. All samples were evacuated overnight for 24 h at 423 K under dynamic vacuum prior to adsorption. Strict analysis conditions were programmed during the gas adsorption measurements to ensure equilibrium data in all cases. Consequently, the average elapsed time for the measurement of the isotherms was 90–120 h, with over 200 equilibrium points on average per isotherms. The saturation pressure of the gas was continuously measured throughout the analysis by means of a pressure transducer. For all isotherms, warm and cold freespace correction measurements were performed by using ultrahigh purity He gas (grade 5.0, 99.999% purity). Ultrahigh purity N2 (i.e. 99.9992%) was provided by Air Products.
Data for the in situ gas adsorption powder X-ray diffraction experiments were collected at beamline I11 at Diamond Light Source (Oxon., UK; λ = 0.825701 Å), using the I11 gas cell at 80 K.31–33 Both ZIF-8-0.14 and ZIF-8-98 samples were activated prior to the gas adsorption experiment by heating to 413 K under vacuum. Data were collected at 22 different pressures, 11 in the 0.0–0.1 p/p0 range and 11 in the 0.1–0.9 p/p0 range. Selected pressure points were fully refined by the Rietveld method using the TOPAS-Academic v5 suite.34 Subsequently, these structures were used as fixed points in a parametric Rietveld refinement,35 also performed using TOPAS-Academic v5. See ESI† for full details.
Results and discussion
ZIF-8 particle size and gas adsorption
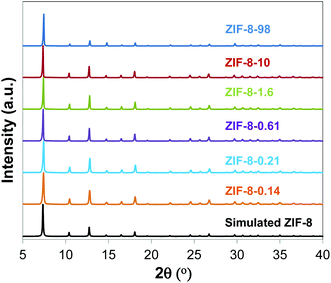
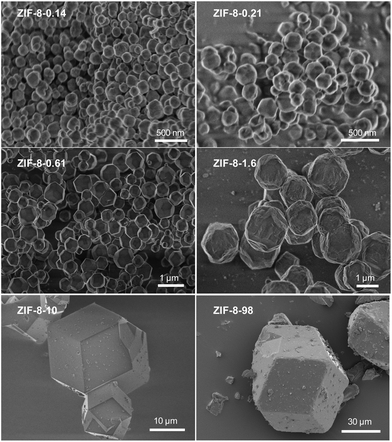
We controlled the particle size of ZIF-8 by modifying the Zn/mIM ratio or by incorporating additives as reported elsewhere.9,29,36Fig. 1 shows the PXRD patterns of the different samples. The different samples matched the simulated PXRD pattern, indicating the successful synthesis of ZIF-8. Although the full width at half maximum was larger for small particles than for large ones, we were not able to calculate the particle size by using the Scherrer equation since the equipment contribution to the broadening of the Bragg peaks was larger than the contribution from the samples. In this case, we measured the particle size of ZIF-8 samples by using SEM. Fig. 2 shows the SEM images, whilst Fig. S1† and Table 1 show the normal (Gaussian) distribution and the average particle size, respectively, of the different ZIF-8 samples. Particle size for ZIF-8 was in the range between 0.141 and 98 μm. In particular, smaller particle size ZIF-8 showed narrower size distribution compared with larger ones.| Materials | Particle size (μm) | BET areas (m2 g−1) |
|---|---|---|
| ZIF-8-0.14 | 0.141 ± 0.035 | 1740 |
| ZIF-8-0.21 | 0.213 ± 0.041 | 1702 |
| ZIF-8-0.61 | 0.608 ± 0.013 | 1739 |
| ZIF-8-1.6 | 1.6 ± 0.4 | 1799 |
| ZIF-8-10 | 10.0 ± 0.5 | 1809 |
| ZIF-8-98 | 98 ± 34 | 1731 |
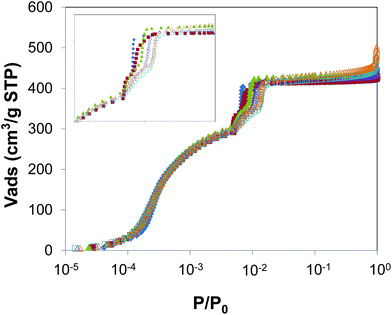
We further analysed the porosity for all samples by using high-resolution N2 adsorption/desorption isotherms at 77 K. The BET areas of ZIF-8 samples were calculated using the Rouquerol's consistency criteria.37Table 1 shows similar BET areas, ranging between 1700 and 1810 m2 g−1, for all the materials. Fig. 3 shows the adsorption isotherms of N2 on ZIF-8 samples; we used a semi-log plot to give more detail in the low pressure range. All samples presented the same characteristic stepwise adsorption isotherm widely reported for ZIF-81,13,15 and the swing effect of the mIM rings at a similar onset transition, of ca. 5 × 10⁻³p/p0. As particle size decreases, the samples showed a slight increase in the uptake during the plateau and close to saturation. This effect is attributed to the existence of interstitial spaces between ZIF-8 particles, something that is more important for smaller particle size.
Fig. 3 (inset) shows a magnification of the adsorption isotherms in the phase transition region for clarity, whereas Fig. 4 and S4† show the adsorption and desorption branches, where the differences between samples of different size are evident. On the one hand, samples with smaller particle size (i.e. ZIF-8-0.14 and ZIF-8-0.21) shifted the gate pressure for the adsorption substep to higher p/p0 values compared to samples with larger particle size (i.e. from 0.006 to 0.014 p/p0). On the other hand, samples with smaller particle size showed a wider hysteresis loop compared to larger particle samples. Interestingly, in the case of ZIF-8-98 (i.e. the sample with the largest particle size) the adsorption was completely reversible and no hysteresis was found. These phenomena agreed well with the previous reports from Ania et al., which indicate the presence of hysteresis15 – and from some of us which show no such hysteresis.13 As the hysteresis loop occurred at very low pressures, it cannot be explained by a capillary condensation mechanism characteristic of mesoporous materials.38 This is attributed to the desorption of N2 from an opened ZIF-8HP structure and hence gradual rearrangement of the remaining gas molecules during the transition to the initial closed ZIF-8AP structure.
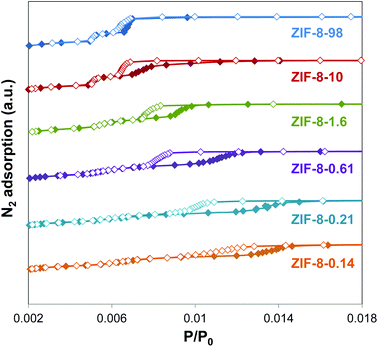 | ||
| Fig. 4 Low pressure hysteresis loops of ZIF-8 samples with different particle size. Closed symbols, adsorption; open symbols, desorption. | ||
The shift of the gate pressure to higher values and the wider range of the hysteresis loop for smaller particles suggests a higher energy barrier between ZIF-8AP and ZIF-8HP structures, and thus, a higher kinetic hindering. A similar observation was made by Watanabe et al.,39 using GCMC simulation, where they showed that the width of the hysteresis loop was inversely proportional to the energy barrier. This transition was also observed experimentally by Sakata et al.40 for the interpenetrated [Cu2(bdc)2(bpy)]n (bdc = 1,4-benzenedicarboxylate, bpy = 4,4′-bipyridine) system, which exhibited a cooperative guest-induced structural transformation from a non-porous closed phase to an open phase.
Dynamic adsorption measurements
Changes in framework flexibility are especially relevant for ZIF-8, where the very narrow windows will allow (or not) the adsorption of larger molecules. Having a range of samples with different adsorption behaviour at thermodynamic equilibrium conditions in the adsorption isotherms, we decided to study the adsorption kinetics by measuring the equilibration time of each equilibrium adsorption point of the isotherms. For clarity, Fig. 5 shows a comparison of the samples with large (i.e. ZIF-8-98) and small (i.e. ZIF-8-0.14) particle size only. Fig. S5† shows the adsorption equilibration time during the N2 adsorption isotherm at 77 K, for all the samples.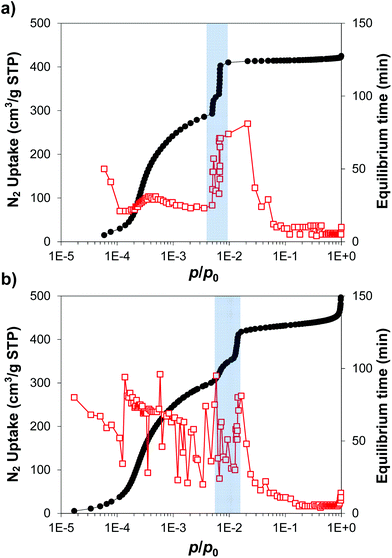 | ||
| Fig. 5 Adsorption isotherms and equilibrium time for N2 at 77 K for (a) ZIF-8-98 and (b) ZIF-8-0.14. Black circles, N2 uptake; red empty squares, equilibrium time; grey shading, gate pressure region. | ||
There are three clear ranges taking into account the phase transition occurring at a gate pressure of ca. 5 × 10⁻³p/p0. First, before the gate pressure, all the ZIF-8 samples showed very different adsorption kinetics, with the equilibration process being much faster for samples with larger particle sizes (e.g. ZIF-8-98, ca. 25 min) than for those with smaller particle size (e.g. ZIF-8-0.14, ranging from 100 to 25 min). Second, the adsorption rate for all samples was significantly slowed near the gate pressure (up to ca. 80 min), before increasing at p/p0 > 0.01 (i.e. after the transition to ZIF-8HP), which is the third stage with all the samples behaving similarly, with faster kinetics than at lower pressures. The dependency of the adsorption equilibration time and particle size before the gate pressure implies differences in ZIF-8AP flexibility (i.e. the dynamic, free swing of the mIM rings to allow access of large molecules into the cavities) between different samples at these conditions. In turn, the increase of the equilibration time (i.e. slow kinetics) at the gate pressure would be explained by the permanent swing of the mIM rings, and the access and rearrangement of the gas molecules in the cavities, and therefore the phase transition of ZIF-8AP to ZIF-8HP observed within this pressure range.13 Above the transition pressure all samples present somewhat similar kinetics due to the opened structure. These observations are consistent with a model in which, below the gate pressure, the 3.4 Å windows in ZIF-8 change between open and closed configurations depending on environmental pressure gradient; whereas above the gate pressure, the windows remain open. In these conditions of static low and high pressure, a snapshot of the ZIF-8 structure would reveal (at least) two discrete, non-disordered phases ZIF-8AP and ZIF-8HP rather than a free swing of the mIM rings. This dynamic opening and closing process during the pressure swing depends on the particle size of ZIF-8.
Assuming that both the large and the small particles have the same structure, we are effecting the same change in both samples. From a thermodynamic point of view, the energy change should also be the same for both. As shown above, we found however important differences between samples, so the question would be: are there any differences in the composition or the structure of the different ZIF-8 crystals? The main difference is related to the ratio of external surface vs. bulk phase, which is much larger for smaller than for larger particles. This would imply that the external surface/bulk ratio of the 4-ring windows in large particles sizes is lower than in small particles. If the driving force for the phase transition is the adsorption of additional N2 molecules in the 4-ring window in the bulk14 – similar to the hand-glove model of enzymes – we will have a higher amount of active sites in larger particles, therefore reducing the activation energy for the phase transition.
Evolution of the ZIF-8 structure
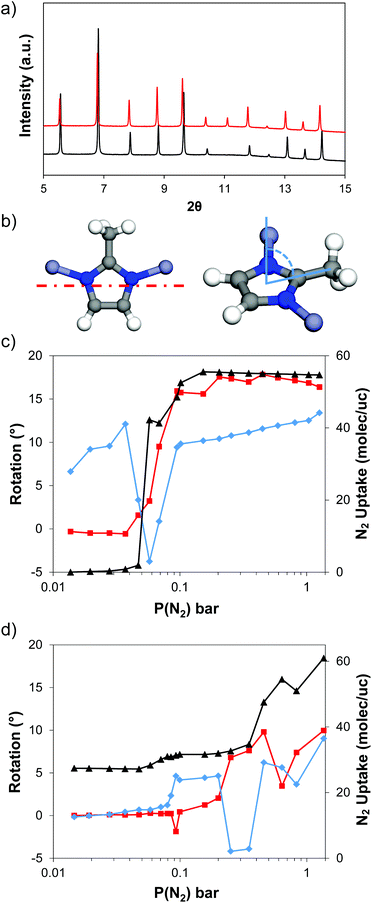
In order to validate our analysis of the phase transition behaviour of ZIF-8 with different particle sizes, we performed in situ PXRD experiments for ZIF-8-98 and ZIF-8-0.14 upon the adsorption of N2 at 80 K. Fig. 6a shows, as an example, the comparison of the PXRD patterns obtained for ZIF-8-0.14 before and after N2 adsorption. During N2 adsorption, all the peaks are shifted to lower angles, and the (004) (2θ = 11.11°) reflection shows a notable gain in intensity. Rietveld refinements to obtain crystallographic models were successful in both structures (Fig. S6†). Fig. 6b–d shows the rotation of the mIM rings and the bend of the methyl group from the planar mIM rings with increasing adsorption pressure in both ZIF-8 samples, whereas Fig. S7† shows the changes in the a cell parameter. The N2 uptakes measured during the in situ experiment have been included in both figures as a reference. The amount adsorbed during the diffraction experiments differs from the equilibrium isotherms measured volumetrically; this difference is attributed to the fact that the gas adsorption during the in situ PXRD measurements is not fully equilibrated, and to the slightly higher adsorption temperature (80 vs. 77 K). Despite this, the two samples clearly present different trends during the in situ PXRD experiment: for ZIF-8-98 the uptake of gas is negligible below 0.05 bar; above this pressure the amount adsorbed increased up to 31 molecules per unit cell (220 cm3 per g STP), followed by a second step up to ca. 55 molec per uc (390 cm3 per g STP). In contrast, ZIF-8-0.14 started with a loading of 27 molec per uc (191 cm3 per g STP) at low pressures and jumped up to ca. 31 molec per uc (220 cm3 per g STP) at 0.07 bar, followed by a second step of ca. 54 molec per uc (380 cm3 per g STP) at 0.6 bar.Evolution of the structure in large particle size ZIF-8-98
Rietveld refinement of the activated ZIF-8 sample under vacuum and 80 K shows the well-known gate-closed ZIF-8AP structure,13,41 with the methyl groups projecting into the pore windows and hindering the accessibility of N2 molecules through the 4-ring windows. Upon adsorption of N2 up to 0.0371 bar, the unit cell undergoes a slight decrease in volume by ca. 0.1% (∼3.5 Å3 for lattice parameter a). Over this range, the mIM ring configuration remained almost unaltered (Fig. 6). Interestingly, the methyl group bent from the mIM plane to open the window. Upon increasing the pressure to 0.0685 bar, the unit cell increases in volume by 0.8% (∼41 Å3), which is associated with a rotation of the mIM rings by up to 9° to open the pore windows, and a decrease in the degree of out-of-plane bending of the methyl group.Fig. S8† shows the first adsorption site (observed from 0.0371 bar and 0.816 molec per uc), associated to Site I as described previously for adsorption of methane in ZIF-8.14 At ca. 42 molec per uc (i.e. the first step at 0.0575–0.0685 bar), two additional N2 adsorption sites in the centre of the 6-ring window (4.4 molec per uc) and the centre of the cavity (2.1 molec per uc) were identified, associated to Site II and Site III, respectively.42 We termed this phase as the gate-closed large cell ZIF-8AP structure.
Interestingly, the PXRD patterns of ZIF-8-98 obtained at 0.0798 and 0.0868 bar showed a splitting of the diffraction peaks into three, indicating a mixture of different phases – probably due to the lack of equilibrium (Fig. S10†). These three phases were identified as: (i) the gate-closed ZIF-8AP structure (at p(N2) = 0 bar), (ii) the gate-closed large cell ZIF-8AP structure (observed at p(N2) = 0.0685 bar) and the (iii) gate-open ZIF-8HP structure (p(N2) > 0.0948 bar). Increasing adsorption pressure led to further N2 uptake and the completion of the phase transition to ZIF-8HP structure. This was accompanied by an increase in unit cell volume by ca. 0.9% (∼50 Å3); after the phase transition, the unit cell volume remains approximately constant. At ca. 52 molec per uc (i.e. the second adsorption substep at pressures above 0.100 bar), the rotation of the mIM rings increased to 16°, whereas the methyl group bent between 9 and 12°. A new adsorption site was identified in the 4-ring window with 3.9 molec per uc adsorbed (Fig. S8c†), and was associated to Site IV.14
Evolution of the structure in small particle size ZIF-8-0.14
The evolution of ZIF-8-0.14 differed significantly from that of the ZIF-8-98. Under vacuum at 80 K, ZIF-8-0.14 adopts the gate-closed ZIF-8AP structure, although with a slightly smaller unit cell (ZIF-8-98, a = 17.00590(3) Å; ZIF-8-0.14, a = 16.98271(5) Å). At the lowest pressure measured (i.e. 0.0146 bar) three adsorption sites for N2 molecules were identified in the structure (Fig. S9†), with 20.5 molec per uc, 3.5 molec per uc and 3.4 molec per uc adsorbed, respectively, giving a total of 27 N2 molecules per unit cell. These sites correspond to Site I, II and III, respectively, as also identified in methane adsorption studies on ZIF-8.14Increasing the adsorption pressure to 0.3500 bar led only to a small increase in the number of adsorbed molecules (i.e. 35 molec per uc). One additional adsorption site was observed at this pressure: Site IV 0.5 molec per uc at the centre of the 4-ring window. In this range of pressure, both the rotation of the mIM rings and the bend of the methyl groups increased gradually up to 7.6 and 3.9°, respectively. This was similar to the values obtained for the large crystal ZIF-8-98 and the intermediate step during the adsorption process. Increasing the adsorbate pressure led to a jump in the N2 uptake, reaching 61 molec per uc at 1.3580 bar, as well as an increase in the rotation of the mIM rings and the bend of the methyl group up to 10 and 9°, respectively. This jump corresponds to the transition to the ZIF-8HP.
Overall, ZIF-8-0.14 showed a broader pressure range of transition compared with ZIF-8-98 (Fig. S6†). This is similar to the trend of phase transition in N2 isotherms at 77 K. The overall rotation of the imidazole for ZIF-98 and ZIF-8-0.14 is 17° and 10°, respectively as shown in Fig. S11 and S12.†
Conclusions
We have studied the adsorption properties of a series of ZIF-8 materials with different particle sizes using high-resolution N2 adsorption isotherms at 77 K and in situ PXRD. The pressure at which the gas-induced phase transition occurs (between ZIF-8AP and ZIF-8HP structures) is strongly influenced by the particle size of the ZIF-8 crystals. In this regard, small particle sizes of ZIF-8 (ZIF-8-0.14), showed a smoother and broader stepped adsorption behaviour as well as a hysteresis loop during desorption, compared with larger particle sizes (ZIF-8-98). These differences are caused by the higher energy barrier and smaller amount of active sites in the smaller particle size ZIF-8. The differences found during equilibrium adsorption are also extended to the adsorption kinetics. In this regard, more rigid ZIF-8-0.14 shows longer equilibration times than ZIF-8-98 at low pressures before the phase transition between ZIF-8AP and -HP. At higher pressures, when the ZIF-8 material adopts the ZIF-8HP structure, equilibration times were significantly reduced and very similar between both ZIF-8-98 and ZIF-8-0.14. In situ PXRD studies during the adsorption of N2 at 80 K showed changes in the rotation of both the 2-methylimidazole ring and the bend angle of the methyl group during the process. All these findings are of particularly importance in the design and engineering of new MOF adsorbents and MOF based mixed membranes, and to tune the selectivity properties of new materials for specific applications such as efficient CO2 capture.43Acknowledgements
This work was funded by the EPSRC IAA Partnership Development Award (RG/75759). D. F.-J. thanks the Royal Society for funding through a University Research Fellowship. We thank Diamond Light Source for beamtime at beamline I11 (visit EE9750).Notes and references
- K. S. Park, Z. Ni, A. P. Côté, J. Y. Choi, R. Huang, F. J. Uribe-Romo, H. K. Chae, M. O'Keeffe and O. M. Yaghi, Proc. Natl. Acad. Sci. U. S. A., 2006, 103, 10186 CrossRef CAS PubMed.
- P. Zhao, G. I. Lampronti, G. O. Lloyd, E. Suard and S. A. T. Redfern, J. Mater. Chem. A, 2014, 2, 620 CAS.
- H. Wu, W. Zhou and T. Yildirim, J. Am. Chem. Soc., 2007, 129, 5314 CrossRef CAS PubMed.
- A. Huang, Q. Liu, N. Wang and J. Caro, Microporous Mesoporous Mater., 2014, 192, 18 CrossRef CAS.
- J. Sanchez-Lainez, B. Zornoza, A. Mayoral, Á. Berenguer-Murcia, D. Cazorla-Amorós, C. Tellez and J. Coronas, J. Mater. Chem. A, 2015, 7, 6549 Search PubMed.
- L. T. L. Nguyen, K. K. A. Le, H. X. Truong and N. T. S. Phan, Catal. Sci. Technol., 2012, 2, 521 CAS.
- L. H. Wee, T. Lescouet, J. Ethiraj, F. Bonino, R. Vidruk, E. Garrier, D. Packet, S. Bordiga, D. Farrusseng, M. Herskowitz and J. A. Martens, ChemCatChem, 2013, 5, 3562 CrossRef CAS.
- J. Cravillon, S. Münzer, S. J. Lohmeier, A. Feldhoff, K. Huber and M. Wiebcke, Chem. Mater., 2009, 21, 1410 CrossRef CAS.
- J. Cravillon, R. Nayuk, S. Springer, A. Feldho, K. Huber and M. Wiebcke, Chem. Mater., 2011, 2130 CrossRef CAS.
- T. Tian, J. Velazquez-Garcia, T. D. Bennett and D. Fairen-Jimenez, J. Mater. Chem. A, 2015, 3, 2999 CAS.
- X.-C. Huang, Y.-Y. Lin, J.-P. Zhang and X.-M. Chen, Angew. Chem., Int. Ed., 2006, 45, 1557 CrossRef CAS PubMed.
- W. Zhou, H. Wu, M. R. Hartman and T. Yildirim, J. Phys. Chem. C, 2007, 111, 16131 CAS.
- D. Fairen-Jimenez, S. A. Moggach, M. T. Wharmby, P. A. Wright, S. Parsons and T. Düren, J. Am. Chem. Soc., 2011, 133, 8900 CrossRef CAS PubMed.
- D. Fairen-Jimenez, R. Galvelis, A. Torrisi, A. D. Gellan, M. T. Wharmby, P. A. Wright, C. Mellot-Draznieks and T. Düren, Dalton Trans., 2012, 41, 10752 RSC.
- C. O. Ania, E. García-Pérez, M. Haro, J. J. Gutiérrez-Sevillano, T. Valdés-Solís, J. B. Parra and S. Calero, J. Phys. Chem. Lett., 2012, 3, 1159 CrossRef CAS PubMed.
- X. Zhang and J. Jiang, J. Phys. Chem. C, 2013, 117, 18441 CAS.
- H. Tanaka, S. Ohsaki, S. Hiraide, D. Yamamoto, S. Watanabe and M. T. Miyahara, J. Phys. Chem. C, 2014, 118, 8445 CAS.
- J.-P. Zhang, A.-X. Zhu and X.-M. Chen, Chem. Commun., 2012, 48, 11395 RSC.
- G. Kumari, K. Jayaramulu, T. K. Maji and C. Narayana, J. Phys. Chem. A, 2013, 117, 11006 CrossRef CAS PubMed.
- M. R. Ryder, B. Civalleri, T. D. Bennett, S. Henke, S. Rudić, G. Cinque, F. Fernandez-Alonso and J.-C. Tan, Phys. Rev. Lett., 2014, 113, 215502 CrossRef PubMed.
- N. Y. Tan, M. T. Ruggiero, C. Orellana-Tavra, T. Tian, A. D. Bond, T. M. Korter, D. Fairen-Jimenez and J. A. Zeitler, Chem. Commun., 2015, 51, 16037 RSC.
- M. E. Casco, Y. Cheng, L. Daeman, D. Fairen-Jimenez, E. V. Ramos-Fernández, A. J. Ramirez-Cuesta and J. Silvestre-Albero, Chem. Commun., 2016, 52, 3639 RSC.
- C. Zhang, J. A. Gee, D. S. Sholl and R. P. Lively, J. Phys. Chem. C, 2014, 118, 20727 CAS.
- F.-X. Coudert, Phys. Chem. Chem. Phys., 2010, 12, 10904 RSC.
- S. R. Venna, J. B. Jasinski and M. A. Carreon, J. Am. Chem. Soc., 2010, 132, 18030 CrossRef CAS PubMed.
- E. Haldoupis, T. Watanabe, S. Nair and D. S. Sholl, ChemPhysChem, 2012, 13, 3449 CrossRef CAS PubMed.
- H. Bux, F. Liang, Y. Li, J. Cravillon and M. Wiebcke, J. Am. Chem. Soc., 2009, 131, 16000 CrossRef CAS PubMed.
- Y. Pan, Y. Liu, G. Zeng, L. Zhao and Z. Lai, Chem. Commun., 2011, 47, 2071 RSC.
- K. Kida, M. Okita, K. Fujita, S. Tanaka and Y. Miyake, CrystEngComm, 2013, 15, 1794 RSC.
- C. Zhang, R. P. Lively, K. Zhang, J. R. Johnson, O. Karvan and W. J. Koros, J. Phys. Chem. Lett., 2012, 3, 2130 CrossRef CAS PubMed.
- S. P. Thompson, J. E. Parker, J. Potter, T. P. Hill, A. Birt, T. M. Cobb, F. Yuan and C. C. Tang, Rev. Sci. Instrum., 2009, 80, 075107 CrossRef CAS PubMed.
- S. P. Thompson, J. E. Parker, S. J. Day, A. Evans and C. C. Tang, Eur. Astron. Soc. Publ. Ser., 2012, 58, 225 Search PubMed.
- J. E. Parker, J. Potter, S. P. Thompson, A. R. Lennie and C. C. Tang, Mater. Sci. Forum, 2012, 706–709, 1707 CrossRef CAS.
- A. Coelho, TOPAS-Academic v5, Coehlo Software, Brisbane, Australia, 2012 Search PubMed.
- G. W. Stinton and J. S. O. Evans, J. Appl. Crystallogr., 2007, 40, 87 CAS.
- M. C. McCarthy, V. Varela-Guerrero, G. V. Barnett and H. K. Jeong, Langmuir, 2010, 26, 14636 CrossRef CAS PubMed.
- J. Rouquerol, F. Rouquerol, K. S. W. Sing, P. Llewellyn, G. Maurin and K. S. W. Sing, Adsorption by powders and porous solids, 2014 Search PubMed.
- D. Fairen-Jimenez, N. A. Seaton and T. Düren, Langmuir, 2010, 26, 14694 CrossRef CAS PubMed.
- S. Watanabe, H. Sugiyama, H. Adachi, H. Tanaka and M. T. Miyahara, J. Chem. Phys., 2009, 130, 164707 CrossRef PubMed.
- Y. Sakata, S. Furukawa, M. Kondo, K. Hirai, N. Horike, Y. Takashima, H. Uehara, N. Louvain, M. Meilikhov, T. Tsuruoka, S. Isoda, W. Kosaka, O. Sakata and S. Kitagawa, Science, 2013, 193, 193 CrossRef PubMed.
- S. A. Moggach, T. D. Bennett and A. K. Cheetham, Angew. Chem., Int. Ed., 2009, 48, 7087 CrossRef CAS PubMed.
- H. Wu, W. Zhou and T. Yildirim, J. Phys. Chem. C, 2009, 113, 3029 CAS.
- B. Seoane, J. Coronas, I. Gascon, M. E. Benavides, O. Karvan, J. Caro, F. Kapteijn and J. Gascon, Chem. Soc. Rev., 2015, 44, 2421 RSC.
Footnote |
| † Electronic supplementary information (ESI) available: Particle size distribution, gas adsorption, BET areas calculation, and in situ X-ray diffraction. See DOI: 10.1039/c6dt00565a |
| This journal is © The Royal Society of Chemistry 2016 |

