DOI:
10.1039/C6DT00302H
(Paper)
Dalton Trans., 2016,
45, 9970-9976
Qualitative extension of the EC′ Zone Diagram to a molecular catalyst for a multi-electron, multi-substrate electrochemical reaction†
Received
21st January 2016
, Accepted 14th March 2016
First published on 21st March 2016
Abstract
The EC′ Zone Diagram, introduced by Savéant and Su over 30 years ago, has been used to classify voltammetric responses for electrocatalytic systems. With a single H2-evolving catalyst, Co(dmgBF2)2(CH3CH)2 (dmgBF2 = difluoroboryl-dimethylglyoxime), and a series of para-substituted anilinium acids, experimental conditions were carefully tuned to access to each region of the classic zone diagram. Close scrutiny revealed the extent to which the kinetic (λ) and excess (γ) factors could be experimentally controlled and used to access a variety of waveforms for this ECEC′ catalytic system. It was found that most of the tunable experimental parameters (such as catalyst concentration, scan rate, and substrate concentration) predicted in the EC′ Zone Diagram could be extended to a multi-electron system and produced similarly-shaped waveforms with some deviations. Tuning of a single catalyst across every region of the classic zone diagram has previously been prevented due to the seven orders of magnitude that need to be traversed across the kinetic parameter; however, the cobalt catalyst in this study provided unique control of this parameter. By varying the acids used as the proton source, the rate constants for protonation were tuned via a pKa-dependent linear free energy relationship.
Introduction
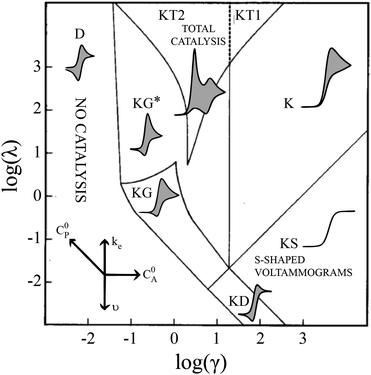
Electrochemical analysis is a highly flexible method with which to study homogeneous reactions. Of particular interest, mechanistic insight into molecular catalysts for electrochemical reactions can be gleaned from current-potential responses. Such responses, often recorded as cyclic voltammograms (CVs), were mathematically described for simple one-electron, one-substrate electrocatalytic reactions (EC′) by Savéant and Su more than 30 years ago.1 Various waveforms were identified based on dimensionless parameters and classified into nine ‘zones,’ different regions that can be predicted by experimental conditions (Fig. 1).
 |
| | Fig. 1 Kinetic zone diagram and simulated CV waveforms for the catalytic EC′ mechanism of the one electron reduction of substrate via a redox catalyst mediator. Reprinted with permission from ref. 5. | |
Despite examples of catalysts with voltammetric responses corresponding to two or three adjacent zones in the EC′ Zone Diagram, no single catalyst exhibiting waveforms that conform to all nine zones has been reported. This is not entirely surprising – the EC′ Zone Diagram traverses seven orders of magnitude along each axis, generally prohibiting access to the entire range of responses for a single catalyst. Moreover, to our knowledge, no precedent has been established in which the ‘model’ EC′ Zone Diagram has been extended to multi-electron processes, yet most molecular catalysts of contemporary interest mediate multi-electron, multi-substrate transformations like H2 evolution or CO2 reduction.2 In this work we demonstrate the successful exploration of a complete zone diagram with the molecular catalyst for hydrogen evolution, Co(dmgBF2)2(CH3CN)2 (1, dmgBF2 = difluoroboryl-dimethylglyoxime). Deliberate and careful modification of experimental variables kobs, C0A, υ, and C0P (rate constant, substrate concentration, scan rate, and catalyst concentration, respectively) produced waveforms matching each of the nine zones. In addition to providing experimental demonstrations of all nine zones with a single molecular catalyst, this work demonstrates that the EC′ Zone Diagram can be qualitatively extended to multi-electron systems.1–5
Background
Zone diagram
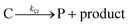
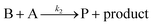
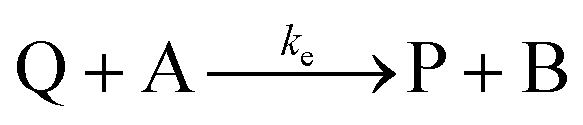
Cyclic voltammetry has proven a powerful tool for the investigation of molecular catalysis of electrochemical reactions.6–12 In 1984, Savéant and Su described the various voltammetric responses of the EC′ catalytic mechanism, wherein the one-electron reduction of substrate A to B is catalyzed by redox catalyst P (eqn (1) and (2)).1| | 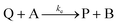 | (2) |
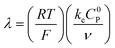
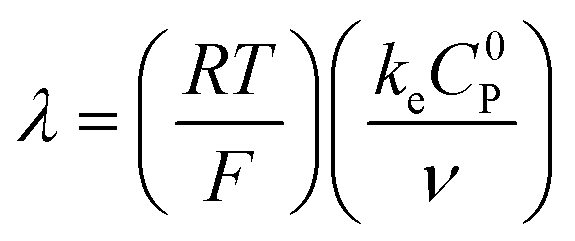
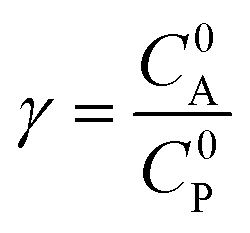
These CV responses were summarized in a Zone Diagram (Fig. 1) which pictorially describes the possible CV waveforms as a function of the kinetic (λ) and excess (γ) dimensionless parameters (eqn (3) and (4)):
| |  | (3) |
| |  | (4) |
where
R is the gas constant,
T the temperature,
F the Faraday constant,
ke the homogeneous electron transfer rate constant,
υ the scan rate, and
C0P and
C0A the initial concentrations of catalyst P and substrate A, respectively (see ESI
†).
Table 1 contains descriptions of the individual zones shown in
Fig. 1. These zones have been described more thoroughly in a recent article.
5
Table 1 Summary of EC′ zones and waveforms
| Zone |
Waveform |
Description |
| EC′ Zone Diagram abbreviations: D, diffusion; G, general; K, kinetic; S, sigmoidal or special; T, total. Abbreviations used in other zone diagrams: E, extraordinary; P, pure; O, ordinary. |
| D |

|
No catalysis |
| K |

|
Substrate is depleted near the electrode |
| KS |

|
Substrate not depleted at electrode; forward/reverse traces overlay |
| KD |

|
Substrate concentration is not depleted; ‘S’ shape not observed due to reduced kinetic parameter (λ) |
| KG |

|
Substrate near electrode is consumed; kinetic parameter small |
| KG* |

|
See KG description |
| KT2 |

|
All substrate is consumed by a small amount of active catalyst |
| KT1 |
— |
See KT2; catalytic wave and redox wave overlap |
Equations are available for the extraction of ke for a catalyst/substrate system if the catalyst exhibits waveforms matching zones KT2, KS, or KD.5 Consequently, a primary utility of the homogeneous electrocatalytic EC′ Zone Diagram is to determine which zone the experimentally observed cyclic voltammogram most closely resembles and so identify how tuning the kinetic (λ) and excess (γ) parameters can permit access to zones KT2, KS, or KD.2,5,6 The compass rose in Fig. 1 describes how parameters (catalyst and substrate concentrations, scan rate, and the rate constant of electron transfer as modified by changing the substrate or catalyst) may be changed to permit access to zones KT2, KS, or KD so that kinetic information may be extracted. This is useful for quantifying and comparing catalysts.
Typically, modifications of substrate concentration (which affects γ) and scan rate (which influences λ) are used experimentally to move from zone K to zone KS.13,14
Catalytic mechanism for Co(dmgBF2)2(CH3CN)2
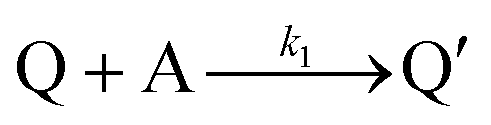
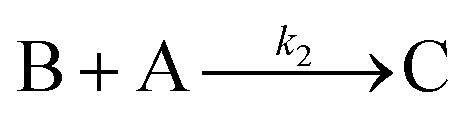
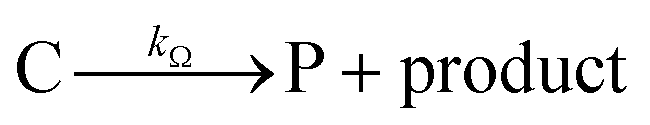
Cobaloximes have been established as molecular catalysts for the electrochemical reduction of acids to dihydrogen in both aqueous and non-aqueous solutions.15–24 Recently, the reaction pathway for the Co(dmgBF2)2(CH3CN)2-mediated production of hydrogen from para-substituted aniliniums in acetonitrile was elucidated through detailed electrochemical analysis,6 complementing previous spectroscopic and theoretical investigations of the operating mechanisms under a range of conditions.15–17,24–29 This work established an ECEC′ reaction pathway in which the CoII species (1) is initially reduced to form a CoI complex (1−) that undergoes protonation to form a CoI(H+) intermediate (1−(H+)). This protonation step is not rate-limiting and the rate constants (k1) for this chemical step exhibit a linear free energy relationship with acid pKa (pKa = 11.86–7.0; k1 = 3.06 × 10⁴–2.73 × 10⁸ M−1 s−1). This reduced and protonated species is assigned as a cobalt(III)-hydride, though it may tautomerize to a CoI species with a protonated ligand.30–32 This intermediate is subsequently reduced to form 12−(H+). A second protonation to form 12−(H+)2 (CoII(H2)) is described by a pKa-dependent rate constant k2; k2 is ca. 3 orders of magnitude smaller than k1 for the same acid (k2 = 3.39 × 101–2.04 × 10⁵ M−1 s−1) and is the rate-limiting step under most conditions (kobs = k2). 12−(H+)2 subsequently reacts via an acid-independent step to close the catalytic cycle (kΩ = 125 s−1); this final step likely involves H–H bond formation or H2 release. At high substrate concentrations, this acid concentration- and pKa-independent step becomes rate limiting (kobs = kΩ).
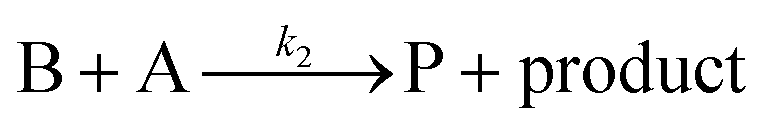
This ECEC′ reaction mechanism of Co(dmgBF2)2(CH3CN)2 can be summarized generically by eqn (5)–(9), where P = 1; Q = 1−; A = H+ source. Another general ECEC′ process is described by eqn (5)–(7) and (10).
| |  | (6) |
| |  | (8) |
| |  | (9) |
or
| |  | (10) |
Results and discussion
Extension to multi-electron, multi-substrate reactions
Quantitative extension of the classic EC′ Zone Diagram to a multi-electron, multi-substrate reaction requires consideration of the kinetics and reversibility of individual elementary steps. However, qualitative extension to a complex mechanism is far more accessible than generating new diagrams that require a large number of mechanism-specific parameters. We find that each zone from the classic EC′ system has qualitative parallels for the more complex ECEC′ reaction. Notably, two factors most clearly complicate this extension: (1) the production of reaction intermediates that are electrochemically active, and (2) multiple elementary step rate constants that need to be simplified to a single observed rate constant, kobs, which may not be constant across all limiting conditions. These two factors generate situations that cannot be described by the classic EC′ Zone Diagram (Fig. 1).
One deviation observed for the ECEC′ reaction studied in this work is the oxidation of an ECE intermediate on the return trace, under certain conditions.6 This occurs when the first elementary chemical step (k1) in the mechanism is fast relative to subsequent steps. Under such conditions, the reduced catalyst Q is consumed upon reaction with substrate A to form Q′. It is then subsequently reduced to B, but the catalyst is unable to turnover via further reaction with A on the electrochemical timescale. As a result, oxidation of B and Q′ are observed on the anodic scan. This is illustrated in our study for solutions containing 1 and three different acids (Fig. 2). In the presence of 4-methoxyanilinium (pKa = 11.86), a broad oxidation is apparent at 100 mV s−1 on the reverse scan. Faster scan rates resolved the oxidation into two more clearly defined features (Fig. 2A). The more negative feature (Ep,a ≈ −0.87 V) is assigned to the oxidation of 1−, while the feature at more positive potentials (Ep,a ≈ −0.70 V for υ = 600 mV s−1) is assigned to the oxidation of 12−(H+). With stronger acids, the intensity of this more positive feature decreases, even at faster scan rates (Fig. 2B and C).6 For these stronger acids, k2 is larger, increasing catalytic turnover and subsequently decreasing the concentration of available 12−(H+) for reoxidation. We anticipate such features will be observed generally for systems with small C0A, small k2, and large υ.
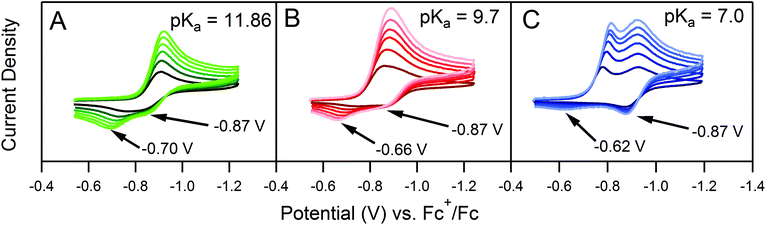 |
| | Fig. 2 Three sets of cyclic voltammograms recorded from solutions containing 0.5 mM 1 and 0.5 mM (A) 4-methoxyanilinium, (B) 4-chloroanilinium, (C) 4-cyanoanilinium. Each set of data consists of six voltammograms recorded at 100, 200, 300, 400, 500, and 600 mV s−1. All voltammograms recorded in a 250 mM [Bu4N][PF6] CH3CN solution. | |
The landscape of our multi-electron, multi-substrate zone diagram also deviates from the classical EC′ Zone Diagram. For more complex systems, the kinetic parameter is no longer controlled by a single rate constant but instead by an observed rate constant. As such, it is possible to “jump” across zones in the diagram when conditions vary the identity of the rate limiting step. Modifying parameters such as substrate concentration are one means of controlling the rate limiting step. We demonstrate one such example in Fig. 3 for 1. As the concentration of 4-trifluoromethylanilinium is increased, the waveform changes from the KT2 zone to the KS zone. In the standard EC′ Zone Diagram, changes in C0A lead to a horizontal translation through the electrochemical zones. In the EC′ Zone Diagram, however, there is no single y-value (λ) that intercepts zones KT2, KT1, K and KS. For this example of an ECEC′ mechanism, this observation is rationalized as a change of the rate limiting step from a process that is first order in acid to one that is zero-order in acid.6
 |
| | Fig. 3 Cyclic voltammograms of a 0.5 mM solution of 1 with (A) 0 mM; (B) 0.5 mM; (C) 8.0 mM; (D) 15 mM; (E) 60 mM 4-trifluoromethylanilinium. All voltammograms recorded at 100 mV s−1 in 250 mM [Bu4N][PF6] CH3CN solution. | |
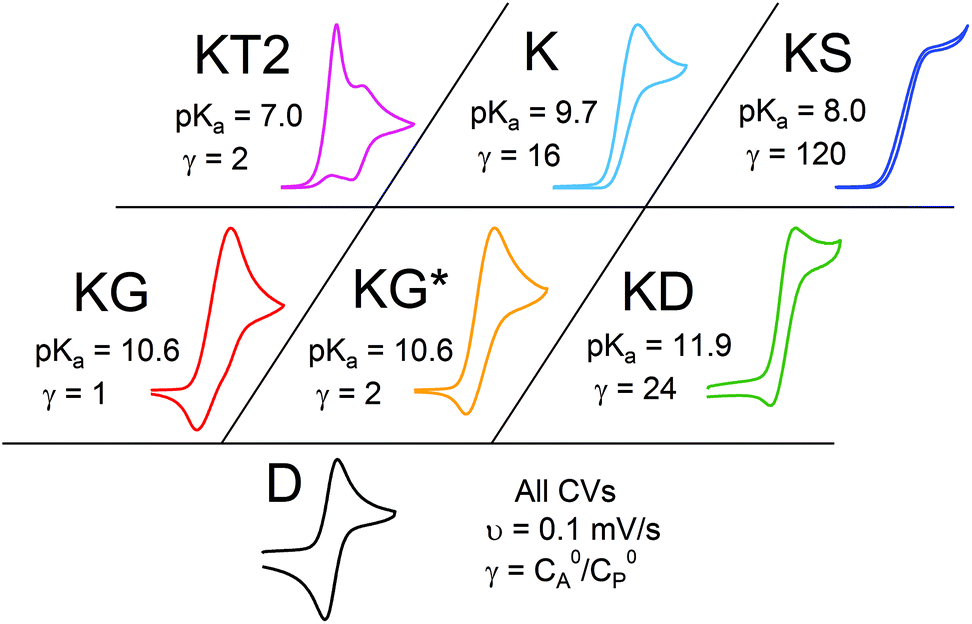
Even given the complications outlined above, the qualitative assessment of voltammetric responses remains fairly constant between EC′ and our ECEC′ mechanism. As illustrated in Fig. 4 and discussed below, voltammograms qualitatively consistent with all nine zones can be accessed for 1 through systematic tuning of the kinetic and excess factors.
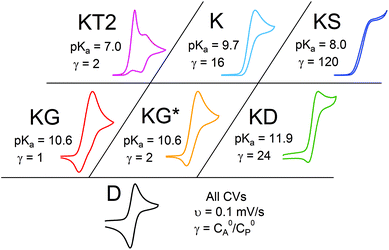 |
| | Fig. 4 The generic zone diagram constructed for the hydrogen evolving electrocatalyst, 1. pKa values of acids employed and γ values as denoted. (KT2) The total catalysis zone is of 2.5 mM 1 and 5.0 mM 4-cyanoanilinium at 100 mV s−1; (K) the pure kinetic conditions and substrate consumption zone is of 0.5 mM 1 and 8.0 mM 4-chloroanilinium at 100 mV s−1; (KS) the pure kinetic conditions and no substrate consumption zone is of 0.5 mM 1 and 60 mM 4-trifluoromethylanilinium at 100 mV s−1; (KG) the substrate consumption zone is of 5.0 mM 1 and 5.0 mM anilinium at 100 mV s−1; (KG*) the substrate consumption zone is of 2.5 mM 1 and 5.0 mM anilinium at 100 mV s−1; (KD) the no substrate consumption zone is of 0.5 mM 1 and 12 mM 4-methoxyanilinium at 100 mV s−1; (D) no catalysis is of 0.5 mM 1. | |
Varying λ to traverse the zone diagram
The accessible scope of the kinetic parameter λ is generally limited by the value of ke (kobs for ECEC′), an inherent property of the system. However, as previously demonstrated,6 the rate constant for both the first and the second proton transfer for the production of H2 by 1 in CH3CN can be tuned over three orders of magnitude by using different proton sources. Holding the proton source constant, variation of υ further reveals the extent to which λ controls waveforms of ECEC′ systems. The influence of C0P, which dictates both λ and γ, is discussed in a separate section (see below).
Varying kobs (λ ∝ kobs).
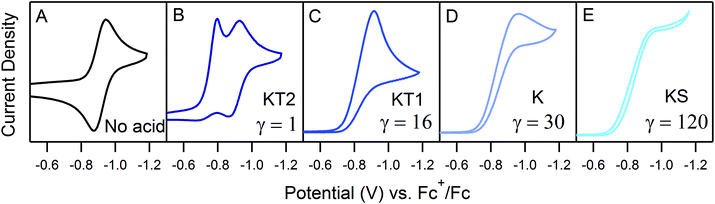
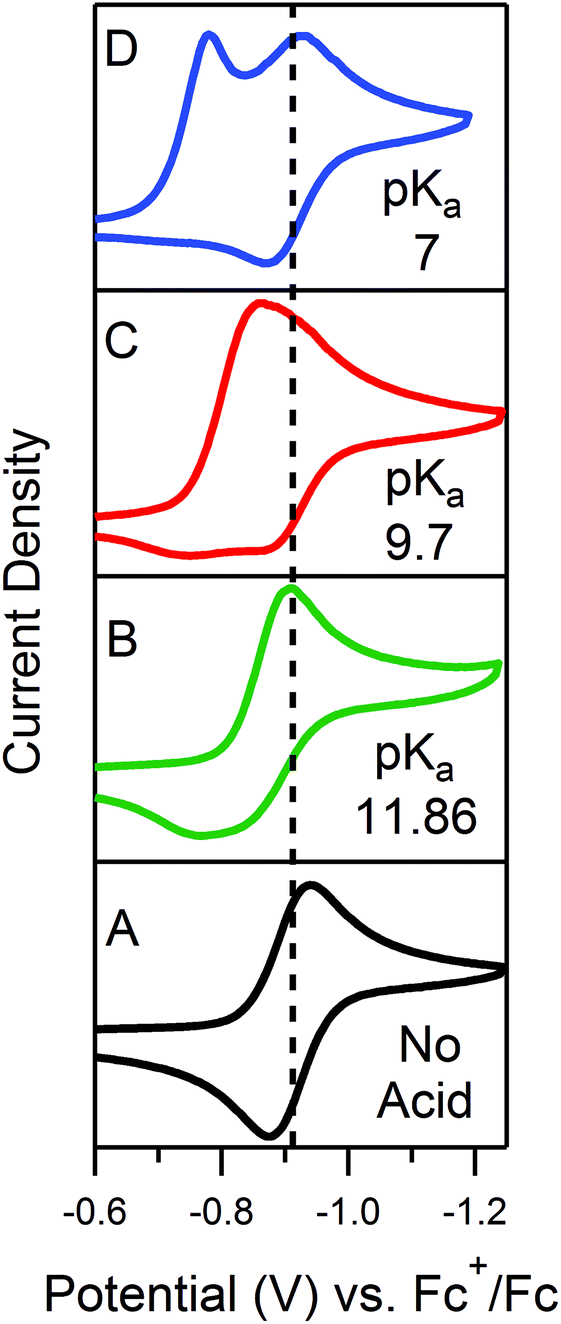
In order to traverse λ as a function of kobs, CVs were first recorded for solutions of 0.5 mM 1 with one equivalent (γ = 1) of various para-substituted aniliniums spanning ca. 5 pKa units. As anticipated, pKa-dependent CV features were observed across the series of acids employed (Fig. 5). Upon addition of weaker acids, including 4-methoxyanilinium (pKa = 11.86), 4-tert-butylanilinium (pKa = 11.1), and anilinium (pKa = 10.62), the voltammograms produced were qualitatively similar to the KG and KG* zones (Fig. 5 and S1, ESI†). In the KG and KG* zones, slow reaction kinetics (small kobsC0A) within the reaction layer results in a peak-like catalytic wave with build-up of singly reduced catalyst, 1−.5 On the anodic scan, the oxidation of excess 1− is observed; however, the 1− → 1 redox feature is significantly broader than observed for a generic KG/KG* waveform. As previously discussed, we attribute this to a second, overlapping oxidation feature assigned to the oxidation of unreacted singly-reduced, singly-protonated catalyst 1−(H+). Observation of unreacted 1−(H+) is not surprising, as k1 ≫ k2 for such aniliniums.6 Under these conditions, kobs is slow enough such that, at low acid concentrations, turnover is expected to occur at a rate <0.2 s−1 (see ESI†).
 |
| | Fig. 5 CVs of 0.5 mM 1 in the presence of 0.5 mM of the respective anilinium derivative. (A) No acid; (B) 4-methoxyanilinium; (C) 4-chloroanilinium; (D) 4-cyanoanilinium. All voltammograms recorded at 100 mV s−1 in a 250 mM [Bu4N][PF6] CH3CN solution. | |
When the acid strength is increased, kobs increases and the zone diagram is traversed vertically. The resulting waveforms move, as predicted, from zone KG/KG* to KT2. For 4-chloroanilinium (pKa = 9.7) and 4-trifluoromethoxyanilinium (pKa = 9.28), the voltammograms are not consistent with any one region of the Zone Diagram, but instead have characteristics indicative of both KG/KG* and KT2. With the three strongest acids explored—4-(methylbenzoic)anilinium (pKa = 8.62), 4-trifluoromethylanilinium (pKa = 8.03), and 4-cyanoanilinium (pKa = 7)—the voltammograms recorded match the total catalysis (KT2) zone (Fig. 5 and ESI†). In zone KT2, the small amount of catalyst initially reduced at potentials positive of  (as governed by the Nernst equation) is sufficient to consume all substrate local to the electrode.5 Under such conditions, a two-peaked voltammogram is observed (Fig. 1 and 4). The first redox feature corresponds to catalysis while the second feature corresponds to the reversible redox wave of the catalyst in the absence of substrate (Table 1).
Varying υ (λ ∝ υ−1).
For the reaction of 4-trifluoromethoxyanilinium and 1, υ can be used to tune between zone KT2 and zone KG. The voltammograms for this acid recorded at 100 mV s−1 do not clearly fit any one zone. However, when the scan rate is decreased (υ = 25 mV s−1), the waveform conforms to KT2, as evidenced by the diagnostic, two-peaked voltammogram. In contrast, at faster scan rates (υ = 600 mV s−1), the voltammogram loses the distinguishable features of KT2 and appears similar to zones KG or KG* (Fig. 6). In the presence of the weaker and stronger acids, the waveforms never exited KG/KG* or KT2, respectively, across the range of scan rates explored for γ = 1 (Fig. S2, ESI†).
 |
| | Fig. 6 CVs of a solution of 0.5 mM 1 and 0.5 mM 4-trifluoromethoxyanilinium (pKa = 9.28) produced at different scan rates, as denoted. All voltammograms recorded in a 250 mM [Bu4N][PF6] CH3CN solution. | |
Varying γ to traverse the zone diagram
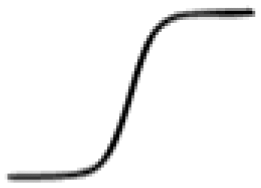
The only γ-exclusive variable is C0A, the bulk substrate concentration, which controls the position along the x-axis of the EC′ Zone Diagram. Acid titrations for 4-methoxyanilinium (pKa = 11.86), 4-trifluoromethoxyanilinium (pKa = 9.28), and 4-trifluoromethylanilinium (pKa = 8.03, see above) were performed to explore the extent to which C0A, offers access to different waveforms. For 4-methoxyanilinium, the observed waveform traverses from D (no catalysis) to KG/KG*, KD, and finally to KS as C0A, is increased from 0 to 37 mM (Fig. S3, ESI†).5 The negligible substrate consumption for zone KD is much like the idealized S-shaped voltammograms of the zone KS; however, unlike KS, the rate of catalysis is slower. This leads to a hybrid peak–plateau shape; the voltammogram initially peaks as the oxidized catalyst is depleted within the reaction layer, then plateaus at more negative potentials as the current is controlled by the catalytic reaction. The presence of unreacted 1− results in an oxidation feature observed on the anodic trace. Adding additional substrate further increases γ and drives the waveform to KS.
Similar voltammetric responses are observed with titrations of 4-trifluoromethoxyanilinium. As previously noted, the voltammetric assignment lies between KG/KG* and KT2 at γ = 1. As C0A is increased, the waveform enters zone K and then zone KS (Fig. S4, ESI†). Catalysis in zone K is dictated by substrate consumption, whereby a peak-shaped catalytic response is controlled by diffusion of substrate into the reaction layer.5 As γ is further raised by an increase in C0A, the catalytic current plateaus and becomes scan-rate independent, indicative of zone KS.6
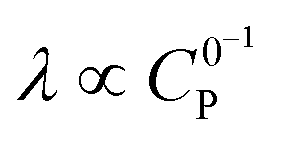
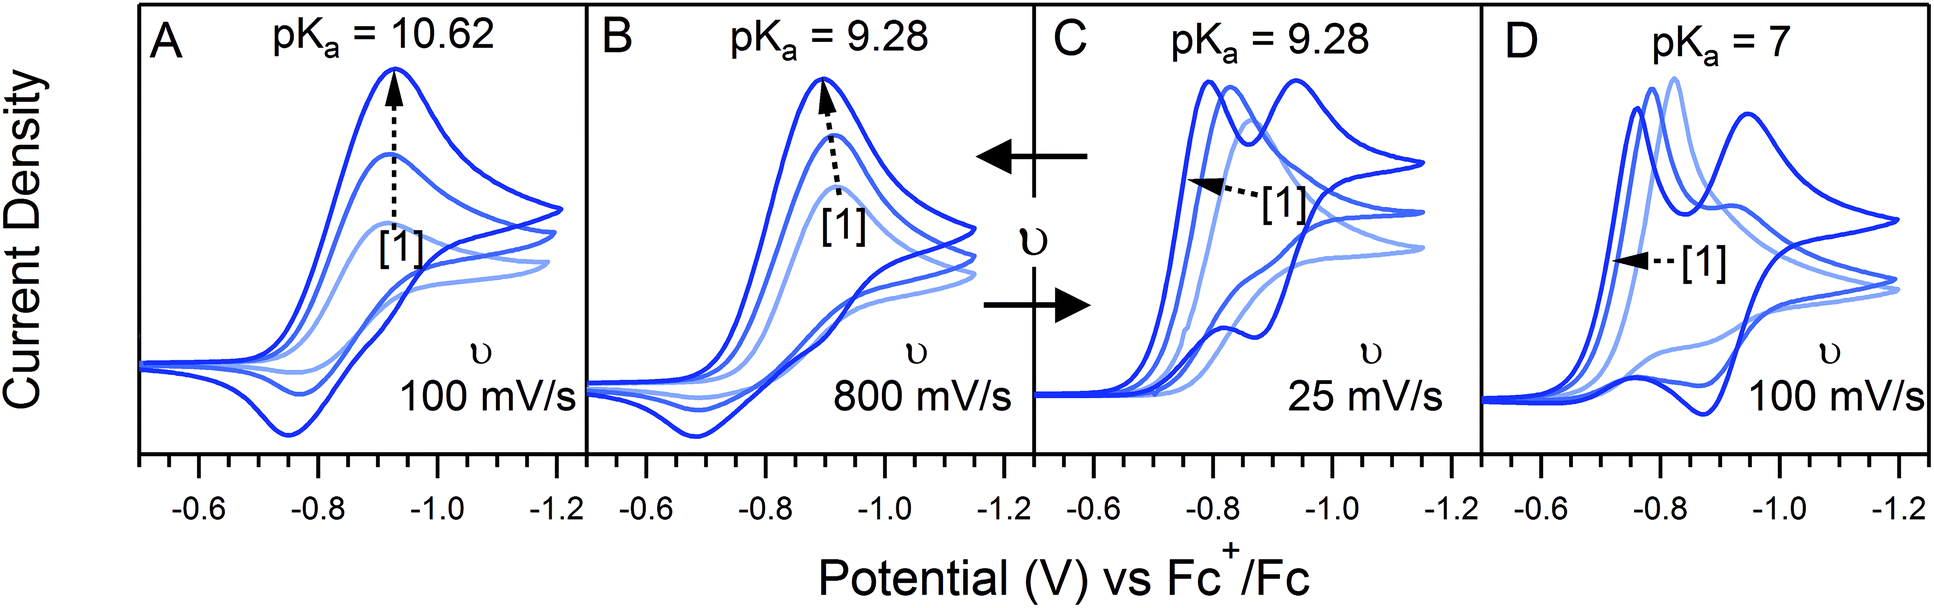
Varying C0P (λ ∝ C0P,  )
)
C
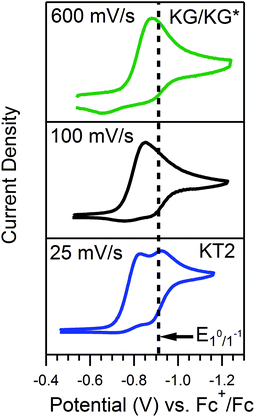
0P affects both λ and γ, uniquely making it the only variable that can be used to traverse the EC′ Zone Diagram along the diagonal. In our studies of 1, C0P only affected zone assignments for solutions containing stronger acids (pKa < ca. 10) under the conditions explored (Fig. 7). For 4-cyanoanilinium, γ altered the waveform classification – when γ = 1, CVs are consistent with KT2; when γ = 4 the voltammogram shape is more similar to KT1. The KT1 zone differs from KT2 by the magnitude of the catalytic wave; specifically, in zone KT1 the catalytic wave obscures the reversible couple, yet the catalytic wave is controlled by substrate diffusion. For the weaker acid 4-trifluoromethoxyanilinium, the influence of C0P depended on the scan rate. At 800 mV s−1, the voltammograms fit the KG/KG* zones (γ = 1, 2, and 4). In contrast, at 25 mV s−1, the waveform is assigned as KT2 or KT1, as dictated by γ (Fig. 7). Solutions that contained anilinium did not produce voltammetric responses beyond the KG/KG* zone for the C0P concentrations studied (Fig. 7).
 |
| | Fig. 7 Four sets of voltammmograms produced using 1.25, 2.5, and 5.0 mM 1 (increasing concentration with the direction of the dashed arrow). Voltammograms were recorded with (A) 5.0 mM anilinium (pKa = 10.62) at 100 mV s−1; (B) 5.0 mM 4-trifluoromethoxyanilinium (pKa = 9.28) at 800 mV s−1; (C) 5.0 mM 4-trifluoromethoxyanilinium at 25 mV s−1; (D) 5.0 mM 4-cyanoanilinium (pKa = 7.0) at 100 mV s−1. All voltammograms recorded in a 250 mM [Bu4N][PF6] CH3CN solution. | |
Conclusions
By varying υ, C0A, and C0P in a range of solutions containing the catalyst 1 and acids of different pKa values, cyclic voltammograms qualitatively corresponding to the EC′ Zone Diagram were accessed. This work demonstrates for a molecular catalyst that facilitates multi-electron, multi-substrate electrochemical reactions, systematic tuning of the kinetic (λ) and excess (γ) parameters can permit access to zones KT2, KS, or KD. For both EC′ and ECEC′ reaction mechanisms, kinetic information can be extracted from waveforms that conform to these zones.2,4–6 In particular, such zones permit access to quantitative kinetic information about elementary reaction steps within particular mechanisms. Having such a quantitative handle on individual elementary steps is a powerful metric for comparing molecular catalysts for fuel production.
Experimental section
General considerations
All reactions were performed in a nitrogen-filled glovebox or on a high-vacuum manifold. Solvents were degassed with argon and passed through an alumina column using a Pure Processes Technology Solvent system before being stored over molecular sieves under N2. Milli-Q water was used for electrode polishing. Tetrabutylammonium hexafluorophosphate (TCI, >98%) was recrystallized from hot EtOH, washed with ethanol, and dried at 80 °C under vacuum for 8 hours.
Co(dmgBF2)2(H2O)2 (1) was prepared according to literature methods.33 4-Methoxyanilinium tetrafluoroborate, 4-tert-butylanilinium tetrafluoroborate, anilinium tetrafluoroborate, 4-chloroanilinium tetrafluoroborate, 4-trifluoromethoxyanilinium tetrafluoroborate, 4-(methylbenzoate)anilinium tetrafluoroborate, 4-trifluoromethylanilinium tetrafluoroborate and 4-cyanoanilinium tetrafluoroborate were prepared as reported.6,34
Electrochemical methods
All electrochemical measurements were performed in a N2-filled glovebox using leads fed through a custom port and connected to a Pine Instruments WaveDriver potentiostat. All experiments used glassy carbon working and reference electrodes (CH Instruments, 3 mm diameter) and a silver wire pseudo-reference electrode. The pseudo-reference silver electrode was immersed in tube filled with a 0.25 M [Bu4N][PF6] acetonitrile solution and capped with a porous Vycor tip. The working electrodes were polished with a Milli-Q water slurry of 0.05 micron polishing powder (CH instruments, containing no agglomerating agents), rinsed and sonicated with Milli-Q water and finally rinsed with acetone. Each working electrode was then electrochemically pretreated using two cyclic scans between approximately 0.7 and −2.8 V at 300 mV s−1 in a 250 mV s−1 [Bu4N][PF6] acetonitrile solution. Electrolyte-only backgrounds were produced for each electrode at appropriate scan rates. All experiments were performed in a 0.25 mM [Bu4N][PF6] acetonitrile solution and were referenced to ferrocene. Voltammograms were recorded at room temperature (298 K). Each scan was recorded with a clean, pretreated working electrode and the solution was stirred between scans.
Acknowledgements
We acknowledge the University of North Carolina at Chapel Hill for support of this work. D. J. M acknowledges support from the North Carolina American Chemical Society for the Howie James Undergraduate Research Scholarship, B. D. M. acknowledges the Department of Energy Office of Science Graduate Fellowship Program (DOE SCGF), made possible by the American Recovery and Reinvestment Act of 2009, administered by ORISE-ORAU under contract no. DE-AC05-06OR23100, and J. L. D. acknowledges a Packard Fellowship for Science and Engineering. We thank Prof. Cyrille Costentin for helpful discussions.
References
- J.-M. Savéant and K. B. Su, J. Electroanal. Chem., 1984, 171, 341–349 CrossRef.
- C. Costentin and J.-M. Savéant, ChemElectroChem, 2014, 1, 1226–1236 CrossRef CAS.
- J.-M. Savéant, Chem. Rev., 2008, 108, 2348–2378 CrossRef PubMed.
-
J.-M. Savéant, Elements of Molecular and Biomolecular Electrochemistry, John Wiley & Sons, Inc., Hoboken, 2006 Search PubMed.
- E. S. Rountree, B. D. McCarthy, T. T. Eisenhart and J. L. Dempsey, Inorg. Chem., 2014, 53, 9983–10002 CrossRef CAS PubMed.
-
D. J. Martin, E. S. Rountree, B. D. McCarthy and J. L. Dempsey, 2016, Submitted.
- E. S. Rountree and J. L. Dempsey, J. Am. Chem. Soc., 2015, 137, 13371–13380 CrossRef CAS PubMed.
- E. S. Wiedner, H. J. S. Brown and M. L. Helm, J. Am. Chem. Soc., 2016, 138, 604–616 CrossRef CAS PubMed.
- N. Elgrishi, M. B. Chambers and M. Fontecave, Chem. Sci., 2015, 6, 2522–2531 RSC.
- C. Costentin, G. Passard, M. Robert and J.-M. Savéant, Proc. Natl. Acad. Sci. U. S. A., 2014, 111, 14990–14994 CrossRef CAS PubMed.
- C. Costentin, S. Drouet, M. Robert and J.-M. Savéant, Science, 2012, 338, 90–94 CrossRef CAS PubMed.
- C. Costentin, G. Passard, M. Robert and J.-M. Savéant, J. Am. Chem. Soc., 2014, 136, 11821–11829 CrossRef CAS PubMed.
- M. P. Stewart, M.-H. Ho, S. Wiese, M. Lou Lindstrom, C. E. Thogerson, S. Raugei, R. M. Bullock and M. L. Helm, J. Am. Chem. Soc., 2013, 135, 6033–6046 CrossRef CAS PubMed.
- M. L. Helm, M. P. Stewart, R. M. Bullock, M. R. DuBois and D. L. DuBois, Science, 2011, 333, 863–866 CrossRef CAS PubMed.
- X. Hu, B. M. Cossairt, B. S. Brunschwig, N. S. Lewis and J. C. Peters, Chem. Commun., 2005, 4723–4725 RSC.
- X. Hu, B. S. Brunschwig and J. C. Peters, J. Am. Chem. Soc., 2007, 129, 8988–8998 CrossRef CAS PubMed.
- M. Razavet, V. Artero and M. Fontecave, Inorg. Chem., 2005, 44, 4786–4795 CrossRef CAS PubMed.
- C. Baffert, V. Artero and M. Fontecave, Inorg. Chem., 2007, 46, 1817–1824 CrossRef CAS PubMed.
- C. N. Valdez, J. L. Dempsey, B. S. Brunschwig, J. R. Winkler and H. B. Gray, Proc. Natl. Acad. Sci. U. S. A., 2012, 109, 15589–15593 CrossRef CAS PubMed.
- S. M. Laga, J. D. Blakemore, L. M. Henling, B. S. Brunschwig and H. B. Gray, Inorg. Chem., 2014, 53, 12668–12670 CrossRef CAS PubMed.
- E. S. Andreiadis, P.-A. Jacques, P. D. Tran, A. Leyris, M. Chavarot-Kerlidou, B. Jousselme, M. Matheron, J. Pécaut, S. Palacin, M. Fontecave and V. Artero, Nat. Chem., 2012, 5, 48–53 CrossRef PubMed.
- N. M. Muresan, J. Willkomm, D. Mersch, Y. Vaynzof and E. Reisner, Angew. Chem., Int. Ed., 2012, 51, 12749–12753 CrossRef CAS PubMed.
- C. C. L. McCrory, C. Uyeda and J. C. Peters, J. Am. Chem. Soc., 2012, 134, 3164–3170 CrossRef CAS PubMed.
- J. L. Dempsey, B. S. Brunschwig, J. R. Winkler and H. B. Gray, Acc. Chem. Res., 2009, 42, 1995–2004 CrossRef CAS PubMed.
- B. H. Solis and S. Hammes-Schiffer, Inorg. Chem., 2011, 50, 11252–11262 CrossRef CAS PubMed.
- J. L. Dempsey, J. R. Winkler and H. B. Gray, J. Am. Chem. Soc., 2010, 132, 16774–16776 CrossRef CAS PubMed.
- J. L. Dempsey, J. R. Winkler and H. B. Gray, J. Am. Chem. Soc., 2010, 132, 1060–1065 CrossRef CAS PubMed.
- J. T. Muckerman and E. Fujita, Chem. Commun., 2011, 47, 12456–12458 RSC.
- P. Connolly and J. H. Espenson, Inorg. Chem., 1986, 25, 2684–2688 CrossRef CAS.
- D. C. Lacy, G. M. Roberts and J. C. Peters, J. Am. Chem. Soc., 2015, 137, 4860–4864 CrossRef CAS PubMed.
- D. P. Estes, D. C. Grills and J. R. Norton, J. Am. Chem. Soc., 2014, 136, 17362–17365 CrossRef CAS PubMed.
- G. Li, A. Han, M. E. Pulling, D. P. Estes and J. R. Norton, J. Am. Chem. Soc., 2012, 134, 14662–14665 CrossRef CAS PubMed.
- A. Bakac and J. H. Espenson, J. Am. Chem. Soc., 1984, 106, 5197–5202 CrossRef CAS.
- B. D. McCarthy, D. J. Martin, E. S. Rountree, A. C. Ullman and J. L. Dempsey, Inorg. Chem., 2014, 53, 8350–8361 CrossRef CAS PubMed.
Footnote |
| † Electronic supplementary information (ESI) available: Additional cyclic voltammograms, pKa values. See DOI: 10.1039/C6DT00302H |
|
| This journal is © The Royal Society of Chemistry 2016 |
Click here to see how this site uses Cookies. View our privacy policy here. 
 Open Access Article
 This Open Access Article is licensed under a
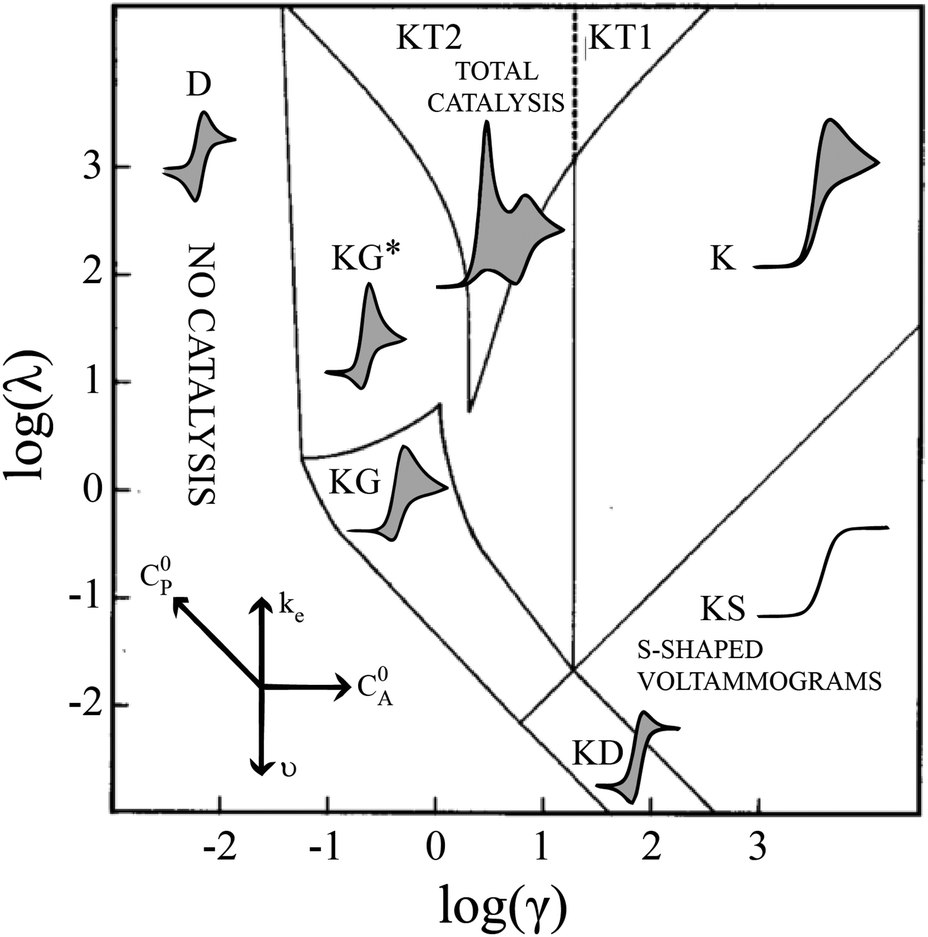


 (as governed by the Nernst equation) is sufficient to consume all substrate local to the electrode.5 Under such conditions, a two-peaked voltammogram is observed (Fig. 1 and 4). The first redox feature corresponds to catalysis while the second feature corresponds to the reversible redox wave of the catalyst in the absence of substrate (Table 1).