 Open Access Article
Hydroxypyridinones with enhanced iron chelating properties. Synthesis, characterization and in vivo tests of 5-hydroxy-2-(hydroxymethyl)pyridine-4(1H)-one†
J. I.
Lachowicz
*a,
V. M.
Nurchi
a,
G.
Crisponi
a,
M. G.
Jaraquemada-Pelaez
a,
M.
Arca
a,
A.
Pintus
a,
M. A.
Santos
b,
C.
Quintanova
b,
L.
Gano
c,
Z.
Szewczuk
d,
M. A.
Zoroddu
e,
M.
Peana
e,
A.
Domínguez-Martín
f and
D.
Choquesillo-Lazarte
g
aDepartment of Chemical and Geological Science, University of Cagliari, Cittadella Universitaria, 09042 Monserrato-Cagliari, Italy. E-mail: lachowicz@unica.it; Fax: +39 070 6754478; Tel: +39 070 6754471
bCentro Quimica Estrutural, Instituto Superior Tecnico, Universidade de Lisboa, Av. Rovisco Pais, 1049-001 Lisboa, Portugal
cCampus Tecnológico e Nuclear, Instituto Superior Técnico, Universidade de Lisboa, Estrada Nacional 10, 2695-066 Bobadela LRS, Portugal
dFaculty of Chemistry, University of Wroclaw, F. Joliot-Curie 14, 50-383 Wroclaw, Poland
eDipartimento di Chimica e Farmacia, Università di Sassari, Via Vienna 2, 07100 Sassari, Italy
fDepartment of Inorganic Chemistry, Faculty of Pharmacy, Campus Cartuja, University of Granada, E-18071, Granada, Spain
gLaboratorio de Estudios Cristalográficos, IACT, CSIC-Universidad de Granada, Av. de las Palmeras 4, E-18100, Armilla, Granada, Spain
First published on 23rd February 2016
Abstract
The synthesis of 5-hydroxy-2-(hydroxymethyl)pyridin-4(1H)-one (P1) is presented, together with the evaluation of its coordination ability towards Fe3+, studied by a combination of chemical, computational, and animal approaches. The use of complementary analytical techniques has allowed us to give evidence of the tautomeric changes of P1 as a function of pH, and to determine their influence on the coordinating ability of P1 towards Fe3+. The pFe3+ value 22.0 of P1–iron complexes is noticeably higher than that of deferiprone (20.6), one of the three clinical chelating agents in therapeutic use for iron overload diseases. This is due on one side to the tautomeric change to the catechol form, and on the other to the lower protonation constant of the OH group. Bio-distribution studies on mice allowed us to confirm in vivo the efficacy of P1. Furthermore the coordinating ability toward Al3+, Cu2+ and Zn2+ has been studied to evaluate the possible use of P1 against a second toxic metal ion (Al3+), and to envisage its potential influence on the homeostatic equilibria of essential metal ions. The chelating ability of P1 toward these ions, not higher than that of the corresponding deferiprone, contributes to render P1 a more selective iron chelator.
Introduction
Hydroxypyridinone ligands have been extensively studied as candidates for orally active iron chelators since the 1980s. The European Union approved 3-hydroxy-1,2-dimethylpyridin-4(1H)-one (deferiprone, DFP) (Scheme 1) as a clinical chelating agent for iron overload diseases in 2000. A major drawback of DFP is that it undergoes extensive metabolism in the liver. 3-Hydroxy functionality, crucial for iron scavenging, is the prime target of this metabolism. Urinary recovery studies in rats and humans showed that >44% and >85% of the administered dose is recovered as the non-chelating 3-O-glucuronide conjugate respectively.1 This extensive biotransformation limits the ability of DFP to mobilize the excess of iron in thalassemic patients. Hydroxypyridinones share common features with catechols and hydroxamic acids.2,3 The zwitterionic aromatic resonance form of deprotonated hydroxypyridinones is isoelectronic with the catecholate dianion.4 This family of ligands, encompassing three subfamilies, 1-hydroxy-2(1H)-pyridinone (1,2-hopo), 3-hydroxy-2(1H)-pyridinone (3,2-hopo) and 3-hydroxy-4(1H)-pyridinone (3,4-hopo) (Scheme 1), form five-member chelate rings in which the metal ion is bound by two oxygen atoms.4There are more than 4968 publications related to DFP in the literature (SciFinder 21st December 2015). Different DFP derivatives have been synthesized and characterized, the majority of which involve substitutions in positions 1 and 2 with aliphatic and aromatic groups aimed at improving the chelating properties, changing the lipophilicity and the solubility, or gaining additional properties such as fluorescence. 1′-Hydroxyalkyl substituents in position 2 lead to a reduction of protonation and iron complex formation constants, as compared to those of simple alkyl-substituted hopos. This results from the combined effect of intramolecular hydrogen bonding, between the 2-(1′-hydroxyl) group and the adjacent 3-hydroxyl function, and also the negative inductive effect of the 2-(1′-hydroxyl) group from the pyridinone ring, stabilizing the ionized species. Although such an effect reduces the overall stability constants for Fe3+, it also reduces the proton affinity of the chelating functions. These changes result in an increase in the corresponding pFe3+ values at pH 7.4. Conversely, the introduction of a hydroxyl function in position 2 does not induce similar effects, and instead results in a decrease in lipophilicity as compared to the simple alkyl derivatives.1 An additional increment is also observed with 6-alkyl substitution.1 Generally, N-alkylation of 3,4-hopos results in little change in the affinity for protons as well as for Fe3+.5,6 Surprisingly, only a few derivatives with hydrogen in position 1 are known; 5-hydroxy-2-(hydroxymethyl)pyridin-4(1H)-one, with its tautomeric forms, has been studied by computational methods, but not accompanied by experimental studies.7 Although different authors have debated about the tautomeric equilibrium of the free DFP ligand and its derivatives, no tautomeric equilibria in the corresponding metal complexes have been experimentally proven.
Tautomers are usually characterized by different hydrophobicities, pK values and structures, and therefore different coordination abilities. In this respect, the influence of the medium polarity may be highly significant since a biological system involves either an aqueous medium (blood or plasma), or an essentially non-protic medium such as a cell membrane or even an enzymatic reaction centre.8 Based on these concerns, we considered that metal coordination may be improved in 3,4-hopo with a N–H group in position 1, and hence in this work we present a study on the coordination ability of 5-hydroxy-2-(hydroxymethyl)pyridin-4(1H)-one (P1) (Scheme 1) towards Fe3+ by combining computational, chemical, and biological approaches. The use of complementary analytical techniques has allowed us to give evidence of the tautomeric changes of P1 as a function of pH, and to determine all of their possible forms and properties. The coordinating ability of P1 towards Fe3+ together with bio-distribution studies on mice to evaluate in vivo its efficacy is also presented. Furthermore the coordinating ability toward Al3+, Cu2+ and Zn2+ has been studied to evaluate the possible use of P1 against a second toxic metal ion (Al3+), and to envisage its potential influence on the homeostatic equilibria of essential metal ions.
Experimental section
Reagents
5-Hydroxy-2-hydroxymethyl-pyran-4-one (kojic acid, KA), ammonia, benzyl chloride, NaOH, KOH, FeCl3, HCl solution, and ethanol were purchased from Aldrich, KCl from Carlo Erba (Milan, Italy), gallium citrate 67Ga from Mallinckrodt Medical B.V and desferal from Biofutura Pharma. All the reagents were used without any further purification. Carbonate-free 0.1 M KOH solution was prepared as previously reported.9 The metal ion standard solutions were prepared by dissolving the required amount of chloride salts in pure double distilled water and adding a stoichiometric amount of HCl to prevent hydrolysis. Fe3+ solution was standardized by spectrophotometric analysis of the Fe3+–desferal complex, while Al3+, Cu2+ and Zn2+ solutions were standardized by EDTA titration.5-Benzyloxy-2-(hydroxymethyl)-4H-pyran-4-one
Sodium hydroxide aqueous solution 11 M (10 mL) was added to 100 mL of a solution of KA (14.2 g, 100 mmol) in MeOH and the mixture was heated under reflux. Benzyl chloride (12.75 mL, 111 mmol) was added drop-wise, and the reaction mixture was refluxed overnight. Once the reaction was complete (checked by TLC; eluent: DCM/MeOH, 1![[thin space (1/6-em)]](https://www.rsc.org/images/entities/char_2009.gif) :
:![[thin space (1/6-em)]](https://www.rsc.org/images/entities/char_2009.gif) 0.75), the mixture was cooled to room temperature. The precipitate was filtered and washed with an ethylic ether/petroleum ether mixture to obtain a light brown solid (18.016 g, 77% yield); m.p. 129–131 °C (lit. value 129–130 °C (ref. 10) and 132 °C (ref. 11)). 1H NMR (300 Hz, MeOD), δ (ppm): 8.01 (s, 1H, 6-HPy), 7.44–7.32 (m, 5H, HPh), 6.51 (s, 1H, 3-HPy), 5.02 (s, 2H, CH2–Bz), 4.41 (s, 2H, CH2–OH).
0.75), the mixture was cooled to room temperature. The precipitate was filtered and washed with an ethylic ether/petroleum ether mixture to obtain a light brown solid (18.016 g, 77% yield); m.p. 129–131 °C (lit. value 129–130 °C (ref. 10) and 132 °C (ref. 11)). 1H NMR (300 Hz, MeOD), δ (ppm): 8.01 (s, 1H, 6-HPy), 7.44–7.32 (m, 5H, HPh), 6.51 (s, 1H, 3-HPy), 5.02 (s, 2H, CH2–Bz), 4.41 (s, 2H, CH2–OH).
5-Benzyloxy-2-(hydroxymethyl)-pyridin-4(1H)-one
5-Benzyloxy-2-(hydroxymethyl)-4H-pyran-4-one (6.25 g, 26.91 mmol) was dissolved in methanol (25 mL) and then 25% ammonia aqueous solution (57.5 mL) was added. The mixture was refluxed in an oil bath for 7 h and the progress of the reaction was monitored by TLC (eluent: DMC/MeOH 6![[thin space (1/6-em)]](https://www.rsc.org/images/entities/char_2009.gif) :
:![[thin space (1/6-em)]](https://www.rsc.org/images/entities/char_2009.gif) 0.75 solvent mixture). The reaction mixture was concentrated in a rotary evaporator to obtain a pale brown solid residue, which was re-crystallized from ethanol/ethyl ether, leaving the pure target compound as a beige coloured product (5.659 g, 90% yield); m.p. 224 °C (lit. value 225–226 °C (ref. 10)). 1H NMR (300 Hz, DMSO), δ (ppm): 11.3 (s, 1H, NH), 7.42–7.30 (m, 5H, HPh), 6.11 (s, 1H, 6-HPy), 5.70 (s, 1H, 3-HPy), 5.00 (s, 2H, CH2–Bz), 4.33 (s, 2H, CH2–OH).
0.75 solvent mixture). The reaction mixture was concentrated in a rotary evaporator to obtain a pale brown solid residue, which was re-crystallized from ethanol/ethyl ether, leaving the pure target compound as a beige coloured product (5.659 g, 90% yield); m.p. 224 °C (lit. value 225–226 °C (ref. 10)). 1H NMR (300 Hz, DMSO), δ (ppm): 11.3 (s, 1H, NH), 7.42–7.30 (m, 5H, HPh), 6.11 (s, 1H, 6-HPy), 5.70 (s, 1H, 3-HPy), 5.00 (s, 2H, CH2–Bz), 4.33 (s, 2H, CH2–OH).
5-Hydroxy-2-(hydroxymethyl)pyridin-4(1H)-one (P1)
5-Benzyloxy-2-(hydroxymethyl)-pyridin-4(1H)-one (2.542 g, 10.99 mmol) was dissolved in methanol (200 mL) and 10% Pd/C (0.258 g) was added. The suspension was stirred for 4 h under a H2 atmosphere (2 bar). Afterwards the mixture was filtered and the solvent evaporated. Final recrystallization from EtOH/Et2O afforded a pale brown coloured pure product (1.065 g, 70% yield); m.p. 245–247 °C. 1H NMR (300 Hz, MeOD), δ (ppm): 7.48 (s, 1H, 6-HPy), 6.44 (1s, 1H, 3-H-Py), 4.55 (s, 2H, CH2–OH). 13C NMR (400 Hz, D2O), δ (ppm): 171.73 (C![[double bond, length as m-dash]](https://www.rsc.org/images/entities/char_e001.gif) O), 147.43 (C–OH), 145.65 (2-C-Py), 121.71 (6-C-Py), 111.09 (3-C-Py), 59.52 (CH2 OH). Elemental analysis (%) calculated for C6H7NO3: C 51.07; H 5.00, N 9.92%; found: C 50.53, H 5.12, N 9.65%.
O), 147.43 (C–OH), 145.65 (2-C-Py), 121.71 (6-C-Py), 111.09 (3-C-Py), 59.52 (CH2 OH). Elemental analysis (%) calculated for C6H7NO3: C 51.07; H 5.00, N 9.92%; found: C 50.53, H 5.12, N 9.65%.
Analysis of the synthesized ligand
Elemental data were obtained using a Fisons EA1108 CHNS/O. NMR spectra were recorded on a Bruker Ascend™ 400 MHz spectrometer. Chemical shifts (δ) were reported in ppm from the internal reference 3-trimethylsilyl-propionic acid-d4 sodium salt (DSS). The melting points were measured on a Leica Galen III hot stage apparatus and are uncorrected.Crystal structure determination
Single crystals of P1 were grown by slow evaporation of a methanol solution (30 mg in 3 mL at 50 °C). A yellowish crystal of P1 was mounted on a glass fibre and used for data collection. Yellowish crystals were prepared under inert conditions immersed in perfluoropolyether as a protecting oil for manipulation. A suitable crystal was mounted on MiTeGen Micromount, and this sample was used for data collection. Crystal data were collected at 100(2) K, using a Bruker D8 Venture diffractometer (Mo K(α) radiation λ = 0.71073 Å). The data were processed with APEX2![[thin space (1/6-em)]](https://www.rsc.org/images/entities/char_2009.gif) 12 and corrected for absorption using SADABS (transmission factors: 0.7456–0.6959).13 The structure was solved by direct methods, which revealed the position of all non-hydrogen atoms.14 These atoms were refined on F2 by a full-matrix least-squares procedure using anisotropic displacement parameters. All hydrogen atoms were located in difference Fourier maps and included as fixed contributions riding on attached atoms with isotropic thermal displacement parameters 1.2 (C–H, N–H) or 1.5 (O–H) times those of the respective atom. The absolute structure for the compound was chosen according to the Flack parameter.15 Criteria of a satisfactory complete analysis were the ratios of “rms” shift to standard deviation less than 0.001 and no significant features in final difference maps. Atomic scattering factors were taken from “International Tables for Crystallography”.16 Molecular graphics were plotted using PLATON17 and Olex2 programs.18 A summary of the crystal data, experimental details and refinement results are listed in Table S1.† Crystallographic data have been deposited with the Cambridge Crystallographic Data Centre, CCDC 1056172 for ligand P1.
12 and corrected for absorption using SADABS (transmission factors: 0.7456–0.6959).13 The structure was solved by direct methods, which revealed the position of all non-hydrogen atoms.14 These atoms were refined on F2 by a full-matrix least-squares procedure using anisotropic displacement parameters. All hydrogen atoms were located in difference Fourier maps and included as fixed contributions riding on attached atoms with isotropic thermal displacement parameters 1.2 (C–H, N–H) or 1.5 (O–H) times those of the respective atom. The absolute structure for the compound was chosen according to the Flack parameter.15 Criteria of a satisfactory complete analysis were the ratios of “rms” shift to standard deviation less than 0.001 and no significant features in final difference maps. Atomic scattering factors were taken from “International Tables for Crystallography”.16 Molecular graphics were plotted using PLATON17 and Olex2 programs.18 A summary of the crystal data, experimental details and refinement results are listed in Table S1.† Crystallographic data have been deposited with the Cambridge Crystallographic Data Centre, CCDC 1056172 for ligand P1.
Potentiometric–spectrophotometric measurements
Protonation and complex-formation equilibria were carried out as previously described, at ionic strength KCl 0.1 M.19 The working ligand concentration was 4.9 × 10⁻⁴ M. Complex formation studies were performed at 1![[thin space (1/6-em)]](https://www.rsc.org/images/entities/char_2009.gif) :
:![[thin space (1/6-em)]](https://www.rsc.org/images/entities/char_2009.gif) 1, 1
1, 1![[thin space (1/6-em)]](https://www.rsc.org/images/entities/char_2009.gif) :
:![[thin space (1/6-em)]](https://www.rsc.org/images/entities/char_2009.gif) 2, and 1
2, and 1![[thin space (1/6-em)]](https://www.rsc.org/images/entities/char_2009.gif) :
:![[thin space (1/6-em)]](https://www.rsc.org/images/entities/char_2009.gif) 3 metal/ligand molar ratios. Combined potentiometric–spectrophotometric measurements were done in the 200–400 nm spectral range for protonation equilibria and in the 400–800 nm range for Fe3+ complexation, using 0.2 and 1 cm path lengths, respectively. Complex formation equilibria with Al3+, Cu2+ and Zn2+ were potentiometrically studied. Protonation and complex formation data were analysed using HyperQuad2013
3 metal/ligand molar ratios. Combined potentiometric–spectrophotometric measurements were done in the 200–400 nm spectral range for protonation equilibria and in the 400–800 nm range for Fe3+ complexation, using 0.2 and 1 cm path lengths, respectively. Complex formation equilibria with Al3+, Cu2+ and Zn2+ were potentiometrically studied. Protonation and complex formation data were analysed using HyperQuad2013![[thin space (1/6-em)]](https://www.rsc.org/images/entities/char_2009.gif) 20 and HypSpec21 programs.
20 and HypSpec21 programs.
ESI-MS analysis
All MS experiments were performed on a Bruker microTOF-Q spectrometer (Bruker Daltonik, Bremen, Germany), equipped with an Apollo II electrospray ionization source with an ion funnel. The instrument parameters were: scan range m/z 250–2000, dry gas – nitrogen, temperature 200 °C, ion source voltage 4500 V, collision energy 10 eV, analyte aqueous solutions (70 μL). Solutions were introduced at a flow rate of 3 μL min−1. The Bruker microTOF-Q spectrometer was calibrated with the Tunemix™ mixture (Bruker Daltonik, Germany) in the quadratic regression mode. The mass spectrometer operated in the positive ion mode. Each spectrum was obtained with more than 100 individual scans. The overall charge of the analysed ions was calculated on the basis of the distance between isotopic peaks. The formulae of the complexes were determined by application of the Compass Data Analysis program (Bruker Daltonik, Germany).22 The water and D2O solutions of the ligand (1 × 10⁻⁴ M) with FeCl3 and AlCl3 salts (1![[thin space (1/6-em)]](https://www.rsc.org/images/entities/char_2009.gif) :
:![[thin space (1/6-em)]](https://www.rsc.org/images/entities/char_2009.gif) 3 metal to ligand molar ratio) and CuCl2, ZnCl2 (1
3 metal to ligand molar ratio) and CuCl2, ZnCl2 (1![[thin space (1/6-em)]](https://www.rsc.org/images/entities/char_2009.gif) :
:![[thin space (1/6-em)]](https://www.rsc.org/images/entities/char_2009.gif) 2 metal to ligand molar ratio) were incubated for 15 days at room temperature before the measurements. Solutions at variable pH and pD values were obtained by adding triethylamine and HCl (water solution), or NaOD and DCl (D2O solutions). pH and pD were measured on a previously calibrated pH-meter.
2 metal to ligand molar ratio) were incubated for 15 days at room temperature before the measurements. Solutions at variable pH and pD values were obtained by adding triethylamine and HCl (water solution), or NaOD and DCl (D2O solutions). pH and pD were measured on a previously calibrated pH-meter.
NMR spectroscopy
NMR experiments were performed on a Bruker Ascend™ 400 MHz spectrometer equipped with a 5 mm automated tuning and matching broad band probe (BBFO) with z-gradients as previously reported.23 In particular, all the NMR experiments were carried out with a ligand concentration of 5 mM in D2O and H2O–D2O (90%–10%) solutions at 25 °C in 5 mm NMR tubes. The solution pH, corrected for the deuterium isotopic effect, was adjusted with diluted DCl and NaOD on a pH meter Crison micro TT 2050 with an electrode Mettler Toledo InLab 422. The concentration of Fe3+ and Ga3+ ions was achieved by using a stock of acidic deuterated aqueous solution of FeCl3 and GaCl3 salts. The metal ions were added to P1 ligand solutions and the pH was then set to the right value just before the acquisition of the spectra. 2-D 1H–13C HSQC (heteronuclear single quantum coherence) spectra were acquired by using a phase-sensitive sequence employing Echo-Antiecho-TPPI gradient selection with a heteronuclear coupling constant JXH = 145 Hz, and shaped pulses for all 180° pulses on the f2 channel with decoupling during acquisition; sensitivity improvement and gradients in back-inept were also used.24–26 Relaxation delays of 2 s and 90° pulses of about 10 μs were applied in all the experiments. Solvent suppression for 1D 1H, 2D 1H–1H TOCSY (total correlation spectroscopy) and 1H–1H ROESY (rotating-frame Overhauser effect spectroscopy) experiments were achieved by using excitation sculpting with gradients. The spin-lock mixing time of TOCSY experiment was obtained with MLEV17.271H–1H TOCSYs were performed by using mixing times of 60 ms. A combination of 1D, 2D TOCSY, HSQC and ROESY experiments was employed to assign the signals of both free and metal-bound ligands at different pH values as previously reported for similar systems.23,28–33 All NMR data were processed by using TopSpin (Bruker Instruments) software and analysed by Sparky 3.11![[thin space (1/6-em)]](https://www.rsc.org/images/entities/char_2009.gif) 34 and MestRe Nova 6.0.2 (Mestrelab Research S.L.) programs.
34 and MestRe Nova 6.0.2 (Mestrelab Research S.L.) programs.
DFT calculation
Theoretical calculations were performed at the Density Functional Theory (DFT) level35 with the Gaussian 09 package of programs (Rev. A.02)36 on an E4 workstation equipped with four quad-core AMD Opteron 2.2 MHz processors and 16 GB of RAM and running the 64 bit version of the Ubuntu 12.04 Linux operating system. Barone and Adamo's mPW1PW hybrid functional was adopted,37 along with the Schäfer, Horn, and Ahlrichs double-ζ plus polarization all-electron basis sets38 (BS) for all atomic species. The geometry of the compounds was optimized with tight SCF convergence criterion and fine numerical “pruned” integration grids (75 radial shells and 302 angular points per shell). The nature of the minima of each optimized structure was verified by harmonic frequency calculations. NBO charge distributions39 and Wiberg40 bond indices were calculated at the optimized geometries. Solvation calculations were carried out in the gas phase and water, implicitly taken into account by means of the polarisable continuum model (PCM) in its integral equation formalism variant (IEF-PCM).41 The programs Gaussview 5.0.8,42 and Molden 5.2.4![[thin space (1/6-em)]](https://www.rsc.org/images/entities/char_2009.gif) 43 were used to investigate the charge distributions and optimized geometries.
43 were used to investigate the charge distributions and optimized geometries.
Partition coefficients
P1 and DFP octanol/water partition coefficients (log![[thin space (1/6-em)]](https://www.rsc.org/images/entities/char_2009.gif) P) were calculated as the logarithm of the ratio of their concentrations at 25 °C measured in the n-octanol phase and in the aqueous phase (Tris, pH = 7.4), using the well-established “shake flask” method.10,11,44–46 Each compound was added to a premixed suspension, containing 3 mL of n-octanol and 3 mL of the aqueous phase, and stirred for 4 h. The species concentration in the aqueous layer was evaluated by spectrophotometry with a Perkin Elmer Lambda 35 spectrophotometer, using a thermostated 1 cm path length cell, on the benzenoid bands of the compounds (λ = 280–290 nm). The measurements were done in triplicate and repeated three times.
P) were calculated as the logarithm of the ratio of their concentrations at 25 °C measured in the n-octanol phase and in the aqueous phase (Tris, pH = 7.4), using the well-established “shake flask” method.10,11,44–46 Each compound was added to a premixed suspension, containing 3 mL of n-octanol and 3 mL of the aqueous phase, and stirred for 4 h. The species concentration in the aqueous layer was evaluated by spectrophotometry with a Perkin Elmer Lambda 35 spectrophotometer, using a thermostated 1 cm path length cell, on the benzenoid bands of the compounds (λ = 280–290 nm). The measurements were done in triplicate and repeated three times.
Biodistribution studies
67Ga-citrate injection solution was prepared by dilution of the commercial 67Ga citrate solution with saline to obtain a final radioactive concentration of 5–10 MBq per 100 μL. Biodistribution studies were carried out in groups of 3 female Balb-C mice, weighing ca. 20–22 g (randomly bred, Charles River, from CRIFFA, France). Mice were intravenously injected with 100 μL (5–10 MBq) of 67Ga citrate via the tail vein immediately followed by an intraperitoneal injection of 0.35 μmol of each ligand (P1 and DFP as a control) in 100 μL saline. Animals were maintained on normal diet ad libitum and were sacrificed by cervical dislocation at 1 h and 24 h post-administration. The administered radioactive dose and the radioactivity in sacrificed animals were measured in a dose calibrator (Aloka, Curiemeter IGC-3, Aloka, Tokyo, Japan). The difference between the radioactivities in the injected and in the sacrificed animal was assumed due to the whole body excretion. Tissue samples of main organs were then removed for counting in a gamma counter (Berthold LB2111, Berthold Technologies, Germany). Radioactivity remaining in the carcass was measured in the dose calibrator and expressed as a percent of injected activity (% I.A.). Biodistribution results were expressed as a percent of injected activity per gram of organ (% I.A. per g) and presented as mean values ± SD.Results and discussion
Synthesis of P1
5-Hydroxy-2-(hydroxymethyl)pyridin-4(1H)-one was synthesised from kojic acid, following a standard synthetic procedure, previously described for the preparation of other pyridinones.44 The first step involves the protection of the 5-hydroxyl group of KA with a benzyl group, by reaction with benzyl chloride and formation of 5-(benzyloxy)-2-(hydroxymethyl)-4H-pyran-4-one. This was converted into the corresponding pyridinone, 5-benzyloxy-2-(hydroxymethyl)-pyridin-4(1H)-one, by reaction with an ammonia aqueous solution under reflux (Michael addition, ring opening/closure, and dehydration). The benzyl protecting group was then removed by catalytic hydrogenolysis providing the final product P1 (Scheme 2).Crystal structure of P1
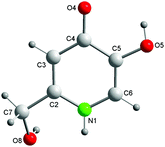
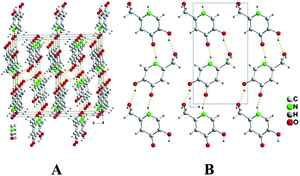
The bond lengths and angles in the molecule P1 (Fig. 1) have commonly encountered values (Table S3†). The substituents at C4 and C5 are almost coplanar with the aromatic ring. In contrast, the torsion angle N1–C2–C7–O8 [−31.0(2)°] reveals a noticeable twisting for the C2 hydroxymethyl group towards the aromatic ring plane.The crystal packing of P1 features infinite one-dimensional zig-zag chains along the c axis, built up by classical hydrogen bonding interactions: N1–H1A⋯O4c and O5–H5A⋯O8a (operators for generating equivalent atoms: a, −x + 1/2, −y + 1, z − 1/2; c, −x + 1/2, −y + 1, z + 1/2, with R22 hydrogen-bonding patterns (Fig. 2B).47
Each molecule forms an additional hydrogen bond O8–H8A⋯O4b (b, −x + 1, y + 1/2, − z + 1/2) with a molecule of a neighbouring chain to give an infinite three-dimensional network (Fig. 2A). Hence, the O4-carbonyl atom acts twice as a H-acceptor whereas the O8–H8A alcoholic moiety plays the roles of both a H-donor and a H-acceptor. The structural comparison of P1 with kojic acid,48 shows that the O-heterocyclic atom of kojic acid does not act as a H-acceptor in its crystal. In clear contrast, the isolobal N1–H1A group of P1 (replacing the O-heterocyclic donor of the kojic acid) acts as an H-donor for intermolecular interactions. In addition, the torsion angle O1–C2–C7–O8 [–167.8(2)°] in KA shows that the hydroxymethyl substituent is oriented in the opposite direction with respect to KA. These data will be of importance in the following considerations of tautomeric forms.
Protonation equilibria
The protonation equilibria of P1 have been examined with different techniques. Potentiometric–spectrophotometric measurements gave evidence of three different deprotonation steps according to the sequence (1).| H3L+ = H2L = HL− = L2− | (1) |
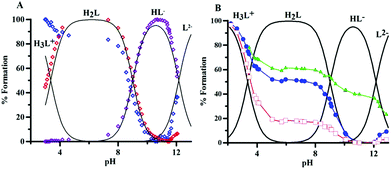
The loss of each proton markedly affects UV absorption spectra (Fig. S2A and B†), and three different pH regions (3–4.6, 7.3–10.5, and 10.6–13.2) relative to each single equilibrium can be identified, characterized by different bands and well defined isosbestic points. These features allowed the evaluation of the protonation constants (Table 1); the related speciation plot is presented in Fig. 3A with the superimposed heights of UV bands, obtained by spectral decomposition. The trend of 1H NMR signals of protons H3, H6 and H7 vs. pH (Fig. 3B, S4 and Table S27†) confirms the deprotonation sequence (1).
The first deprotonation (pH 2–5) mainly affects proton H3, suggesting that the proton is lost from the protonated oxygen in position 4. The signal of H6 reflects this effect though to a minor extent. The second step (pH 7.3–10.5), related to the deprotonation of the 5-hydroxy group, mainly reflects on the H6 chemical shift. The last deprotonation (pH > 10.6) affects predominantly the H7 signals of the methylene group, which could be implied in a hydrogen bond between the OH group and the now deprotonated nitrogen atom. The high pK of this last dissociation suggests a keto–enol tautomer transition with dissociation from the hydroxyl group.
The log![[thin space (1/6-em)]](https://www.rsc.org/images/entities/char_2009.gif) K 9.00 and 3.37 are almost equal to those of 3,4-hopo,4 and somewhat lower than those of DFP (Table 1).49 Conversely, the loss of a third proton is a new feature, which implies an equilibrium with a catechol-like molecule that loses its proton at basic pH values (log
K 9.00 and 3.37 are almost equal to those of 3,4-hopo,4 and somewhat lower than those of DFP (Table 1).49 Conversely, the loss of a third proton is a new feature, which implies an equilibrium with a catechol-like molecule that loses its proton at basic pH values (log![[thin space (1/6-em)]](https://www.rsc.org/images/entities/char_2009.gif) K 12.16). The deprotonation at the ring NH group of DL-α-amino-β-(6-oxo-1,6-dihydro-pyridin-6yl)propanoic acid (Stunzi et al.)50 is characterized by a log
K 12.16). The deprotonation at the ring NH group of DL-α-amino-β-(6-oxo-1,6-dihydro-pyridin-6yl)propanoic acid (Stunzi et al.)50 is characterized by a log![[thin space (1/6-em)]](https://www.rsc.org/images/entities/char_2009.gif) K value of 11.8, similar to that of 2-hydroxypyridine (11.7).51
K value of 11.8, similar to that of 2-hydroxypyridine (11.7).51
The ESI-MS measurements in D2O give evidence of the exchange of four labile protons with deuterium. The spectrum of the ligand in the D2O solution (Fig. S9†) shows five signals of different intensities. The most intense signals at 145.070 m/z and 146.076 m/z correspond to [C6H5D3O3N]+ and [C6H4D4O3N]+ deuterated on two or three oxygen atoms and on a single nitrogen atom. The less intense signals at 142.050, 143.057 and 144.063 m/z match with the simulated spectra of [C6H8O3N]+, [C6H7DO3N]+ and [C6H6D2O3N]+. The ESI-MS signals of the free ligand at different pH values (1.68, 6.13, 11.5 and 13.7, Table S28†) show that the molecular weight of the ligand does not change during the first (140.032 m/z) and third (139.032 m/z) deprotonation in the negative mode spectrum, and does not present positively charged signals at basic pH. The presence of a peak at 139.032 m/z, a striking peculiarity observed in aqueous solutions at pH > 11.5, further confirms the last deprotonation process shown in sequence (1).
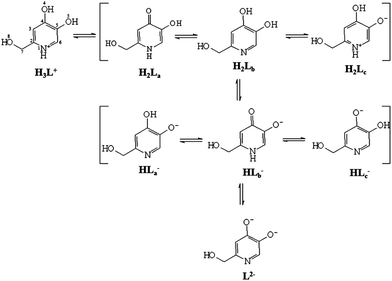
The deprotonation sequence of P1 has been also investigated at the DFT level by calculating the electronic energies of the possibly protonated forms of the ligand at their ground state optimized geometry. Based on the results recently published on related systems, DFT calculations were performed by using the mPW1PW hybrid functional37 and Schäfer, Horn, and Ahlrichs double-ζ plus polarization all-electron basis sets (BS) for all of the atomic species.38 In particular, the fully protonated cationic ligand H3L+, the three possible isomers of the neutral and monoanionic forms (H2L and HL−, respectively), and the completely deprotonated dianion L2− were optimized, both in the gas phase and in water, implicitly taken into account by using the integral equation formalism of the polarizable continuum model (IEF-PCM) within the self-consistent reaction field (SCRF) approach (Scheme 3).41
A comparison of the metric parameters optimized for the neutral isomer H2La in the gas phase with the corresponding structural data (see above) shows very good agreement between the two sets of data, the principal bond distances being varied by less than 0.05 Å (Table S7†). No significant changes in the optimized structural parameters were observed upon considering implicit solvation in the calculations; all the bond lengths and angles differ by less than 0.01 Å and 2°, respectively, for all of the eight forms of the ligand considered here. All of the compounds show a completely planar structure, except the hydroxymethyl substituent, whose orientation depends on the protonation pattern of the ligand. In particular, in the species where N1 is deprotonated (H2Lb, HLa−, HLc−, and L2−), the O8–H8 hydroxyl group is coplanar with the heterocyclic ring, and H8 is oriented towards N1 (C2–C7–O8–H8 dihedral angle ∼0.0°), so that a hydrogen bond interaction can be observed between the two atoms (N1⋯H8 distance in the range 1.663–1.907 Å; Fig. S1† for H2Lb). A Second-Order Perturbation Theory Analysis (SOPTA) of the Fock matrix in NBO basis allows for evaluation of the energy ESOPTA of the interaction between the lone pair (LP) localized on N1 and the unfilled natural orbitals of the O8–H8 hydroxyl group in the range between 10.3 and 35.0 kcal mol−1 depending on the species. On the other hand, in the forms of the ligand showing N1 protonated (namely H2La, H2Lc, and HLb−), in agreement with what was found experimentally for H2La, the O8–H8 moiety lies outside the plane described by the rest of the molecule, the N1–C2–C7–O8 and C2–C7–O8–H8 dihedral angles being in the range of −23.0/–40.8 and −49.2/–78.8°, respectively (Table S7 and Fig. S1† for H2La and H2Lc). Finally, in H3L+, although the C7 hydroxyl group is coplanar with the heterocyclic ring, H8 is oriented opposite to N1 (C2–C7–O8–H8 dihedral angle ∼180.0°). An analysis of the total electronic energies calculated for the three possible neutral tautomeric forms of the ligand suggests the tautomer H2La to be the most stable (H2Lb and H2Lc being less stable by about 7 and 5 kcal mol−1, respectively). This agrees with a first deprotonation of the ligand concerning H4, as hypothesized based on spectroscopic evidence, and with the X-ray diffraction analysis discussed above. In agreement with experimental data, H2La is stabilized by a hydrogen bond (O4⋯H5 distance = 1.885 Å; Fig. S1†), the interactions between the LP localized on O4 and the unfilled natural orbitals of the O5–H5 hydroxyl group being calculated as ESOPTA = 10.6 kcal mol−1.
As far as the monoanionic forms of the ligand are concerned, the isomers HLa− and HLc− were calculated and found to be more stable than HLb− by 12 and 15 kcal mol−1, respectively, owing to the formation of two different hydrogen bonds, one involving the N1 atom and the hydroxymethyl pendant, and the other the C4–O4 and C5–O5 groups (O5⋯H4 distance in HLa− = 1.684 Å; O4⋯H5 distance in HLc− = 1.775 Å; ESOPTA ∼27 and 18 kcal mol−1 for HLa− and HLc−, respectively). This accounts for the mechanism suggested by experimental data for the second deprotonation of the ligand, which should involve the O5–H5 hydroxyl group, followed by a rearrangement leading from the pyridinone HLb− to the catechol-like tautomer HLa−.
Each technique has given evidence of tautomeric forms, and together they provided a complete description of the deprotonation paths. As long as third deprotonation was not observed for 3,4-hopo, we believe that –CH2OH in the position 2 is important for the tautomer change of the molecule.
Iron complexes
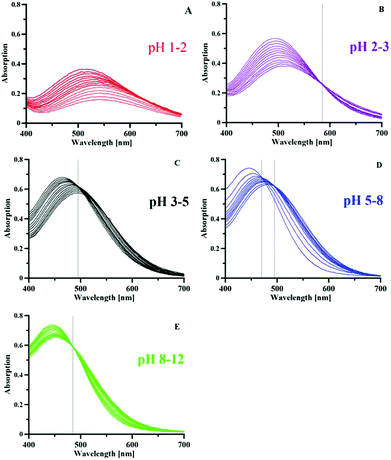
The iron complex formation was studied by potentiometric–spectrophotometric combined titrations, ESI-MS and NMR. Some spectra collected during a Fe3+–P1 titration are presented in Fig. 4, representative of the transformations that occur with pH. Up to pH 2 a new band centred at 550 nm increases in intensity (Fig. 4A), due to the formation of a [FeLH]2+ complex from the colourless hexaaquo-iron species. In the pH range of 2–3 (Fig. 4B) a new band appears at 500 nm with a clear isosbestic point at 585 nm, related to the formation of a [FeL2H2]+ complex. By increasing the pH a new band forms at 460 nm related to the neutral [FeL3H3] complex, with an isosbestic point at 488 nm. The behaviour up to pH 5 is similar to that of deferiprone that presents in sequence similar bands due to the formation of 1![[thin space (1/6-em)]](https://www.rsc.org/images/entities/char_2009.gif) :
:![[thin space (1/6-em)]](https://www.rsc.org/images/entities/char_2009.gif) 1, 1
1, 1![[thin space (1/6-em)]](https://www.rsc.org/images/entities/char_2009.gif) :
:![[thin space (1/6-em)]](https://www.rsc.org/images/entities/char_2009.gif) 2 and 1
2 and 1![[thin space (1/6-em)]](https://www.rsc.org/images/entities/char_2009.gif) :
:![[thin space (1/6-em)]](https://www.rsc.org/images/entities/char_2009.gif) 3 complexes.49 A different behaviour is featured by P1 at pH > 5: first a new band appears at 445 nm with a clear isosbestic point at 464 nm, that at pH > 9 further transforms into a new band at a slightly higher wavelength, with an isosbestic point at 485 nm. These last transformations, taking into account the potentiometric results, are related to the loss of a proton from the neutral species modelled as FeL3H3 (possibly corresponding to Fe(HL)3) giving a negatively charged complex modelled as [FeL3H2]−, and then of two further protons to give the [FeL3]3− complex. Such changes were observed above pH 7 by Scarrow et al. for 3,2-hopo, but not for 3,4-hopo.4 The first isosbestic point of the tris(3,2-hopo) iron complex at 494 nm was attributed by the authors to the mono-deprotonation with a pK value of 9.04. A second deprotonation occurred around pH 11. It has to be remarked that, while DFP and P1 iron complexes exhibit good solubility in the pH range of 2–11, the neutral tris(hydroxypyridinonato) iron complexes with the three hopo ligands studied by Scarrow et al.4 are quite insoluble. The negative charge in the complexes of P1 with a general model [FeL3H3–n]n− further contributes to increase their solubility.
3 complexes.49 A different behaviour is featured by P1 at pH > 5: first a new band appears at 445 nm with a clear isosbestic point at 464 nm, that at pH > 9 further transforms into a new band at a slightly higher wavelength, with an isosbestic point at 485 nm. These last transformations, taking into account the potentiometric results, are related to the loss of a proton from the neutral species modelled as FeL3H3 (possibly corresponding to Fe(HL)3) giving a negatively charged complex modelled as [FeL3H2]−, and then of two further protons to give the [FeL3]3− complex. Such changes were observed above pH 7 by Scarrow et al. for 3,2-hopo, but not for 3,4-hopo.4 The first isosbestic point of the tris(3,2-hopo) iron complex at 494 nm was attributed by the authors to the mono-deprotonation with a pK value of 9.04. A second deprotonation occurred around pH 11. It has to be remarked that, while DFP and P1 iron complexes exhibit good solubility in the pH range of 2–11, the neutral tris(hydroxypyridinonato) iron complexes with the three hopo ligands studied by Scarrow et al.4 are quite insoluble. The negative charge in the complexes of P1 with a general model [FeL3H3–n]n− further contributes to increase their solubility.
The stability constants of the Fe3+–P1 complexes obtained by the spectrophotometric–potentiometric results are reported in Table 2, and the related speciation plot in Fig. 5.
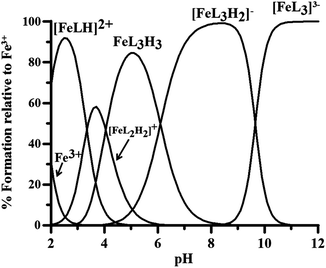 | ||
Fig. 5 Speciation plots of P1 complexes with Fe3+ at 1 μM metal ion concentration and 10 μM ligand concentration (log![[thin space (1/6-em)]](https://www.rsc.org/images/entities/char_2009.gif) β in Table 2). β in Table 2). | ||
| Model | Fe3+ | Al3+ | ||
|---|---|---|---|---|
Log![[thin space (1/6-em)]](https://www.rsc.org/images/entities/char_2009.gif) β β |
pK | Log![[thin space (1/6-em)]](https://www.rsc.org/images/entities/char_2009.gif) β β |
pK | |
| [MLH]2+ | 25.92(9) | 23.32(9) | ||
| [ML2H2]+ | 49.12(1) | 45.18(6) | ||
| ML3H3 | 71.43(6) | 65.25(7) | ||
| [ML3H2]– | 65.33(3) | 6.1 | 58.30(4) | 6.95 |
| [ML3]3– | 46.03(5) | 9.65 | 38.41(5) | 9.95 |
| pM | 22.0 | 15.1 | ||
| Model | Cu2+ | Zn2+ | ||
|---|---|---|---|---|
Log![[thin space (1/6-em)]](https://www.rsc.org/images/entities/char_2009.gif) β β |
pK | Log![[thin space (1/6-em)]](https://www.rsc.org/images/entities/char_2009.gif) β β |
pK | |
| [MLH]+ | 21.78(7) | 18.79(6) | ||
| ML2H2 | 41.42(7) | 36.70(4) | ||
| [ML2H]– | 34.21(5) | 7.21 | 26.02(9) | 10.68 |
| [ML2]2– | 24.68(5) | 9.53 | — | |
| pM | 10.1 | 6.3 | ||
The pFe3+ value 22.0 of P1–iron complexes is noticeably higher than that of deferiprone (20.6),49 3,4-hopo (20.6)4 and 3,2-hopo (16.3).4 This is due on one side to the loss of the nitrogen proton from the complex with model FeL3H3, with the corresponding tautomeric change to the catechol form, and on the other to the protonation constant of the OH group lower in P1 than in deferiprone.
The ESI-MS data confirm the potentiometric–spectrophotometric results. Positively charged complexes form at acidic pH: [FeL2H2]+ (336.004 m/z), [FeL2H2 + Cl− + K+]+ (409.940 m/z) and [FeL3H3 + K+]+ (515.002 m/z), while at neutral and basic pH [FeL2H2]+ (336.004 m/z), [FeL3H3 + Na+]+ (499.029 m/z) and [FeL3H3 + K+]+ (515.002 m/z), complexes are present. At basic pH also, the formation of the negatively charged complex [FeL2]− (333.998 m/z) is observed (Fig. S10 and Table S29†).
The interaction of P1 with Fe3+ ions has been followed by NMR at two different pH values. In Fig. 6 the aromatic region of the 1H NMR spectra of P1 is reported. The spectra were obtained by using sub-stoichiometric amounts of Fe3+ ions, from 0![[thin space (1/6-em)]](https://www.rsc.org/images/entities/char_2009.gif) :
:![[thin space (1/6-em)]](https://www.rsc.org/images/entities/char_2009.gif) 1 up to 0.2
1 up to 0.2![[thin space (1/6-em)]](https://www.rsc.org/images/entities/char_2009.gif) :
:![[thin space (1/6-em)]](https://www.rsc.org/images/entities/char_2009.gif) 1 metal to ligand molar ratios at pH 7 and 11.5. Both aromatic protons, H3 and H6, are affected by the interaction with Fe3+ ions.
1 metal to ligand molar ratios at pH 7 and 11.5. Both aromatic protons, H3 and H6, are affected by the interaction with Fe3+ ions.
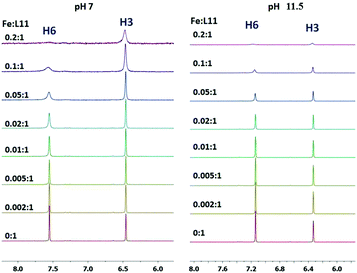 | ||
| Fig. 6 Stacked aromatic region of 1D 1H NMR spectra of P1 by increasing the sub-stoichiometric amounts of Fe3+, at pH 7 (left) and pH 11.5 (right) at 25 °C. | ||
In the aromatic region of the 1H NMR spectra, at pH 7, a selective broadening of signals was evidenced and both aromatic protons, H3 and H6, were affected by the interaction with Fe3+ ions. In particular, the H6 proton is the most affected suggesting the involvement in the coordination of the deprotonated oxygen in the position 5 to give a FeL3H3 species.
Ga3+ ions have been used as a diamagnetic probe for the paramagnetic Fe3+ ions, in order to prevent the NMR paramagnetic line broadening. The aromatic region of the 1H NMR spectra obtained by adding incremental amounts of Ga3+ ions to P1 solution at neutral pH shows that, similarly to Fe3+, H6 and H3 were the most affected protons by metal coordination, giving however in this case an upfield and a downfield shift, respectively (Fig. S7†).
The spectra obtained at pH 11.5 (Fig. 6) confirm that the deprotonation of the pyridine nitrogen protons affects, after Fe3+ coordination, in the same way H3 as well as H6, suggesting the deprotonation of both oxygen atoms at pH > 11 without any hydrolysis of the complex. These features are in agreement with the proposed scheme of tautomerism.
For the Ga3+–P1 system, the signals H3 and H6 were affected, also at high pH, in a similar way to that of Fe3+–P1 (Fig. S8†).
Some of the authors recently used DFT calculations to investigate the relative stabilities of Al3+ and Fe3+ complexes featuring the 2,2′-[(2-hydroxy-3-methoxyphenyl)methanediyl]bis [3-hydroxy-6-(hydroxymethyl)-4H-pyran-4-one] and 2,2′-[(4-hydroxy-3-methoxyphenyl)methanediyl]bis[3-hydroxy-6-hydroxymethyl)-4H-pyran-4-one] ligands.52 Encouraged by these results, we optimized the structures of the complexes Fe(HL)3 and [FeL3]3− at the same level of theory as free ligands. In both cases, the 3d5 Fe3+ metal ion has been considered to assume a high-spin configuration (spin sextet state). In the neutral complex, the metal ion is chelated by the three HL− ligands in an only slightly distorted octahedral fashion (O4–Fe–O13 angle = 96.15°; Fig. 7). The three ligand units show the corresponding bond lengths and angles, with barely distinguishable Fe–O (“hydroxy”) and Fe–O (“keto”) lengths in the complex (Fe–O4 and Fe–O5 distances = 2.082 and 1.994 Å, respectively, in the gas phase). A comparison of the metric parameters optimized for Fe(HL)3 in the gas phase (Fig. 7 and Table S8†) with the corresponding ones determined by X-ray diffraction for the neutral complexes Fe(P2)3, isolated in Fe(P2)3·3H2O,53 and Fe(P3)3![[thin space (1/6-em)]](https://www.rsc.org/images/entities/char_2009.gif) 54 show a very good agreement between the experimental and calculated sets of data [P2 = 3-hydroxy-6-hydroxymethyl-1-methylpyrid-4-onato; P3 = 1,2-dimethyl-3-hydroxypyrid-4-onato]; average structural Fe–O distances: 2.007 and 2.018 Å; C–O: 1.314 and 1.320 Å; O–Fe–O, 81.27° and 80.91 for Fe(P2)3 and Fe(P3)3, respectively; average calculated Fe–O distances: 2.039 Å; C–O: 1.275 Å; O–Fe–O, 79.29° for Fe(HL)3.
54 show a very good agreement between the experimental and calculated sets of data [P2 = 3-hydroxy-6-hydroxymethyl-1-methylpyrid-4-onato; P3 = 1,2-dimethyl-3-hydroxypyrid-4-onato]; average structural Fe–O distances: 2.007 and 2.018 Å; C–O: 1.314 and 1.320 Å; O–Fe–O, 81.27° and 80.91 for Fe(P2)3 and Fe(P3)3, respectively; average calculated Fe–O distances: 2.039 Å; C–O: 1.275 Å; O–Fe–O, 79.29° for Fe(HL)3.
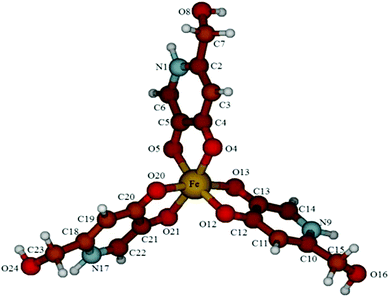 | ||
| Fig. 7 Ball and stick drawing of the DFT-optimized molecular structure of the neutral complex Fe(HL)3 (yellow = Fe; red = O; grey = C; blue = N; white = H). | ||
On passing from the gas phase to the optimization in water carried out at the SCRF level, only minor variations in the pattern of the bond lengths and angles were calculated (average Fe–O bond distance: 2.036; C–O: 1.287 Å).
By complete deprotonation of the complex Fe(HL)3, the anionic species [FeL3]3− is ideally obtained. As expected, the coordination environment at the high-spin central metal ion is not changed as compared to the corresponding neutral complex, with only a marginal elongation of the Fe–O and C–O distances [average optimised Fe–O distances: 2.056 Å; C–O: 1.287 Å; O–Fe–O, 78.77°; corresponding average structural metric parameters‡ for trianionic tris-catecholate Fe3+ complexes: Fe–O, 2.01(3) Å; C–O, 1.33(2) Å; O–Fe–O, 80(1)°], reflecting an unchanged pattern of bond orders at the iron centre [average Wiberg40 bond index: 0.332 and 0.331 for FeL3H3 and [Fe(L)3]3−, respectively]. As observed for the free ligand, the deprotonation of the N-heterocycles results in the formation of hydrogen bonds between the nitrogen atoms and the hydroxymethyl pendants (distance N⋯H(O) = 1.724 Å). The SOPTA allows evaluating the energy of the non-bonding hydrogen interaction in 13.1 kcal mol−1 for each ligand in the gas phase. This stabilization, amounting to about 40 kcal mol−1, might be at the origin of the stability of such trianionic complexes.
Metal complexes
The complex formation equilibria of P1 with Al3+, Cu2+ and Zn2+ have also been studied by potentiometric methods and ESI-MS. The estimated complex formation constants are reported in Table 2 and the speciation plots in Fig. 8.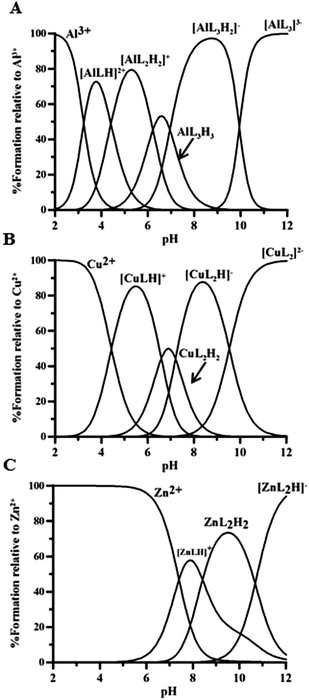 | ||
Fig. 8 Speciation plots of P1 model complexes with (A) Al3+, (B) Cu2+ and (C) Zn2+ at 1 μM metal ion concentration and 10 μM ligand concentration (log![[thin space (1/6-em)]](https://www.rsc.org/images/entities/char_2009.gif) β in Table 2). β in Table 2). | ||
We want to remark that the pAl3+, pCu2+, pZn2+ calculated for P1 complexes are almost equal to those for deferiprone and 3,4-hopo (see Table S32†), in contrast with the net increase relative to iron complexes. This behaviour drives us to define P1 as an iron chelator more selective than deferiprone.
Lipophilicity and drug-like descriptors
Lipophilicity greatly influences the pharmacokinetic and pharmacodynamic profile of a drug, and the partition coefficient between water and n-octanol (log![[thin space (1/6-em)]](https://www.rsc.org/images/entities/char_2009.gif) P) is the parameter in use for its evaluation. Log
P) is the parameter in use for its evaluation. Log![[thin space (1/6-em)]](https://www.rsc.org/images/entities/char_2009.gif) P of P1, and of DFP for comparison, were measured with the “shake-flask” method. The obtained values (Table 3) are quite similar, though that of P1 (−0.90) is slightly less than that of DFP (−0.82). The same lipophilicity order was obtained from in silico calculations, using the QikProp program.55 This program provides also a number of indicators of the pharmacokinetic profile of a drug, as the ability to cross the blood–brain barrier (log
P of P1, and of DFP for comparison, were measured with the “shake-flask” method. The obtained values (Table 3) are quite similar, though that of P1 (−0.90) is slightly less than that of DFP (−0.82). The same lipophilicity order was obtained from in silico calculations, using the QikProp program.55 This program provides also a number of indicators of the pharmacokinetic profile of a drug, as the ability to cross the blood–brain barrier (log![[thin space (1/6-em)]](https://www.rsc.org/images/entities/char_2009.gif) BB), the ability to be absorbed through the intestinal tract to the bloodstream (Caco-2 cell permeability) and the verification of Lipinski's rule of five45 (Table 3).
BB), the ability to be absorbed through the intestinal tract to the bloodstream (Caco-2 cell permeability) and the verification of Lipinski's rule of five45 (Table 3).
![[thin space (1/6-em)]](https://www.rsc.org/images/entities/char_2009.gif) P for P1 (in the neutral forms H2La and H2Lb) and DFP, and calculated values for clog
P for P1 (in the neutral forms H2La and H2Lb) and DFP, and calculated values for clog![[thin space (1/6-em)]](https://www.rsc.org/images/entities/char_2009.gif) P, ability to cross the blood–brain barrier (log
P, ability to cross the blood–brain barrier (log![[thin space (1/6-em)]](https://www.rsc.org/images/entities/char_2009.gif) BB), ability to be absorbed through the intestinal track to the blood (Caco-2 cell permeability), bioavailability into the central nervous system and the verification of Lipinski's rule of five45
BB), ability to be absorbed through the intestinal track to the blood (Caco-2 cell permeability), bioavailability into the central nervous system and the verification of Lipinski's rule of five45
| Name | DFP | H2La | H2Lb |
|---|---|---|---|
| a Octanol/water partition coefficients, values measured in the present work. b Predicted values using the program QikProp v.2.5.55 c Blood/brain partition coefficient. | |||
| MW | 138 | 141 | 141 |
log![[thin space (1/6-em)]](https://www.rsc.org/images/entities/char_2009.gif) Pa Pa |
−0.82 | −0.90 | — |
clog![[thin space (1/6-em)]](https://www.rsc.org/images/entities/char_2009.gif) Pb Pb |
0.915 | −0.795 | 0.520 |
log![[thin space (1/6-em)]](https://www.rsc.org/images/entities/char_2009.gif) BBb,c BBb,c |
−0.254 | −1.021 | 0.978 |
| Caco-2 permeability (nm s−1)b | 1141 | 192 | 256 |
| CNSb | +/− | — | — |
| Violations of Lipinski's rulesb | 0 | 0 | 0 |
Although P1 does not present any violation of the restricted Lipinski's rule, it presents some limitations to the barrier-crossing ability compared to DFP. In particular, P1 presents lower permeability through the Caco-2 membranes (higher than 500 nm s−1 is considered good),55 as well as through the blood–brain barrier (log![[thin space (1/6-em)]](https://www.rsc.org/images/entities/char_2009.gif) BB < −1.0, poorly distributed to the brain) and thus lower bioavailability into the central nervous system. Interestingly the tautomeric diphenolic form H2Lb is characterized by slightly better pharmacokinetic descriptors than H2La, namely in terms of membrane permeability, due to the increased aromaticity of the molecule that involves a lipophilicity enhancement.
BB < −1.0, poorly distributed to the brain) and thus lower bioavailability into the central nervous system. Interestingly the tautomeric diphenolic form H2Lb is characterized by slightly better pharmacokinetic descriptors than H2La, namely in terms of membrane permeability, due to the increased aromaticity of the molecule that involves a lipophilicity enhancement.
Biodistribution studies
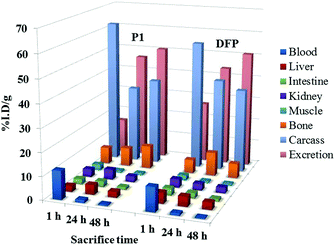
To evaluate the efficacy of the new ligand P1 as a chelating agent for mobilization of metal ions, we studied the biodistribution profile of the well-established radiotracer 67Ga-citrate in female mice with simultaneous intraperitoneal administration of the ligand solution. The effect of this chelator on the 67Ga uptake and clearance on the major organs and on the excretion can be viewed in comparison with the drug DFP (Fig. 9).Although the effect of DFP on the biodistribution of the radiotracer in metal-overload mice has been previously reported, those studies involved a different animal model (CD1)56,57 and so it was necessary to reevaluate it herein for Balb-C mice.
The co-administration of the ligand P1 enhanced the overall excretion rate of radioactivity from whole animal body as efficiently as DFP, 24 and 48 h after administration. No significant differences in the radioactivity remaining in the carcass and in the rate of radioactivity elimination were found, except at 1 h.
The main differences in the distribution profile are related with the blood clearance and the hepatic uptake at 1 h. P1 induces slower clearance from blood as well as lower liver uptake than DFP at 1 h after administration, which may be attributed to the highest level of plasmatic protein binding, eventually due to the 2-hydroxymethyl group and to some minor decrease in the lipophilicity.
Overall, this biodistribution profile, similar to that of DFP, shows an increase of the radiotracer elimination rate and attests the ability of the ligand to chelate the radiometal in vivo.
Conclusions
P1 combines the hydroxypyridinone and catechol features: at low pH it coordinates efficiently with metal ions as 5-hydroxy-2-(hydroxymethyl)pyridin-4(1H)-one, while at basic pH as 2-(hydroxymethyl)pyridine-3,4-diol. The presence of hydroxymethyl group favours the tautomeric equilibrium in the free ligand, due to the formation of the hydrogen bond N1⋯H8. The tautomeric transformation in the presence of metal ions occurs at a lower pH than in the free ligand. On the basis of pFe3+ values, P1 should be considered a more efficient iron chelator (pFe3+ 22.0) than the clinically-used DFP (20.67),49 its 3,4-hopo analogues (20.77) and far more effective than catechol (pFe 14.7).58 The high pFe3+ value of P1 depends on two different factors, namely (i) the high stability of the iron complexes, mainly attributed to the tautomeric rearrangement of the pyridinone ligand into the catechol-like ligand; and (ii) the log![[thin space (1/6-em)]](https://www.rsc.org/images/entities/char_2009.gif) K 9.00 of P1, lower than that determined for deferiprone by 0.82 units. The chelating ability of P1 toward aluminium, copper and zinc ions is not higher than that of the corresponding DFP and 3,4-hopo, and this renders P1 a more selective iron chelator.
K 9.00 of P1, lower than that determined for deferiprone by 0.82 units. The chelating ability of P1 toward aluminium, copper and zinc ions is not higher than that of the corresponding DFP and 3,4-hopo, and this renders P1 a more selective iron chelator.
The bio-distribution studies on mice showed that P1 is as effective as clinically-used DFP, notwithstanding the negative charge on the complex existing at physiological pH (where the species modelled as [FeL3H2]− is prevalent) which could hinder to some extent the crossing of membranes, and thus iron excretion, suggesting that it is worthwhile to assess its in vivo efficacy after oral administration. The bioavailability parameters presented in Table 3 characterize P1 as a less effective compound than DFP, even if the difference between the parameters of H2La and H2Lb should mitigate this limit. The study of metabolism of P1 in living organisms could be of paramount importance, since it has been reported that 1′-hydroxyalkyl substituents prevent glucuronidation in vivo in hydroxypyridinones.
These overall promising results urge further studies to verify in vivo if the toxicity, bioavailability and pharmacokinetic properties of P1 can open a new way to future clinical trials.
Acknowledgements
GC and JIL acknowledge Regione Sardegna for the financial support CRP-27564. VMN and MAZ acknowledge Regione Sardegna for the financial support CRP-26712. DChL thanks the support of the Intramural CSIC project 201530E011. MAS acknowledges the Portuguese Foundation of Science and Technology (FCT) for the financial support to the project UID/QUO/00100/2013 and a fellowship to CQ.Notes and references
- Z. D. Liu, H. H. Khodr, D. Y. Liu, S. L. Lu and R. C. Hider, J. Med. Chem., 1999, 42, 4814–4823 CrossRef CAS PubMed.
- M. A. Santos, Coord. Chem. Rev., 2002, 228, 187–203 CrossRef.
- M. A. Santos, S. M. Marques and S. Chaves, Coord. Chem. Rev., 2012, 256, 240–259 CrossRef CAS.
- R. C. Scarrow, P. E. Riley, K. Abu-Dari, D. L. White and K. N. Raymond, Inorg. Chem., 1985, 24, 954–967 CrossRef CAS.
- P. S. Dobbin, R. C. Hider, A. D. Hall, P. D. Taylor, P. Sarpong, J. B. Porter, G. Xiao and D. van der Helm, J. Med. Chem., 1993, 36, 2448–2458 CrossRef CAS PubMed.
- B. L. Rai, L. S. Dekhordi, H. Khodr, Y. Jin, Z. Liu and R. C. Hider, J. Med. Chem., 1998, 41, 3347–3359 CrossRef CAS PubMed.
- I. Rogachevskii, V. Plakhova and T. Shelykh, Russ. J. Gen. Chem., 2009, 79, 104–116 CrossRef CAS.
- A. R. Katritzky, C. D. Hall, B. El-Gendy and B. Draghici, J. Comput.-Aided Mol. Des., 2010, 24, 475–484 CrossRef CAS PubMed.
- A. Albert and E. P. Serjeant, Ionization constants of acids and bases: a laboratory manual, Methuen, 1962 Search PubMed.
- L. Saghaie, M. Pourfarzam, A. Fassihi and B. Sartippour, Res. Pharm. Sci., 2013, 8, 233 CAS.
- S. Fakih, M. Podinovskaia, X. Kong, H. L. Collins, U. E. Schaible and R. C. Hider, J. Med. Chem., 2008, 51, 4539–4552 CrossRef CAS PubMed.
- APEX2, Software, V2014.11, Bruker AXS, Inc., Madison, Wisconsin, USA, 2014 Search PubMed.
- SADABS, Program for Empirical Absorption Correction of Area Detector Data, University of Goettingen, Germany, 2012 Search PubMed.
- G. M. Sheldrick, Acta Crystallogr., Sect. A: Found. Crystallogr., 2008, 64, 112–122 CrossRef CAS PubMed.
- S. Parsons and H. D. Flack, Acta Crystallogr., Sect. A: Found. Crystallogr., 2004, 60, s61 Search PubMed.
- A. J. C. Wilson, International Tables for Crystallography, Kluwer Academic Publishers, Dordrecht, The Netherlands, 1995 Search PubMed.
- A. L. Spek, Acta Crystallogr., Sect. D: Biol. Crystallogr., 2009, 65, 148–155 CrossRef CAS PubMed.
- O. V. Dolomanov, L. J. Bourhis, R. J. Gildea, J. A. Howard and H. Puschmann, J. Appl. Crystallogr., 2009, 42, 339–341 CrossRef CAS.
- V. M. Nurchi, G. Crisponi, J. I. Lachowicz, S. Murgia, T. Pivetta, M. Remelli, A. Rescigno, J. Niclós-Gutíerrez, J. M. González-Pérez and A. Domínguez-Martín, J. Inorg. Biochem., 2010, 104, 560–569 CrossRef CAS PubMed.
- http://www.hyperquad.co.uk/HQ2013.htm , 07-05-2015.
- P. Gans, A. Sabatini and A. Vacca, Ann. Chim., 1999, 89, 45–49 CAS.
- Bruker, ESI Compass 1.3; DataAnalysis Version 4.0 (Build 234) Daltonik GmbH http://www.bdal.com.
- M. A. Zoroddu, M. Peana and S. Medici, Dalton Trans., 2007, 379–384 RSC.
- A. G. Palmer, J. Cavanagh, P. E. Wright and M. Rance, J. Magn. Reson., 1991, 93, 151–170 CAS.
- L. Kay, P. Keifer and T. Saarinen, J. Am. Chem. Soc., 1992, 114, 10663–10665 CrossRef CAS.
- J. Schleucher, M. Schwendinger, M. Sattler, P. Schmidt, O. Schedletzky, S. J. Glaser, O. W. Sørensen and C. Griesinger, J. Biomol. NMR, 1994, 4, 301–306 CrossRef CAS PubMed.
- T. L. Hwang and A. Shaka, J. Magn. Reson., Ser. A, 1995, 112, 275–279 CrossRef CAS.
- M. A. Zoroddu, S. Medici, M. Peana and R. Anedda, Dalton Trans., 2010, 39, 1282–1294 RSC.
- S. Medici, M. Peana, L. G. Delogu and M. A. Zoroddu, Dalton Trans., 2012, 41, 4378–4388 RSC.
- M. Remelli, M. Peana, S. Medici, L. G. Delogu and M. A. Zoroddu, Dalton Trans., 2013, 42, 5964–5974 RSC.
- M. F. Peana, S. Medici, A. Ledda, V. M. Nurchi and M. A. Zoroddu, Sci. World J., 2014, 2014 Search PubMed.
- V. M. Nurchi, G. Crisponi, M. Arca, M. Crespo-Alonso, J. I. Lachowicz, M. A. Zoroddu, M. Peana, G. Pichiri, M. A. Santos, S. M. Marques, J. Niclos-Gutierrez, M. J. Gonzalez-Perez, A. Dominguez-Martin, D. Choquesillo-Lazarte, Z. Szewczuk, D. Mansoori and L. Toso, J. Inorg. Biochem., 2014, 141, 132–143 CrossRef CAS PubMed.
- M. Peana, S. Medici, V. M. Nurchi, J. I. Lachowicz, G. Crisponi, M. Crespo-Alonso, M. A. Santos and M. A. Zoroddu, J. Inorg. Biochem., 2015, 148, 69–77 CrossRef CAS PubMed.
- T. D. Goddard and D. G. Kneller, Sparky – NMR Assignment and Integration Software, Version 3.11, University of California, San Francisco, CA, 2008 Search PubMed.
- W. Koch and M. C. Holthausen, A chemist's guide to density functional theory, Wiley-Vch, Weinheim, 2001 Search PubMed.
- M. J. Frisch, G. W. Trucks, H. B. Schlegel, G. E. Scuseria, M. A. Robb, J. R. Cheeseman, G. Scalmani, V. Barone, B. Mennucci, G. A. Petersson, H. Nakatsuji, M. Caricato, X. Li, H. P. Hratchian, A. F. Izmaylov, J. Bloino, G. Zheng, J. L. Sonnenberg, M. Hada, M. Ehara, K. Toyota, R. Fukuda, J. Hasegawa, M. Ishida, T. Nakajima, Y. Honda, O. Kitao, H. Nakai, T. Vreven, J. A. Montgomery, Jr., J. E. Peralta, F. Ogliaro, M. Bearpark, J. J. Heyd, E. Brothers, K. N. Kudin, V. N. Staroverov, R. Kobayashi, J. Normand, K. Raghavachari, A. Rendell, J. C. Burant, S. S. Iyengar, J. Tomasi, M. Cossi, N. Rega, J. M. Millam, M. Klene, J. E. Knox, J. B. Cross, V. Bakken, C. Adamo, J. Jaramillo, R. Gomperts, R. E. Stratmann, O. Yazyev, A. J. Austin, R. Cammi, C. Pomelli, J. W. Ochterski, R. L. Martin, K. Morokuma, V. G. Zakrzewski, G. A. Voth, P. Salvador, J. J. Dannenberg, S. Dapprich, A. D. Daniels, Ö. Farkas, J. B. Foresman, J. V. Ortiz, J. Cioslowski and D. J. Fox, Gaussian 09, Rev. A.02, Gaussian, Inc., Wallingford CT, 2009 Search PubMed.
- C. Adamo and V. Barone, J. Chem. Phys., 1998, 108, 664–675 CrossRef CAS.
- A. Schäfer, H. Horn and R. Ahlrichs, J. Chem. Phys., 1992, 97, 2571–2577 CrossRef.
- A. E. Reed, R. B. Weinstock and F. Weinhold, J. Chem. Phys., 1985, 83, 735–746 CrossRef CAS.
- K. B. Wiberg, Tetrahedron, 1968, 24, 1083–1096 CrossRef CAS.
- J. Tomasi, B. Mennucci and R. Cammi, Chem. Rev., 2005, 105, 2999–3094 CrossRef CAS PubMed.
- R. Dennington, T. Keith and J. Millam, GaussView, Version 5.0.8, Semichem Inc., Shawnee Mission, KS, 2009 Search PubMed.
- G. Schaftenaar and J. H. Noordik, J. Comput. – Aided Mol. Des., 2000, 14, 123–134 CrossRef CAS PubMed.
- R. Grazina, L. Gano, J. Šebestík and M. A. Santos, J. Inorg. Biochem., 2009, 103, 262–273 CrossRef CAS PubMed.
- C. A. Lipinski, F. Lombardo, B. W. Dominy and P. J. Feeney, Adv. Drug Delivery Rev., 2012, 64, 4–17 CrossRef.
- A. Leo, C. Hansch and D. Elkins, Chem. Rev., 1971, 71, 525–616 CrossRef CAS.
- J. Bernstein, R. E. Davis, L. Shimoni and N. L. Chang, Angew. Chem., Int. Ed., 1995, 34, 1555–1573 CrossRef CAS.
- J. Lokaj, J. Kožíšek, B. Koreň, M. Uher and V. Vrabel, Acta Crystallogr., Sect. C: Cryst. Struct. Commun., 1991, 47, 193–194 CrossRef.
- V. M. Nurchi, G. Crisponi, T. Pivetta, M. Donatoni and M. Remelli, J. Inorg. Biochem., 2008, 102, 684–692 CrossRef CAS PubMed.
- H. Stunzi, L. Harris, D. Perrin and T. Teitei, Aust. J. Chem., 1980, 33, 2207–2220 CrossRef.
- E. Spinner and J. White, J. Chem. Soc. B, 1966, 991–995 RSC.
- V. M. Nurchi, J. I. Lachowicz, G. Crisponi, S. Murgia, M. Arca, A. Pintus, P. Gans, J. Niclos-Gutierrez, A. Domínguez-Martín, A. Castineiras, M. Remelli, Z. Szewczuk and T. Lis, Dalton Trans., 2011, 40, 5984–5998 RSC.
- J. J. Molenda, M. A. Basinger, T. P. Hanusa and M. M. Jones, J. Inorg. Biochem., 1994, 55, 131–146 CrossRef CAS PubMed.
- J. Charalambous, A. Dodd, M. McPartlin, S. O. Matondo, N. D. Pathirana and H. R. Powell, Polyhedron, 1988, 7, 2235–2237 CrossRef CAS.
- QikProp, Version 2.5, LCC, New York, NY, 2005 Search PubMed.
- S. Chaves, A. Capelo, L. Areias, S. M. Marques, L. Gano, M. A. Esteves and M. A. Santos, Dalton Trans., 2013, 42, 6033–6045 RSC.
- L. Toso, G. Crisponi, V. M. Nurchi, M. Crespo-Alonso, J. I. Lachowicz, D. Mansoori, M. Arca, M. A. Santos, S. M. Marques, L. Gano, J. Niclós-Gutíerrez, J. M. González-Pérez, A. Domínguez-Martín, D. Choquesillo-Lazarte and Z. Szewczuk, J. Inorg. Biochem., 2014, 130, 112–121 CrossRef CAS PubMed.
- V. M. Nurchi, T. Pivetta, J. I. Lachowicz and G. Crisponi, J. Inorg. Biochem., 2009, 103, 227–236 CrossRef CAS PubMed.
Footnotes |
| † Electronic supplementary information (ESI) available. CCDC 1056172. For ESI and crystallographic data in CIF or other electronic format see DOI: 10.1039/c6dt00129g |
| ‡ Average metric parameters calculated from a search on the Cambridge Crystallographic Database (CSD 5.36 updated Nov. 2014) on entries with ref. code: MOMLOR, BICSEL, CEZYIR, FUDRUR, FUDRUR10, GARWUR, GARWUR, JUTVOJ, JUTWAW, JUTWEA, KCATFE, SUCCUO, SUCDAV, SUCDAV10, WEDDUF (CQ 1.17 build RC5). |
| This journal is © The Royal Society of Chemistry 2016 |


