
 Open Access Article
 This Open Access Article is licensed under a Creative Commons Attribution-Non Commercial 3.0 Unported Licence
Optical contrast and cycling of bistable luminescence properties in Rb2KIn(1−x)CexF6 compounds†
Lucile
Cornu
ab,
Manuel
Gaudon
ab,
Olivier
Toulemonde
ab,
Philippe
Veber
ab and
Véronique
Jubera
*ab
aCNRS, ICMCB, UPR 9048, F-33600 Pessac, France
bUniv. Bordeaux, ICMCB, UPR 9048, F-33600 Pessac, France. E-mail: veronique.jubera@u-bordeaux.fr; manuel.gaudon@u-bordeaux.fr
First published on 13th January 2016
Abstract
Irradiation cycling was performed to evaluate the ageing of the redox process observed on cerium-doped Rb2KInF6 compounds. An on–off switch of monovalent indium luminescence is observed for the lowest cerium doped material, whereas a nice colourimetric contrast between a bluish-green and orange emission is generated for the material with the highest cerium content. Photoluminescent properties combined with X-ray diffraction, chemical analysis and magnetism measurements allowed an accurate characterization of the system. A complete explanation of the optical behaviour is therefore proposed. Finally, printing tests were performed to illustrate the good functionality of the prepared materials for UV sensitivity.
Introduction
The elpasolite-type materials are widely studied,1 and used in various areas such as laser devices,2,3 quantum cutters,4 neutron and gamma detectors,5 and light-emitting diodes.6 Applications are also found for data storage and medical radiation detection devices.7,8 These matrices of general formula A2BB′X6 offer a wide variety of compositions: chloride, bromide and fluoride, with their various associated properties.9–12 A and B elements belong to the alkali group, B′ is a transition metal and X is a halogen.13 At room temperature, the elpasolite-type structure crystallizes in the Fm![[3 with combining macron]](https://www.rsc.org/images/entities/char_0033_0304.gif) m space group and exhibits two types of metal sites with octahedral and cuboctahedron geometry.14 The B and B′ cations are located at the 4b and 4b Wyckoff positions and A in the 8c position. In one previous study on Rb2KInF6
m space group and exhibits two types of metal sites with octahedral and cuboctahedron geometry.14 The B and B′ cations are located at the 4b and 4b Wyckoff positions and A in the 8c position. In one previous study on Rb2KInF6![[thin space (1/6-em)]](https://www.rsc.org/images/entities/char_2009.gif) :Ce3+ compounds, halogen anions were assigned to occupy the 24e position,14 but we have demonstrated that the fluorine ions can be distributed around this average position, e.g., occupying the four sub-positions 96j with 1/4 occupancy preferentially in a random way.15 These considerations provide the understanding of the stabilization process of the structure despite a tolerance factor significantly below 1. Actually, octahedral tilts generate a relaxation of the steric constraints because the B and B′ cations are much too big in comparison to the A cation. A better fit of the experimental cation valences to the theoretical values is therefore obtained. In addition, for an elpasolite matrix doped with optically active cations, optical properties are closely linked with the luminescent cation distribution in the different sites of the structure. Various emission wavelengths can be obtained as demonstrated in a previous study.7,15 These materials also show photo-chromo-luminescent properties, resulting in a variation of emission wavelengths after UV radiation exposure. These results reflect the variation of the oxidation state of the cerium and indium cations, according to the equation 2Ce3+ + In3+ ↔ 2Ce4+ + In+. Depending on the irradiation wavelength, the redox reaction can occur in the direct or the reverse sense; the emission wavelength variation is due to the optical properties of Ce3+ and In+ luminescence characteristics. An In+ orange-red emission appears after a few minutes under UV exposure, linked with the increase of the monovalent indium concentration. As this redox phenomenon is reversible, the In+ emission can be switched off using an irradiation at a higher energy. Here, the impact of the synthesis protocol and the percentage of cerium introduced on the photochromism will be discussed. First, the luminescent properties of Rb2KIn(1−x)CexF6 elpasolite compounds with different “target” Ce3+ concentrations (x = 0.02 and 0.10) are investigated. The concentration of the trivalent cerium actually introduced into our matrixes is then determined using coupling X-ray diffraction, ICP spectroscopy and magnetic measurements. New optical properties are observed and fully discussed with regard to the X-ray diffraction and the magnetic analyses. Finally, the potentiality of the compounds to be used as photosensors is evaluated from cyclability tests on the powder and printing tests on monocrystals.
:Ce3+ compounds, halogen anions were assigned to occupy the 24e position,14 but we have demonstrated that the fluorine ions can be distributed around this average position, e.g., occupying the four sub-positions 96j with 1/4 occupancy preferentially in a random way.15 These considerations provide the understanding of the stabilization process of the structure despite a tolerance factor significantly below 1. Actually, octahedral tilts generate a relaxation of the steric constraints because the B and B′ cations are much too big in comparison to the A cation. A better fit of the experimental cation valences to the theoretical values is therefore obtained. In addition, for an elpasolite matrix doped with optically active cations, optical properties are closely linked with the luminescent cation distribution in the different sites of the structure. Various emission wavelengths can be obtained as demonstrated in a previous study.7,15 These materials also show photo-chromo-luminescent properties, resulting in a variation of emission wavelengths after UV radiation exposure. These results reflect the variation of the oxidation state of the cerium and indium cations, according to the equation 2Ce3+ + In3+ ↔ 2Ce4+ + In+. Depending on the irradiation wavelength, the redox reaction can occur in the direct or the reverse sense; the emission wavelength variation is due to the optical properties of Ce3+ and In+ luminescence characteristics. An In+ orange-red emission appears after a few minutes under UV exposure, linked with the increase of the monovalent indium concentration. As this redox phenomenon is reversible, the In+ emission can be switched off using an irradiation at a higher energy. Here, the impact of the synthesis protocol and the percentage of cerium introduced on the photochromism will be discussed. First, the luminescent properties of Rb2KIn(1−x)CexF6 elpasolite compounds with different “target” Ce3+ concentrations (x = 0.02 and 0.10) are investigated. The concentration of the trivalent cerium actually introduced into our matrixes is then determined using coupling X-ray diffraction, ICP spectroscopy and magnetic measurements. New optical properties are observed and fully discussed with regard to the X-ray diffraction and the magnetic analyses. Finally, the potentiality of the compounds to be used as photosensors is evaluated from cyclability tests on the powder and printing tests on monocrystals.
Experimental section
Materials and methods
m space group corresponding to the elpasolite structure.
Experimental results
Structural analyses
The X-ray data obtained on a crushed LC (targeted concentration equal to 2%) and HC (targeted concentration equal to 10%) single crystal illustrate a pure elpasolite phase (Fig. 1). | ||
| Fig. 1 Rietveld diffraction pattern refinements illustrated on Rb2KInF6: Ce (a) LC crystal (targeted concentration equal to 2%) and (b) HC crystal (targeted concentration equal to 10%). | ||
Fig. S1† shows the platinum crucible after the two crystal growth attempts and the as-grown Ce-doped single crystals. Single crystals are located on the border of the crucible, whereas an opaque zone is visible in the centre (zone inside the dotted line). These solid residues were analysed by X-ray diffraction: polycrystalline mixtures were detected. These polycrystalline mixtures were composed of the Rb2KInF6 elpasolite phase as the main phase and secondary KCe2F9 (JCPDS no. 00-025-0632) and RbIn3F10 (00-028-0908) phases for the batch with the lowest cerium content and KCeF4 (no. 00-025-0585) and RbIn3F10 (no. 00-028-0908) phases for the batch with the highest cerium content. The single crystal parts crushed for the X-ray analyses reported in Fig. 1a and b are peripheral colourless single crystal parts.
The evolution of the a cell parameter (see Table 1) of the Ce-doped Rb2KInF6 compounds confirms the introduction of at least a significant fraction of the cerium ions into the host lattice. Comparison between LC and HC crushed crystal refinements also indicates that the rate of cerium that is really introduced varies as a function of the target doping value. The cation-fluorine distances in the octahedral environment have been modified, especially the increase of the In–F distances versus the cerium target doping value. This last observation shows the preferential incorporation of the cerium ions into the indium Wyckoff positions. The small proportion of cerium located on the cuboctahedron site detected in previous optical characterizations does not impact these structural data.15
As the X-Ray analysis performed after crystal growth indicates a segregation of cerium in the KCeF4, KCe2F9 and probably in the RbIn3F10 phases, chemical analyses were run to determine the cerium content within the single crystals. The results obtained for LC and HC single crystals are reported in Table 2. Cerium, indium, potassium and rubidium elements were analysed, and the titration was repeated twice (i.e., two different solutions were prepared).
| Solution 1 | Solution 2 | ||||
|---|---|---|---|---|---|
| Elements | [Mn+]Theo (mg L−1) | [Mn+]Exp (mg L−1) | [Mn+]Theo (mg L−1) | [Mn+]Exp (mg L−1) | |
| LC Ce- doped crystal | Ce | 4.64 | 0.64 | 0.93 | 0.04 |
| ODLMINa |
ODLMINa |
||||
| In | 186.4 | 176.71 | 37.5 | 40.35 | |
| K | 64.8 | 63.7 | 12.8 | 12.08 | |
| Rb | 283 | 228.74 | 56.6 | 51.79 | |
| ODLMAXa |
|||||
| Molar % of Ce total | 2% | 0.3% | 2% | 0.08% | |
| ODLMINa |
ODLMINa |
||||
| Solution 1 | Solution 2 | ||||
|---|---|---|---|---|---|
| Elements | [Mn+]Theo (mg L−1) | Exp [Mn+]sol1 (mg L−1) | [Mn+]Theo (mg L−1) | Exp [Mn+]sol2 (mg L−1) | |
| a ODL: Over Detection Limit. | |||||
| HC Ce-doped crystal | Ce | 15.87 | 7.00 | 3.18 | 1.39 |
| In | 127.4 | 115.80 | 25.49 | 24.15 | |
| K | 44.28 | 45.29 | 8.86 | 8.42 | |
| Rb | 193.6 | 178.65 | 38.60 | 36.56 | |
| ODLMAXa |
|||||
| Molar % of Ce total | 10% | 4.73% | 10% | 4.50% | |
As indicated in Table 2, the experimental and theoretical titrations of indium, potassium and rubidium elements are equivalent, but the real relative content of cerium is 50% less important than the target content for HC Ce-doped crystals: the average calculated molar percentage of cerium obtained on two titrations is equal to 4.6% instead of 10 mol%. The titration experiments were performed on the 2 mol% Ce-doped compound, but the very low cerium concentration of the prepared solutions ([Ce < 1%]) in comparison with the other element concentrations (Rb, K, In) leads to divergent values for the cerium content. Considering these data, one can confirm that the crystal growth induces a loss of about half of the rare earth ions due the purification of the elpasolite host in favour of Ce-rich secondary phases.
Optical properties
The luminescence of the Rb2KInF6:Ce3+ material is due mainly to the presence of trivalent cerium, as described in our previous published study on a Ce-doped single crystal.7,15 The integration of cerium cations occurs in both the octahedral (indium site) and cuboctahedral (rubidium site) polyhedra of the elpasolite structure. The first one is maximum at around 480 nm (20830 cm−1) whereas the second band is much weaker in intensity and points in the UV range at 340 nm (29410 cm−1). As the cerium content of the HC crystal is much higher than the previous LC studied crystal, local disorders are expected and it is worthy to re-investigate the impact of the substitution within the host, on the optical properties.
The room temperature excitation and emission graphs of the LC ([Ce] < 1% molar) and HC ([Ce] = 4.6% molar) cerium-doped crystals are illustrated in Fig. 2. The description of the emission properties will be focussed on the visible range and the UV contribution of cerium ions in the cuboctahedron site will not be reported as it is not affected by the irradiation.7,15
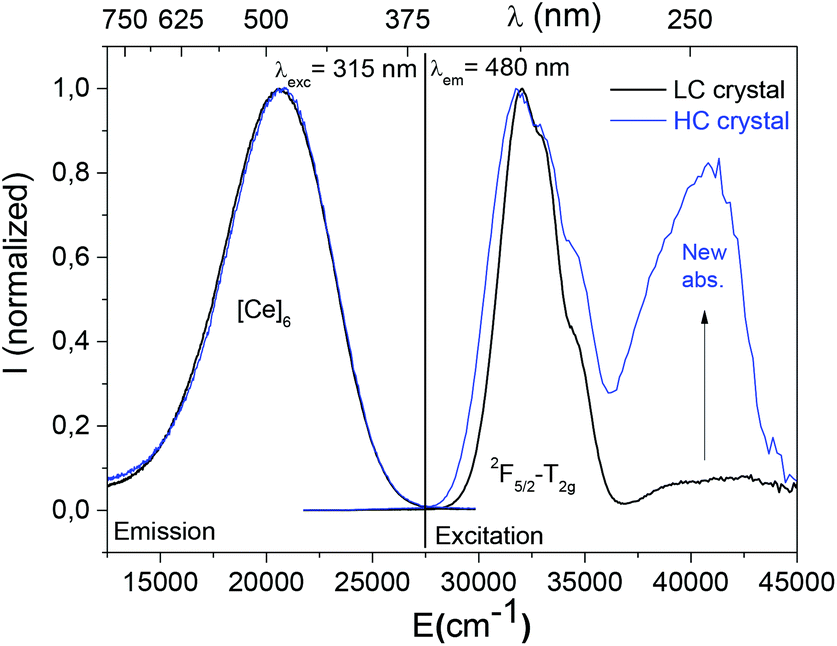 | ||
| Fig. 2 Room temperature luminescence spectra of LC ([Ce] < 1%) (black curves) and HC ([Ce] < 4.6%) (blue curves) Ce-doped Rb2KInF6 single crystal (λexc = 315 nm, λem = 480 nm). | ||
The detected visible emission centred at 480 nm (20830 cm−1) and observed with an excitation at 315 nm (31745 cm−1) has been attributed to the location of trivalent cerium in the six-fold coordinated site ([Ce]6). The excitation curves associated with the emission at 480 nm (20830 cm−1) show the splitting of the different 5d T2g levels of trivalent cerium between 280 nm and 340 nm, which corresponds to the contribution of trivalent cerium to the octahedral environment. Surprisingly even if the shape of the emission band is equivalent for both crystals, the corresponding excitation curves revealed a new contribution at 255 nm (39215 cm−1) of the HC crystal. This additional absorption band reflects the existence of a new emitting centre.
The visible emission observed under 255 nm (39215 cm−1) excitation beam, is shown in Fig. 3. An intense green contribution labelled [?] appears as a large band pointing at 510 nm (19600 cm−1) on the HC crystal emission curve whereas no signal is detected on the LC material. Because of the overlap between the [?] contribution and the 480 nm emission of cerium ions in the indium octahedral site, absorption of the 5d T2g levels are also visible in excitation spectra performed at λem equal to 510 nm.
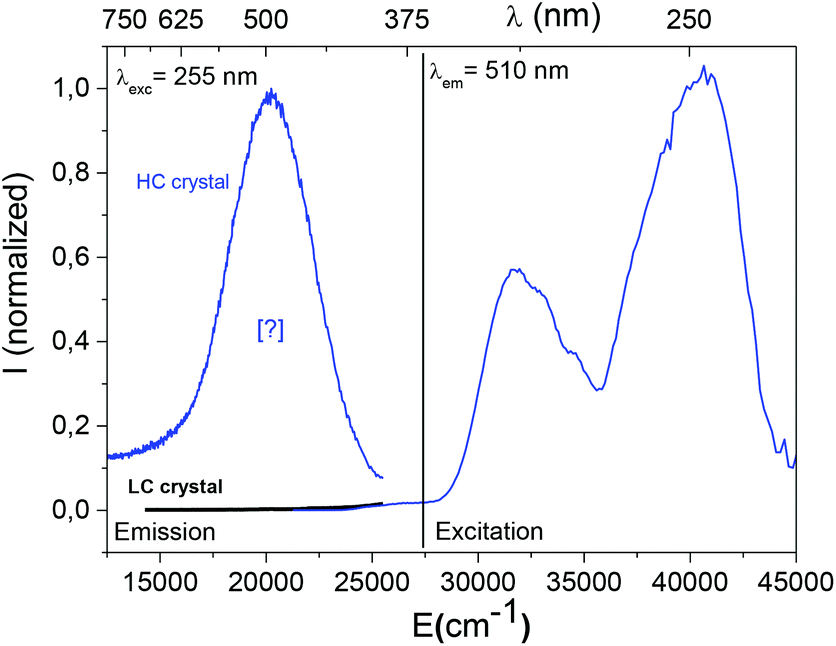 | ||
| Fig. 3 Emission spectrum of a <1% (LC) Ce-doped Rb2KInF6 single crystal (black curve) under 255 nm excitation beam and luminescence spectra 4.6% (HC) Ce-doped Rb2KInF6 single crystal (blue curves) (λexc = 255 nm, λem = 510 nm). | ||
The initial raw powder prepared for the HC crystal growth was controlled to check its spectral fingerprint under the same irradiation conditions. But, no emission was detected in the visible range under a 255 nm excitation beam. The crystal growth induces local modifications that stabilize a new emitting centre.
To better understand the origin of this new luminescent centre, comparison with visible optical properties obtained on a material after an irradiation step of 2 hours at 315 nm was performed. As this material is sensitive to UV irradiation, when it is exposed to a 315 nm excitation beam (irradiation process), the intensity of the emission peak associated with the six-fold coordinated cerium ions (located on the indium Wyckoff positions) decreases, whereas a red emission appears at 650 nm under excitation at 255 nm following the equilibrium 2Ce3+ + In3+ → 2Ce4+ + In+. This last orange emission has already been shown to be due to monovalent In+ cations in the octahedral site of the elpasolite structure.7
The excitation and emission graphs performed on the irradiated HC crystal are shown in Fig. 4.
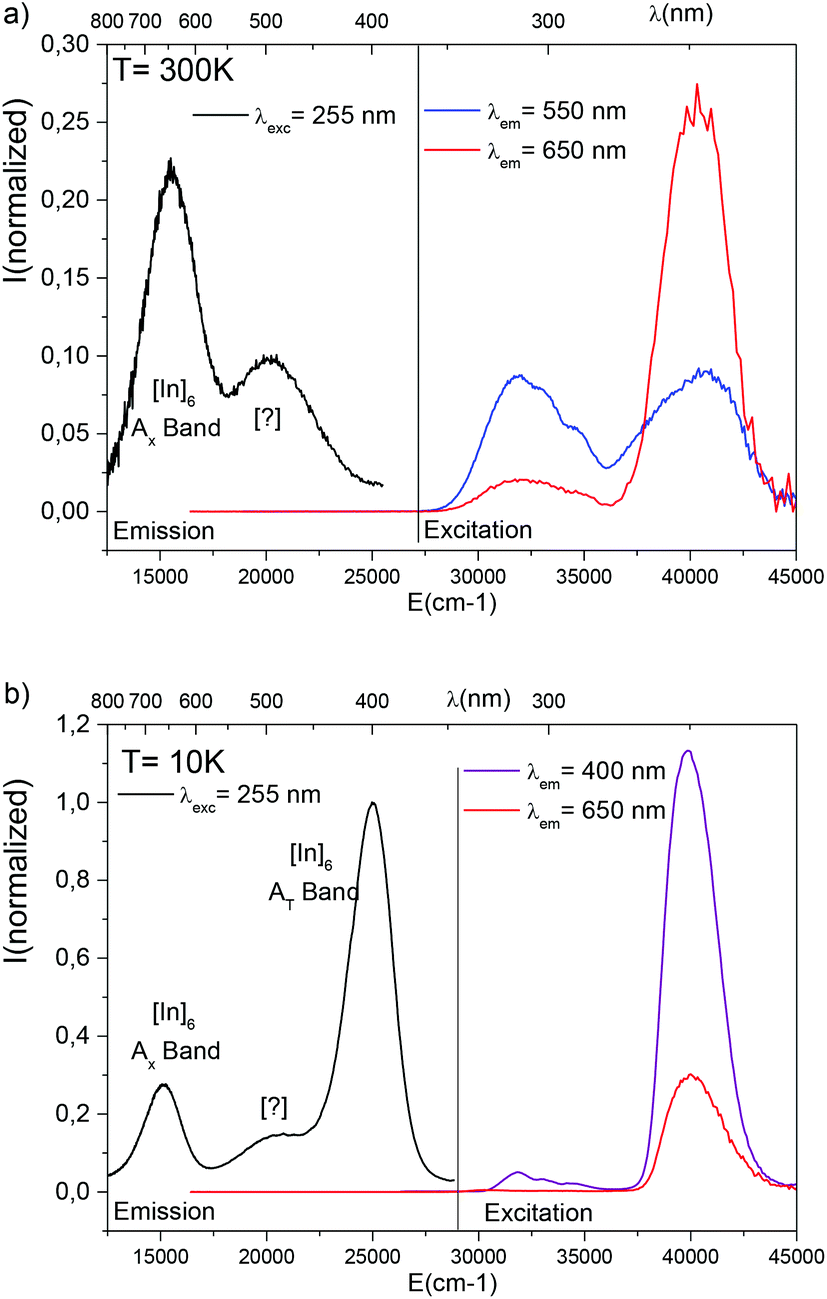 | ||
| Fig. 4 Room (a) and low temperature (10 K) (b) luminescence spectra after a 2-hour irradiation at 315 nm showing the contribution of the indium ions reduced under the UV beam on the 4.6% cerium content Rb2KInF6 crushed crystal (HC). | ||
An excitation at 255 nm reveals two components in the emission spectrum: the new [?] contribution peaking at 510 nm, which seems not to be affected by the temperature, and the monovalent indium contribution composed of the AT band (400 nm/25000 cm−1) detected only at low temperatures and the AX band (at approximately 650 nm/15300 cm−1).15,17,18 The excitation spectra that correspond to the monovalent indium absorption (λem = 400 nm, 650 nm) are formed by a unique band at 255 nm (39215 cm−1) that peaks in the same energy range as the range of the new emitting centre.
Magnetism
To determine the ratio of Ce3+/Ce4+ ions in the crystals, magnetization versus applied magnetic field measurements were performed. Plotted in Fig. S2† is the magnetization corrected from the sample holder and the host diamagnetic signal versus the H/T ratio for data collected at 2 K, 3 K and 5 K on the crushed LC and HC single crystals. The as-highlighted paramagnetic signal is due only to Ce3+ in relation to its 4f1 configuration (J = 5/2).To analyse the H/T ratio dependence of the magnetic signal more deeply, the collected data were fitted by the Brillouin function. The magnetization is given by M = NAgJμBBJ(x) with NA: Avogadro's number, g: the effective g-value, J: the total angular moment, μB: the Bohr magneton, x: the gJμBHz/kBT ratio (with Hz the applied magnetic field and T the temperature) and BJ (x): the Brillouin function defined by:

The fitted parameter, i.e., the g-value, and the percentage of trivalent cerium contributed to the signal are given in Table 3. The angular momentum was fixed at 5/2.
| Sample | Ce (≪1%) crystal growth | Ce 4.6% crystal growth |
|---|---|---|
| g | 1.36 | 0.78 |
| % Ce(III) | 0.081 | 0.348 |
From the ICP results, a low cerium content is expected, and our results showed that most of the cerium is diamagnetic with an oxidation state of Ce4+. Considering the HC Ce-doped compound, a total Ce3+ ion concentration of 0.348% was found in the single crystals, which is far from the total cerium concentration rate of 4.6% determined by chemical analysis. Only 7.5% of the cerium is stabilized at the oxidation number III. The trivalent cerium concentration for the LC Ce-doped material was evaluated at 0.081%, i.e., approximately four times lower than for the HC Ce-doped samples. The discrepancies shown by the g-values are interesting. For a free Ce3+ ion, a value of 6/7 is expected for the Landé factor where the g-value can differ from gJ due to a crystal field effect that splits the ground state into doublets. A g-value of 1.16 was obtained for Ce3+-doped Sr0.61Sr0.39Nb2O6 showing a 3D network of NbO6 octahedra linked by their corners forming alternating five-and four-membered rings.19
Discussion
All of these characterizations converge towards a lower rate of occurrence of the cerium element in the crushed crystals in comparison with the target rate (i.e., the initial rate introduced in the starting solution used as the co-precipitation medium). Indeed, the crystal growth purifies the elpasolite host lattice by favouring the spatial segregation of the secondary phases as KCeF4, KCe2F9 and RbIn3F10. Unfortunately, these separated secondary phases are cerium-rich phases. The magnetism measurements indicate that the main parts of the cerium ions inside the crystals are not magnetic: they are stabilized mainly with the +IV oxidation number (92.5% in the HC Ce-doped crystals).The crystal growth step seems to favour the oxidation of the doping element. In previous work,15 DFT calculation was used to show that the cerium ions located in the indium site are under an oxidative stress, which was not confirmed at this time, by magnetic measurements. To compensate for the excess of positive charge, the structure may induce punctual defects such as substitution of O2− anions on F− sites, cationic vacancy on the alkali sites or reduction of neighbour cations such as indium. Indeed, in cerium-doped fluorine compounds such as SrAlF5 or LaF3, red-shifted cerium emission bands have been reported. The origins of these cerium emission bands are due to perturbed cerium ions. These specific sites are formed by a fluorine defect that is charge-compensated by the presence of oxygen anions in the matrix. In this case, the corresponding excitation spectra are composed of several bands, the first band being shifted to the lower energy.20,21 The second hypothesis concerns the alkali vacancies. They are not predominant, as the chemical analysis results did not indicate any deficit in potassium or rubidium elements. Finally, the possibility that indium ions are initially in the monovalent oxidation state in the single crystals is considered. The existence of such a centre may have a direct impact on the luminescence properties. Considering all of the data exposed, we can discard the oxygen-type defect as the excitation band peaks at 255 nm. The chemical analyses, the large Stokes shift calculated (approximately 20000 cm−1) between the excitation and absorption band of the blue-green new emission, the facts that it is detected at room temperature and almost not affected by the temperature and irradiation exposure seem to eliminate punctual defects as alkali vacancies in the array as the origin of the phenomenon. The more valid hypothesis is based on the reduction of trivalent indium. Contrary to what is observed for the indium ions in the octahedral environment, no indication of the splitting of the excited levels in AT and AX bands is detected on the excitation or emission graphs performed at low temperature, implying that the reduced centres that appear after crystal growth are not in the same octahedral environment as the monovalent indium ions reduced after the 315 nm irradiation step. Because the crystal growth is a lengthy process, one can suggest that crystal growth allows the mobility of cations in the structure and stabilizes the monovalent indium element in the biggest host site of the structure (i.e., the cuboctahedral site). No splitting of the excited states is expected in this symmetry. Because the proximity to the cerium element is different from the proximity of the indium ions localized in their expected crystallographic position, no electron transfer is optically initiated between these new reduced cations and the rare earth elements. The stability of these centres under irradiation should therefore be explained. The lack of additional emission in the LC cerium doped single crystals can be justified by the concentration of cerium ([≪1%]) within the grown materials that is too low. As a reminder, magnetic measurements have indicated a value of 0.081% of trivalent cerium.
Note: considering the allowed 5s–5p transitions of monovalent indium, a short lifetime of this new luminescent centre is expected but the recording of this emission cannot be performed as this new emitting centre and [Ce]6 ions ranges in the same energy domain, the optical instability of the latter preventing a correct measurement.
Cyclability test
The following irradiation cycles were applied to the two HC (0.348% Ce3+ content) and LC (0.081% Ce3+ content) doped single crystals. The crushed single crystals were successively exposed for 1 hour at 315 nm, then 1 hour at 255 nm, and so on for six cycles. The raw crystals (not irradiated) are associated to the t0 emission curve (and the cycle noted 0); after 1 hour irradiation at 315 nm, the samples are associated to the t1 curve (cycle 1); the samples obtained after the 1st cycle of irradiation were newly irradiated 1 hour at 255 nm (t2 curve, cycle 2), and so on for six cycles. Whatever the irradiation cycle, the emission spectra were recorded at a fixed excitation wavelength of 255 nm.
Fig. 5 illustrates the emission properties with excitation at 255 nm and the corresponding variation of the integrated area as a function of the cycling step. The black emission curve illustrates the optical response of the raw crystals under a 255 nm (t0). The red curve was performed under the same experimental excitation (λexc = 255 nm) after a 1 hour irradiation at 315 nm of the sample (t1). Finally, the blue curve emission (t2) illustrates the re-oxydation of the monovalent indium associated with the disappearance of the orange band. The global integrated area of the emission curves were calculated in the 400 nm–800 nm range. The corresponding values are reported as black dot in Fig. 5b and 5d, at the end of each irradiation step. Photographs of the crushed HC and LC crushed Ce-doped crystals under a 255 excitation beam are shown in parallel for each step.
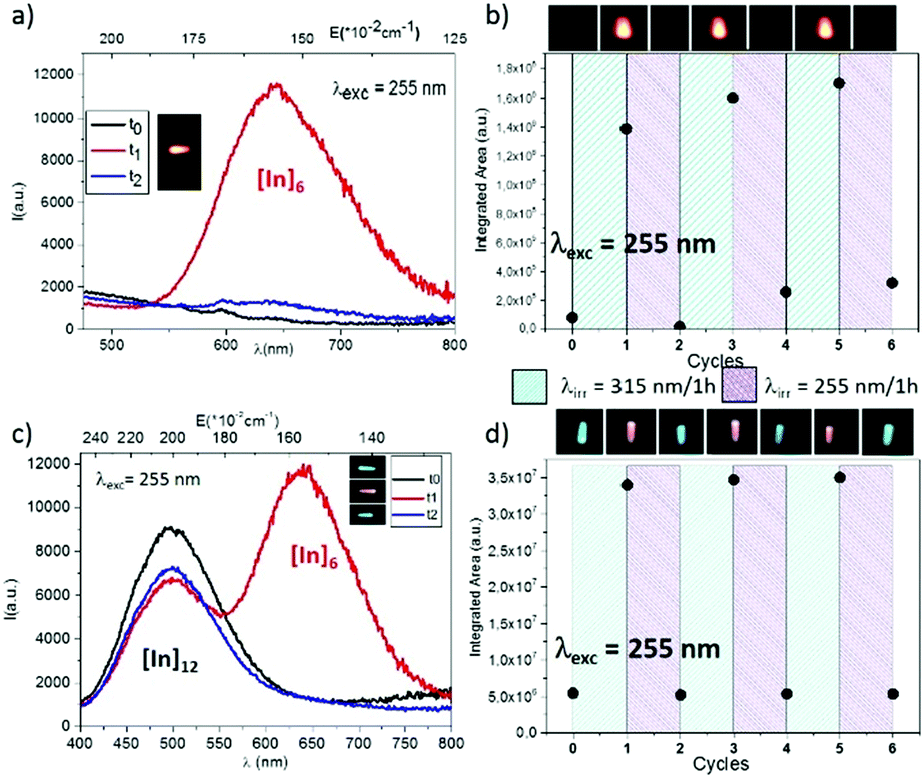 | ||
| Fig. 5 Ce-doped Rb2KInF6 emission characterization. (a) Ce3+ 0.081% (LC crystal) emission spectra at different cycle steps under λexc = 255 nm, (b) integrated area of emission curves with powder photographs of the LC crushed crystal under λexc = 255 nm, (c) Ce3+ 0.348% (HC crystal) emission spectra at different cycle steps under λexc = 255 nm, (d) integrated area of emission curves with powder photographs of the HC crushed crystal under λexc = 255 nm. | ||
The “on–off” phenomenon of the In+ generated under irradiation is mostly reversible. The lowest cerium content single crystal (LC) shows an orange luminescence that is fully erased by the reverse irradiation cycle (1 hour irradiation at 255 nm performed after the 1 hour irradiation at 315 nm). The calculated trichromatic coordinates are x = 0.462 and y = 0.357. The highest cerium content crystal (HC) alternatively shows a bluish-green (0.2238, Y = 0.3639) and a yellowish-orange (x = 0.3549, y = 0.3826) luminescence due to the contribution of the new emitting centre. A “nice switch” between two visible colours is therefore obtained for the HC Ce-doped crystals. For both materials, the proportion of neighbour trivalent cerium and indium cations is sufficient to make possible the 2Ce3+ + In3+ ↔ 2Ce4+ + In+ redox process.
As a complement, thermal tests (10 minutes of heat treatment at each temperature and cooling to room temperature between two thermal steps) were performed to check the effect of temperature on the reversible redox process. Samples irradiated for 2 hours at 315 nm were prepared to stabilize In+ ions. These samples were heated successively at different temperatures between 25 °C and 200 °C, and the system was cooled between each of the thermal steps to record the room temperature emissions observed under a 255 nm excitation beam.
Results are illustrated in Fig. 6. As shown, a total erasure of the monovalent indium luminescence generated (in an octahedral environment) is obtained under a heat treatment at 200 °C.
 | ||
| Fig. 6 Room temperature emission graphs under a 255 nm excitation beam obtained after a 2-hour irradiation at 315 nm. The irradiated crushed crystals were successively heated from 25 °C to 200 °C under a reductive atmosphere of Ar/H2 10%. (a) 0.081% of Ce3+ content (LC) and (b) 0.348% of Ce3+ content (HC). | ||
In addition, room temperature kinetic tests were also performed to follow the decrease of the Ce3+ emission under a 315 nm irradiation beam under argon, nitrogen, oxygen and argon/hydrogen atmospheres. No significant difference was observed, which confirms that the redox phenomenon is totally independent from the atmosphere (see ESI, Fig. S3†).
Three types of areas are presented in Fig. 7: white areas were not exposed to UV radiation (reference), the red areas were exposed to irradiation at 315 nm, and the blue areas were irradiated successively at 315 nm and 255 nm. These results show that the pattern can be printed and erased, and considering the cyclability test results, this cycle can be repeated at least three times. Moreover, even if the irradiated materials are stored in air, sheltered from UV irradiation, the exposed zones are very stable, as the control of a twenty-year irradiated single crystal still reveals the orange emission of monovalent indium.
 | ||
| Fig. 7 Printing tests performed on single crystals. Photographs of Ce-doped Rb2KInF6 single crystals after several irradiation processes. | ||
Conclusions
X-Ray diffraction, chemical analyses and magnetism confirmed the cerium doping of the Rb2KInF6 single crystal grown through a Bridgman technique. Surprisingly, total amounts of cerium within the hosts were much lower than the targeted concentrations of 2% and 10%. Among the rare earth ions introduced into the lattice, main part is stabilized in the IV oxidation state, leading to 0.081% and 0.348% trivalent cerium-doped crystals. For the highest concentrated sample (HC crystal), the charge compensation required by the stabilization of a higher initial proportion of tetravalent cerium ions is ensured by the reduction of indium cations to the monovalent oxidation state, leading the observation of a new bluish-green emission which is not observed on the LC crystal. A location of monovalent indium ions in the cuboctahedral site is proposed.The reversible 2Ce3+ + In3+ ↔ 2Ce4+ + In+ process was studied as a function of the temperature and under several atmospheres. A 200 °C heat treatment seems to be sufficient to re-oxidize the In+ UV-generated cations to the trivalent oxidation state. As expected, the redox process appears to be independent of the atmosphere.
Finally, for the first time, cycling and printing tests were performed. A perfect “on–off switch” is visible for the LC Ce-doped material, whereas a nice “bluish-green → orange switch” is observable for the HC Ce-doped material. Results are reproducible over at least four cycles, which confirms that these materials are in good agreement with UV dosimetry devices.
Acknowledgements
Lucile Cornu was the holder of the doctoral fellowship supported by the University of Bordeaux. The authors thank Dr Alain Garcia for fruitful discussion. The authors thank the CNRS and the Aquitaine region. This study was carried out with financial support from the French State, managed by the French National Research Agency (ANR) in the frame of a non-thematic program (ANR-2010-BLANC-0820) and in the frame of “the Investments for the future” Program IdEx Bordeaux – LAPHIA (ANR-10-IDEX-03-02).Notes and references
- P. A. Tanner, Top. Curr. Chem., 2004, 167–278 CrossRef CAS , 241(Transition Metal and Rare Earth Compounds III).
- (a) S. S. Pedro, L. P. Sosman, R. B. Barthem, J. C. G. Tedesco and H. N. Bordallo, J. Lumin., 2013, 134, 100 CrossRef CAS; (b) L. J. Andrews and S. M. Hitelman, Ettore Majorana Int. Sci. Ser.: Phys. Sci., 1987, 30, 515 CAS.
- M. Laroche, M. Bettinelli, S. Girard and R. Moncorgé, Chem. Phys. Lett., 1999, 311(3–4), 167 CrossRef CAS.
- H. Ramanantoanina, W. Urland, F. Cimpoesu and C. Daul, Phys. Chem. Chem. Phys., 2013, 15, 13902 RSC.
- H. Ramanantoanina, W. Urland, F. Cimpoesu and C. Daul, Phys. Chem. Chem. Phys., 2013, 15(33), 13902 RSC.
- J. Glodo, E. van Loef, R. Hawrami, W. M. Higgins, A. Churilov, U. Shirwadkar and K. S. Shah, IEEE Trans. Nucl. Sci., 2011, 58, 333 CrossRef CAS.
- J. P. Chaminade, A. Garcia, T. Gaewdang, M. Pouchard, J. Grannec and B. Jacquier, Radiat. Eff. Defects Solids., 1995, 135, 137 CrossRef CAS.
- P. Mesnard, PhD Thesis, Université de Bordeaux 1, 1997.
- H. Guengard, PhD Thesis, Université Bordeaux 1, 1994.
- Y. Xu, S. Carlson, A. Sjodin and R. Norrestam, J. Solid State Chem., 2000, 150, 399 CrossRef CAS.
- B. F. Aull and H. P. Jenssen, Phys. Rev. B: Condens. Matter, 1986, 34, 6640 CrossRef CAS.
- A. Tressaud, J. Darriet, P. Lagassie, J. Grannec and P. Hagenmuller, Mater. Res. Bull., 1984, 19, 983 CrossRef CAS.
- W. J. Cross and W. J. Hillebrand, Z. Krystallogr. Mineral., 1887, 12, 495 Search PubMed.
- K. S. Aleksandrov, S. V. Misyul, M. S. Molokeev and V. N. Voronov, Phys. Solid State, 2009, 51, 2505 CrossRef CAS.
- L. Cornu, M. Gaudon, P. Veber, A. Villesuzanne, S. Pechev, A. Garcia and V. Jubera, Chem. – Eur. J., 2015, 21, 5242 CrossRef CAS PubMed.
- J. Rodriguez-Carvajal, Commission on Powder Diffraction (IUCr) Newsletter, 2001 Search PubMed.
- M. A. Buñuel, B. Moine, B. Jacquier, A. Garcia and J. P. Chaminade, J. Appl. Phys., 1999, 86, 5045 CrossRef.
- A. Fukuda, Phys. Rev. B: Solid State, 1970, 3(1), 4161 CrossRef.
- G. Weckwerth, J. Schefer, M. Imlau, M. Wöhlecke, R. Pankrath, D. Schaniel and T. Woike, Phys. Rev. B: Condens. Matter, 2004, 7, 144410 Search PubMed.
- S. I. Omelkov, M. G. Brik, M. Kirm, V. A. Pustovarov, V. Kiisk, I. Sildos, S. Lange, S. I. Lobanov and L. I. Isaenko, J. Phys.: Condens. Matter, 2011, 23, 105501 CrossRef CAS PubMed.
- A. J. Woitowicz, M. Balcerzyk, E. Berman and A. Lempicki, Phys. Rev. B: Condens. Matter, 1994, 49, 14880 CrossRef.
Footnote |
| † Electronic supplementary information (ESI) available. See DOI: 10.1039/c5dt04772b |
| This journal is © The Royal Society of Chemistry 2016 |