 Open Access Article
Creative Commons Attribution 3.0 Unported Licence
BaAl4 derivative phases in the sections {La,Ce}Ni2Si2–{La,Ce}Zn2Si2: phase relations, crystal structures and physical properties†‡
Fainan
Failamani
a,
Zahida
Malik§
a,
Leonid
Salamakha
b,
Friedrich
Kneidinger
b,
Andriy
Grytsiv
ac,
Herwig
Michor
b,
Ernst
Bauer
bc,
Gerald
Giester
d and
Peter
Rogl
*ac
aInstitute of Materials Chemistry and Research, University of Vienna, Währingerstraße 42, A-1090 Vienna, Austria. E-mail: fai.failamani@gmail.com; zahida.malik@sns.nust.edu.pk; andriy.grytsiv@univie.ac.at; peter.franz.rogl@univie.ac.at; Fax: +43 142779524; Tel: +43 1427752456
bInstitute of Solid State Physics, TU Wien, Wiedner Hauptstraße 8–10, A-1040 Vienna, Austria. E-mail: salamakhaleonid@rambler.ru; kneidinger@ifp.tuwien.ac.at; michor@ifp.tuwien.ac.at; bauer@ifp.tuwien.ac.at; Fax: +43 15880113199; Tel: +43 15880113160
cChristian Doppler Laboratory for Thermoelectricity, Vienna, Austria
dInstitute of Mineralogy and Crystallography, University of Vienna, Althanstraße 14, A-1090 Vienna, Austria. E-mail: gerald.giester@univie.ac.at; Fax: +43 14277853235; Tel: +43 1427753235
First published on 9th February 2016
Abstract
Phase relations and crystal structures have been evaluated within the sections LaNi2Si2–LaZn2Si2 and CeNi2Si2–CeZn2Si2 at 800 °C using electron microprobe analysis and X-ray powder and single crystal structure analyses. Although the systems La–Zn–Si and Ce–Zn–Si at 800 °C do not reveal compounds such as “LaZn2Si2” or “CeZn2Si2”, solid solutions {La,Ce}(Ni1−xZnx)2Si2 exist with the Ni/Zn substitution starting from {La,Ce}Ni2Si2 (ThCr2Si2-type; I4/mmm) up to x = 0.18 for Ce(Ni1−xZnx)2Si2 and x = 0.125 for La(Ni1−xZnx)2Si2. For higher Zn-contents 0.25 ≤ x ≤ 0.55 the solutions adopt the CaBe2Ge2-type (P4/nmm). The investigations are backed by single crystal X-ray diffraction data for Ce(Ni0.61Zn0.39)2Si2 (P4/nmm; a = 0.41022(1) nm, c = 0.98146(4) nm; RF = 0.012) and by Rietveld refinement for La(Ni0.56Zn0.44)2Si2 (P4/nmm; a = 0.41680(6) nm, c = 0.99364(4) nm; RF = 0.043). Interestingly, the Ce–Zn–Si system contains a ternary phase CeZn2(Si1−xZnx)2 of the ThCr2Si2 structure type (0.25 ≤ x ≤ 0.30 at 600 °C), which forms peritectically at T = 695 °C but does not include the composition “CeZn2Si2”. The primitive high temperature tetragonal phase with the CaBe2Ge2-type has also been observed for the first time in the Ce–Ni–Si system at CeNi2+xSi2−x, x = 0.33 (single crystal data, P4/nmm; a = 0.40150(2) nm, c = 0.95210(2) nm; RF = 0.0163). Physical properties (from 400 mK to 300 K) including specific heat, electrical resistivity and magnetic susceptibility have been elucidated for Ce(Ni0.61Zn0.39)2Si2 and La(Ni0.56Zn0.44)2Si2. Ce(Ni0.61Zn0.39)2Si2 exhibits a Kondo-type ground state. Low temperature specific heat data of La(Ni0.56Zn0.44)2Si2 suggest a spin fluctuation scenario with an enhanced value of the Sommerfeld constant.
1. Introduction
Since its discovery in 1935 by Andress and Alberti,1 the BaAl4 structure type and its derivatives have been found in more than 200 intermetallic compounds, particularly the three tetragonal ternary variants: the ThCr2Si2-type by Ban and Sikirica2 (or CeAl2Ga2-type discovered independently by Zarechnyuk et al.3 in the same year), CaBe2Ge2 by Eisenmann et al.4 and the non-centrosymmetric variant BaNiSn3 by Dörrscheidt and Schäfer.5 The BaAl4 structure type furthermore is one of the building blocks of various structure types, such as U3Ni4Si4, CeNiSi2 (in combination with AlB2-type slabs) and many others.6Although phase equilibria in the Ce–Ni–Si system were investigated in the 70s by Bodak et al.7,8 more ternary phases were discovered afterwards: Ce2Ni3Si5 (U2Co3Si5-type, orthorhombic superstructure variant of BaAl4),9 Ce14Ni6Si11,10 Ce3NiSi3,11etc. Being the last member of the first row of transition metals, Zn containing ternary rare earth silicon systems had been one of the least investigated types of systems. Only some reports on the formation of ternary compounds could be found in the literature.12 Recently our report13 on the Ce–Zn–Si system at 800 °C revealed the formation of several ternary phases. Surprisingly neither BaAl4 nor its derivative structure could be found in the system at 800 °C, instead a far off-stoichiometric ThCr2Si2-type CeZn2+xSi2−x (x ∼ 0.5, labelled as τ6) was found to be stable at temperatures below 695 ± 5 °C.14
Compounds crystallizing in the BaAl4 type or its derivatives are often associated with various exotic superconducting phenomena, starting with the discovery of heavy fermion superconductivity in CeCu2Si2 by Steglich et al. in 1979,15 which breaks the previous belief of non-coexistence between magnetism and superconductivity. Spin density wave transition was found in BaFe2As2,16 followed by the discovery of superconductivity in K-doped17 and Co-doped BaFe2As2.18 More recently, BCS-like superconductivity was found in non-centrosymmetric BaPtSi3 (BaNiSn3-type)19 and isotypes.20
In cerium and actinoid compounds the hybridization of the Ce-f electrons with the conduction band gives rise to various kinds of interesting physical phenomena. Systematic studies of the transport, magnetic and calorimetric properties and Ce LIII X-ray absorption spectra and XPS measurements characterized CeNi2Si2 as an intermediate valence (valence fluctuation) system with a characteristic Kondo-lattice temperature T* ∼ 600 K.21–26 The positive Seebeck coefficient, decreasing with the Si content in CeNi2−xSi2+x was taken as a decrease of the electronic DOS particularly of the Ni-3d-states at the Fermi level concomitant with a narrowing of the Ce-4f level and a decreasing Ce-valence.27 The replacement of Ni by Pd, Cu, Au drives the Ce from an intermediate valence (IV) to a non-IV ground state.21–27 Probably because of the non-existence of compounds “LaZn2Si2” and “CeZn2Si2”, the corresponding isopleths {La,Ce}Ni2Si2–{La,Ce}Zn2Si2 have not attracted interest.
Therefore the present work intends to provide detailed information on the phase equilibria, crystal structures and physical properties of the novel BaAl4-derivative phases in the systems {La,Ce}–Ni–Si as well as in the isopleths {La,Ce}Ni2Si2–{La,Ce}Zn2Si2.
2. Experimental
Samples were prepared from cerium ingots (Alfa Aesar, purity >99.9 mass%), lanthanum ingots (Auer Remy, 99.9 mass%), zinc granules (Alfa Aesar, >99.9 mass%), Ni foil (Alfa Aesar, >99.8 mass%) and silicon pieces (Alfa Aesar, 6N). Zinc drops were purified in an evacuated quartz tube by heating them at ∼750 °C, below the boiling point of Zn (907 °C). Cerium and lanthanum ingots were mechanically surface cleaned before use.Polycrystalline bulk samples for the analysis of the quaternary isopleths {La,Ce}(Ni1−xZnx)2Si2 and for physical property studies were prepared from intimate blends of powders of arc melted master alloys {La,Ce}Ni2−xSi2 (various x; powdered under cyclohexane) and fine Zn-filings in appropriate compositional ratios. These blends were cold compacted in a steel die without lubricants, vacuum-sealed in quartz tubes, heated from 420 °C to 800 °C at the rate of 1 °C min−1 and then annealed at this temperature for 7 days. After water quenching the samples were re-powderized (under cyclohexane) in order to ensure homogeneity. The samples were loaded into 10 mm diameter graphite dies for hot pressing under Ar in a uniaxial hot press system (HP W 200/250-2200-200-KS) at 800 °C for 1 hour employing a pressure of 56 MPa. Densities of the samples have been calculated from their dimensions and masses after removing a 0.5 mm thick surface layer (grinding with SiC paper).
X-ray powder diffraction data were collected from each alloy employing a Guinier–Huber image plate system with monochromatic CuKα1 radiation (8° < 2θ < 100°). Precise lattice parameters were calculated by least squares fits to the indexed 2θ values calibrated with Ge as the internal standard (aGe = 0.565791 nm). Quantitative Rietveld refinements of the X-ray powder diffraction data were performed with the FULLPROF program.28
Single crystals from the systems {La,Ce}–Ni–Si were picked from crushed reguli. Quaternary single crystals were grown from Zn flux starting from a cold compacted pellet (Ce2Ni4Si8 + Zn-filings = Ce2Ni4Si8Zn86 (in at.%)), which was heated to 900 °C at the rate of 1 °C min−1 and then cooled to 800 °C at the same rate. After annealing for 4 days at this temperature the sample was subsequently quenched in water and then boiled with 15% aqueous solution of HCl in a water bath in order to dissolve the extra Zn. Crystals were carefully washed with distilled water and dried.
Inspections on an AXS-GADDS texture goniometer assured the high crystal quality, unit cell dimensions and Laue symmetry of the specimens prior to the X-ray intensity data collections on a four-circle Nonius Kappa diffractometer equipped with a CCD area detector employing graphite monochromated MoKα radiation (λ = 0.071069 nm). Orientation matrices and unit cell parameters were derived using the program DENZO.29 Besides the general treatment of absorption effects using the multi-scan technique (redundancy of integrated reflections >8) no additional absorption corrections were performed because of the rather regular crystal shapes and small dimensions of the investigated specimens. The structures were solved by direct methods and were refined with the SHELXL-97 program30 within the Windows version WinGX.31
After the reaction during annealing the samples had almost a powder-like consistency, too soft to be polished by standard procedures. This problem was overcome by casting the sample powder along with conducting glue into a cylindrical mould of ∼5 mm diameter. After hardening several of the powder cylinders were hot compacted in conductive resin and were ground and polished under glycerine instead of water in order to avoid oxidation of the samples. Microstructures and compositions were examined by light optical microscopy (LOM) and scanning electron microscopy (SEM) via Electron Probe Micro-Analyses (EPMA) on a Zeiss Supra 55 VP equipped with an EDX system operated at 20 kV.
Physical property measurements (magnetic susceptibility, electrical resistivity, and specific heat) were performed on the hot pressed samples with methods described in our previous publications, e.g.ref. 32.
3. Results and discussion
3.1. The BaAl4-type derivative phases in the systems La–Ni–Si and Ce–Ni–Si
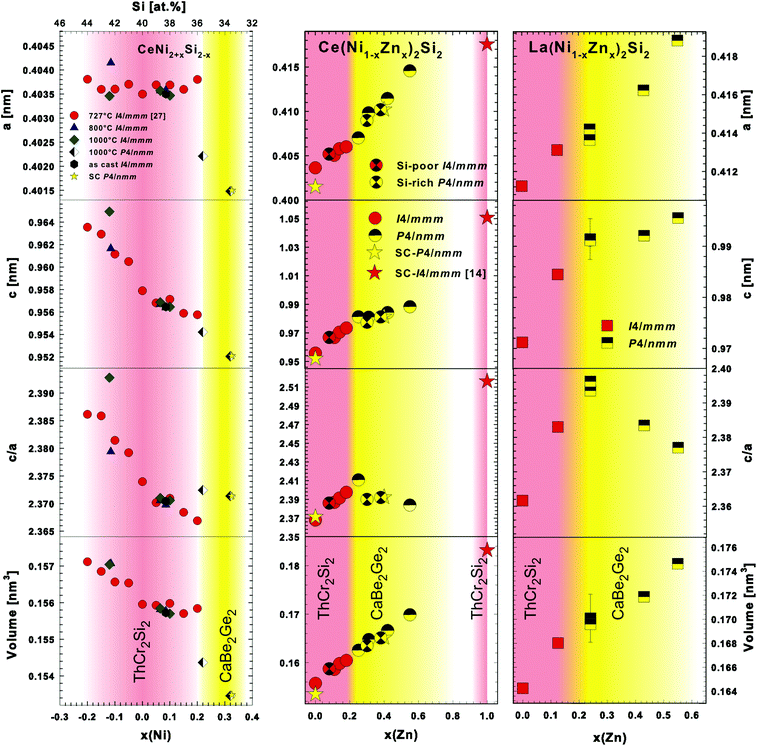
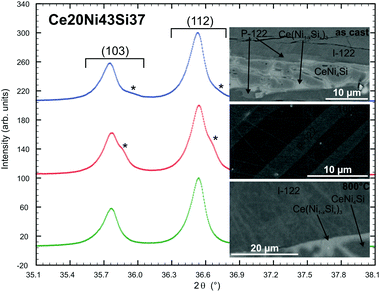
The system Ce–Ni–Si relevant to this work was investigated by Bodak and coworkers.7,8 The isothermal section of La–Ni–Si at 400 °C was established much later by Zhou et al.33 Both systems contain a compound {La,Ce}Ni2Si2 which was reported to crystallize in the ThCr2Si2 type34 with a practically negligible homogeneity range. A thorough check on these findings prompted us to prepare samples with the nominal composition {La,Ce}20Ni40Si40 (in at.%). As-cast alloys as well as samples annealed at 800 °C for 4 days revealed nearly a single phase condition with the ThCr2Si2 type, thus suggesting a congruent or a degenerate peritectic formation of these phases, and furthermore confirmed the crystal structure data from Bodak et al.34 Levin et al.27 studied the homogeneity range of CeNi2Si2 (ThCr2Si2-type) at a relatively low temperature of 727 °C and discovered a rather large homogeneity range of 8 at.% ranging from 36 to 44 at.% Si. Our reinvestigation (EPMA) of the phase relations around CeNi2Si2 at 800 °C reveals a smaller homogeneity range for the ThCr2Si2 type of ∼4 at.% from 38.3 to 42.3 at.% Si. Our lattice parameters (see Fig. 1), however, agree well with the result of Levin et al.27 In general the Ni/Si substitution does not affect the a-axis much, however one can see that the c-axis decreases almost linearly with increasing Ni content. In an attempt to investigate the crystal structure of CeNi4Si35 we discovered a Ni-rich phase CeNi2+xSi2−x (x ∼ 0.3). EPM analysis of an as-cast alloy with a slightly higher Ni-content (Ce20Ni43Si37) showed primary crystallization of Ce20Ni41Si39 followed by a peritectic-like formation of a thin layer of Ce20Ni46Si34 (see Fig. 2). The remaining liquid crystallized as CeNi4Si and a novel phase Ce(Ni1−xSix)3. Besides the main reflections arising from the ThCr2Si2-type (Ce20Ni41Si39), the X-ray powder pattern revealed a set of weak satellite reflections that correspond to a tetragonal lattice similar to ThCr2Si2 with smaller unit cell dimensions. At this point, it was not clear whether the Ni-rich phase Ce20Ni46Si34 represents a new phase or the Ni-rich end of a homogeneity range of ThCr2Si2-type CeNi2Si2. The amount of the Ni-rich phase Ce20Ni46Si34 in the as-cast state increases as the alloy composition shifts towards the Ni-rich side at a constant Ce content, where at an alloy composition of Ce20Ni60Si20 a single crystal suitable for X-ray structure analysis (see below) was selected.| Compound | CeNi2+xSi2−x, x = 0.33 | CeNi2Si2 | LaNi2Si2 |
|---|---|---|---|
| a Crystal structure data are standardized using the program Structure Tidy.39 b Anisotropic atomic displacement parameters Uij in [10−2 nm2]. c Fixed after EPMA. | |||
| EMPA composition [at.%] | Ce20.1Ni46.5Si33.4 | Ce20.4Ni38Si41.6 | La20.3Ni37.9Si41.8 |
| Refinement composition [at.%] | Ce20Ni46.5Si35.5 | Ce20.0Ni40.0Si40 | La20.4Ni38.8Si40.8 |
| Space group | P4/nmm; no. 129, origin choice 2 | I4/mmm, no. 139 | I4/mmm, no. 139 |
| Structure type | CaBe2Ge2 | ThCr2Si2 | ThCr2Si2 |
| Data collection | Nonius Kappa CCD | Guinier image plate | Guinier image plate |
| Radiation | MoKα | CuKα1 | CuKα1 |
| θ range | 2.14 < θ < 36.16 | 10 < 2θ < 100 | 10 < 2θ < 100 |
| Crystal size [μm] | 40 × 50 × 50 | — | — |
| a [nm] | 0.40150(2) | 0.40363(1) | 0.41124(1) |
| c [nm] | 0.95210(2) | 0.95758(1) | 0.97119(1) |
| Reflections in refinement | 226Fo > 4σ(Fo) of 262 | 38 | 39 |
| Z, volume [nm3] | 2, 0.1535(1) | 2, 0.156(1) | 2, 0.164(1) |
| Number of variables | 15 | 22 | 22 |
| R F = ∑|Fo − Fc|/∑Fo | 0.0163 | R F = 0.024 | R F = 0.028 |
| R Int | 0.0107 | R I = 0.024 | R I = 0.028 |
| GOF | 1.195 | χ 2 = 1.72 | χ 2 = 3.09 |
| Extinction (Zachariasen) | 0.044(2) | — | — |
| RE | Ce in 2c (1/4, 1/4, z); z = 0.75072(4); | Ce in 2a (0, 0, 0) | La in 2a (0, 0, 0) |
| Occ.; Biso. | 1.00(1); — | 1.00(1); 0.14(2) | 1.00(1); 0.95(2) |
U
11![[thin space (1/6-em)]](https://www.rsc.org/images/entities/char_2009.gif) b = U22; U33; U23 = U13 = U12 = 0 b = U22; U33; U23 = U13 = U12 = 0 |
0.0057(1); 0.0068(2) | — | — |
| Ni | Ni1 in 2c (1/4, 1/4, z); z = 0.1264(1); | Ni in 4d (0, 1/2, 1/4) | Ni in 4d (0, 1/2, 1/4) |
| Occ.; Biso. | 1.00(1); — | 1.00(2); 0.60(5) | 0.95(2); 0.19(3) |
U
11![[thin space (1/6-em)]](https://www.rsc.org/images/entities/char_2009.gif) b = U22;U33;U23 = U13 = U12 = 0 b = U22;U33;U23 = U13 = U12 = 0 |
0.0134(3); 0.0120(4) | ||
| Ni; Occ. | Ni2 in 2b (3/4, 1/4, 1/2); 1.00(1) | — | — |
U
11![[thin space (1/6-em)]](https://www.rsc.org/images/entities/char_2009.gif) b = U22;U33;U23 = U13 = U12 = 0 b = U22;U33;U23 = U13 = U12 = 0 |
0.0085(2); 0.0074(3) | — | — |
| Si | Si1 in 2c (1/4, 1/4, z); | Si in 4e (0, 0, z); | Si in 4e (0, 0, z); |
| z = 0.3717(2); | z = 0.3804(3); | z = 0.3684(2); | |
| Occ.; Biso. | 1.00(1); — | 1.00(1); 0.26(7) | 1.00(1); 0.49(5) |
U
11![[thin space (1/6-em)]](https://www.rsc.org/images/entities/char_2009.gif) b = U22;U33; U23 = U13 = U12 = 0 b = U22;U33; U23 = U13 = U12 = 0 |
0.0056(4); 0.0077(7) | ||
| M | M in 2a (3/4, 1/4, 0); | — | — |
| Occ. | 0.33(−) Ni3 + 0.67(−) Si2c | — | — |
U
11![[thin space (1/6-em)]](https://www.rsc.org/images/entities/char_2009.gif) b = U22;U33;U23 = U13 = U12 = 0 b = U22;U33;U23 = U13 = U12 = 0 |
0.0163(4); 0.0102(6) | — | — |
| Residual electron density; max; min in [electrons/nm3] × 1000 | 1.18; −1.53 | — | — |
It is worth mentioning that although the primitive reflections in CaBe2Ge2-type CeNi2+xSi2−x are relatively small, they are still visible in the single-phase powder diffraction spectra. Interestingly, neither a Ni-rich composition nor primitive reflections could be observed at 800 °C in alloys at the Ni-rich side of the 1![[thin space (1/6-em)]](https://www.rsc.org/images/entities/char_2009.gif) :
:![[thin space (1/6-em)]](https://www.rsc.org/images/entities/char_2009.gif) 2
2![[thin space (1/6-em)]](https://www.rsc.org/images/entities/char_2009.gif) :
:![[thin space (1/6-em)]](https://www.rsc.org/images/entities/char_2009.gif) 2 stoichiometry. This strongly suggests that the primitive CaBe2Ge2-type phase CeNi2+xSi2−x is a high temperature phase. Alloys at the Ni-rich side of 1
2 stoichiometry. This strongly suggests that the primitive CaBe2Ge2-type phase CeNi2+xSi2−x is a high temperature phase. Alloys at the Ni-rich side of 1![[thin space (1/6-em)]](https://www.rsc.org/images/entities/char_2009.gif) :
:![[thin space (1/6-em)]](https://www.rsc.org/images/entities/char_2009.gif) 2
2![[thin space (1/6-em)]](https://www.rsc.org/images/entities/char_2009.gif) :
:![[thin space (1/6-em)]](https://www.rsc.org/images/entities/char_2009.gif) 2 annealed at 1000 °C indeed show the Ni-rich composition Ce20Ni∼46Si∼34 in equilibrium with CeNi4Si and Ce(Ni1−xSix)3. Consequently, the X-ray powder diffraction spectra show two sets of BaAl4-type reflections (see Fig. 2). As the sample is multiphase, it is rather difficult to identify the primitive peaks, however, the lattice parameters of one of the BaAl4 derivative phases show a shorter c-axis, which is closer to the value of CeNi2+xSi2−x with the primitive CaBe2Ge2-type as obtained from the single crystal data. The other set of BaAl4 derivative reflections give similar unit cell parameters as for CeNi2Si2 with the ThCr2Si2-type. These observations, together with the fact that a single crystal was obtained from an as-cast alloy led us to conclude that CeNi2+xSi2−x with the primitive CaBe2Ge2-type is a high temperature phase (1000 °C ≤ Tstability < 1615 °C).36
2 annealed at 1000 °C indeed show the Ni-rich composition Ce20Ni∼46Si∼34 in equilibrium with CeNi4Si and Ce(Ni1−xSix)3. Consequently, the X-ray powder diffraction spectra show two sets of BaAl4-type reflections (see Fig. 2). As the sample is multiphase, it is rather difficult to identify the primitive peaks, however, the lattice parameters of one of the BaAl4 derivative phases show a shorter c-axis, which is closer to the value of CeNi2+xSi2−x with the primitive CaBe2Ge2-type as obtained from the single crystal data. The other set of BaAl4 derivative reflections give similar unit cell parameters as for CeNi2Si2 with the ThCr2Si2-type. These observations, together with the fact that a single crystal was obtained from an as-cast alloy led us to conclude that CeNi2+xSi2−x with the primitive CaBe2Ge2-type is a high temperature phase (1000 °C ≤ Tstability < 1615 °C).36
Polymorphism between ThCr2Si2- and CaBe2Ge2-types is often encountered in various systems, particularly for ternary rare earth silicides containing Ir and Pt.12 In some cases, e.g. in the La–Ir–Si system,37 the CaBe2Ge2-type is the high temperature form, whilst the ThCr2Si2-type is stable at lower temperatures. Therefore CeNi2+xSi2−x with the primitive CaBe2Ge2-type is hitherto the first example of ThCr2Si2–CaBe2Ge2 polymorphism found in ternary rare earth silicides with 3d transition metal elements. The slight flattening of the unit cell, i.e. the shorter length of the c-axis observed in CeNi2+xSi2−x (CaBe2Ge2-type), is also commonly found in many systems exhibiting such polymorphism.12
Besides the temperature effect, the substitution of Si by Ni at the 2a-site may act as a driving force for the structural change from a body centred to a primitive atom arrangement in terms of a group–subgroup relation. This idea comes from the fact that an alloy with stoichiometric composition CeNi2Si2 does not show any changes in the powder diffraction spectra in the as-cast state, and after annealing at 1000 °C for 4 days. An example of structural evolution at a constant temperature can be found in the Sr–Au–Ge system38 where at 700 °C, increasing the Ge content in SrAu2−xGe2+x led to a series of structural changes from the ThCr2Si2-type to the BaCu2Sb2-type and finally to the CaBe2Ge2-type, where all structure types are variants of the BaAl4-type.
3.2. The quaternary solution phases La(Ni1−xZnx)2Si2 and Ce(Ni1−xZnx)2Si2
As neither stoichiometric CeZn2Si2 nor off-stoichiometric CeZn2+xSi2−x (x ∼ 0.5) exists in the Ce–Zn–Si system at 800 °C, it is interesting to investigate the extent of solubility of Zn in the CeNi2Si2 phase at 800 °C. Stoichiometric body centred CeNi2Si2 is found to substitute for Ni up to 18% Zn, i.e. Ce(Ni1−xZnx)2Si2, x = 0.18. The substitution of Zn for Ni is also reflected in the gradual increase of the unit cell parameters (Fig. 1). For further Zn substitution the Bravais lattice changes from body centered to primitive, as indicated by the appearance of additional weak reflections that violate the systematic extinction of a body-centred cell. The samples remain single phase up to x = 0.55 at 800 °C. On further Zn substitution the samples became multiphase, indicating that the solubility limit has been reached.Since the primitive CaBe2Ge2-type phase also exists in the Ce–Ni–Si end member system at a high temperature in the Ni-rich side, and the body centred ThCr2Si2-type phase extends slightly to both the Ni- and Si-rich sides at 800 °C, we suspected that a slight deviation from the stoichiometric 1![[thin space (1/6-em)]](https://www.rsc.org/images/entities/char_2009.gif) :
:![[thin space (1/6-em)]](https://www.rsc.org/images/entities/char_2009.gif) 2
2![[thin space (1/6-em)]](https://www.rsc.org/images/entities/char_2009.gif) :
:![[thin space (1/6-em)]](https://www.rsc.org/images/entities/char_2009.gif) 2 composition could stabilize/destabilize one of these structure types with the incorporation of Zn. Such a situation is often found in various systems, e.g. in the Ce–Zn–Si system at 800 °C
2 composition could stabilize/destabilize one of these structure types with the incorporation of Zn. Such a situation is often found in various systems, e.g. in the Ce–Zn–Si system at 800 °C![[thin space (1/6-em)]](https://www.rsc.org/images/entities/char_2009.gif) 13 or Ce–Ag–Si at 500 °C
13 or Ce–Ag–Si at 500 °C![[thin space (1/6-em)]](https://www.rsc.org/images/entities/char_2009.gif) 40 where two compositional polymorphic modifications of CeSi2 with the α-ThSi2 type and the α-GdSi2 type dissolve transition metal elements, however, the α-GdSi2-based solid solutions end prematurely while the α-ThSi2-based solid solutions extend further up to ∼20 at.% transition metal content.
40 where two compositional polymorphic modifications of CeSi2 with the α-ThSi2 type and the α-GdSi2 type dissolve transition metal elements, however, the α-GdSi2-based solid solutions end prematurely while the α-ThSi2-based solid solutions extend further up to ∼20 at.% transition metal content.
In order to check the possibility of such a scenario we prepared several alloys with off-stoichiometric compositions. Although the nominal compositions deviate far (∼5 at.%) from the 1![[thin space (1/6-em)]](https://www.rsc.org/images/entities/char_2009.gif) :
:![[thin space (1/6-em)]](https://www.rsc.org/images/entities/char_2009.gif) 2
2![[thin space (1/6-em)]](https://www.rsc.org/images/entities/char_2009.gif) :
:![[thin space (1/6-em)]](https://www.rsc.org/images/entities/char_2009.gif) 2 composition, only a small variation (±1 at.%) in the homogeneity range could be observed in the quaternary 122 phase. A variation of unit cell parameters of alloys in both the Si-poor and rich parts of the 122 stoichiometry shows good agreement with those from the stoichiometric 122 alloys. This suggests that there is no parallel solid solution running beside the one shown in Fig. 1.
2 composition, only a small variation (±1 at.%) in the homogeneity range could be observed in the quaternary 122 phase. A variation of unit cell parameters of alloys in both the Si-poor and rich parts of the 122 stoichiometry shows good agreement with those from the stoichiometric 122 alloys. This suggests that there is no parallel solid solution running beside the one shown in Fig. 1.
![[thin space (1/6-em)]](https://www.rsc.org/images/entities/char_2009.gif) 000 counts), the (210), (210), (230), (230) reflection intensities are below 2 counts and can be disregarded, whereas the (010) intensity (below 7 counts) may stem from a ‘Renninger enhancement’ effect.
000 counts), the (210), (210), (230), (230) reflection intensities are below 2 counts and can be disregarded, whereas the (010) intensity (below 7 counts) may stem from a ‘Renninger enhancement’ effect.
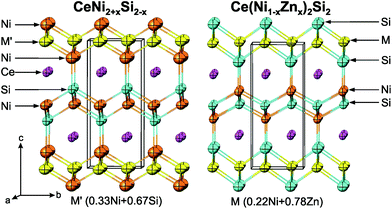
Interestingly, the site occupation of the transition metal and tetrel atoms is exchanged, i.e. the tetrel atoms occupy sites 2c (1/4, 1/4, ∼0.1) and 2b, whilst the transition metal atoms occupy sites 2c (1/4, 1/4, ∼0.35) and 2a. This site exchange configuration gives rise to the intensity of the primitive reflections, therefore the CaBe2Ge2-type phases can be identified easily in the quaternary system by X-ray powder diffraction.
Although the small differences in the X-ray scattering power of Ni and Zn make it difficult to unambiguously differentiate between these atom types, it was possible to define the site occupation of Zn by analyzing site ADPs. As the ADPs of the two Si sites did not show any anomalies, it was certain that Zn occupied one or both of the Ni sites. Among all remaining combinations of Zn site occupations, the lowest RF was found when Zn substituted Ni at the 2a site. Although it was possible to refine the Ni/Zn occupancy at this site, the resulting value (0.48(3)Ni + 0.52Zn) deviates far from the value obtained by EPMA: 0.22Ni + 0.78Zn. Therefore, in the final refinement the Ni/Zn occupancy was fixed according to EPMA, resulting in the structure formula Ce(Ni1−xZnx)2Si2, x = 0.39 (i.e. Ce20Ni24.4Zn15.6Si40).
The final refinement converged to RF = 0.0134 and residual electron densities were less than ±1.48 electrons per Å3 for three metal and two Si positions with a Wyckoff sequence abc3. Crystal data for Ce(Ni1−xZnx)2Si2, x = 0.39, with the CaBe2Ge2-type along with the ADPs are summarized in Table 2; interatomic distances are presented in Table 3; coordination polyhedra for all atom sites and a three-dimensional view on the crystal structure are presented in Fig. I of the ESI.‡
| Compound | Ce(Ni1−xZnx)2Si2, x = 0.39 | La(Ni1−xZnx)2Si2, x = 0.44 |
|---|---|---|
| a Crystal structure data are standardized using the program Structure Tidy.39 b Anisotropic atomic displacement parameters Uij in [10−2 nm2]. c Ge standard. d Fixed after EPMA. | ||
| EMPA composition [at.%] | Ce19.4Ni25.3Zn16.1Si39.2 | La19.9Ni22.3Zn17.2Si40.7 |
| Refinement composition [at.%] | Ce20Ni24.4Zn15.6Si40 | La20Ni22.6Zn17.4Si40 |
| Structure type | CaBe2Ge2 | CaBe2Ge2 |
| Data collection | Nonius Kappa CCD | Guinier–Huber IP |
| Radiation | MoKα | CuKα1 |
| θ range | 2.08 <θ < 36.05 | 8 < 2θ < 100 |
| Crystal size [μm] | 40 × 50 × 50 | — |
| a [nm] | 0.41022(1) | 0.41680(6)c |
| c [nm] | 0.98146(4) | 0.99213(7)c |
| Reflections in refinement | 266Fo > 4σ(Fo) of 272 | 72 |
| Mosaicity | 0.65 | — |
| Z, density [gm cm−3] | 2, 6.44 | 2, 6.022 |
| Number of variables | 15 | 26 |
| R F = ∑|Fo − Fc|/∑Fo | 0.0134 | R F = 0.043 |
| R Int | 0.0135 | R I = 0.025 |
| GOF | 1.153 | χ 2 = 2.78 |
| Extinction (Zachariasen) | 0.024(1) | R w = 2.75 |
| RE in 2c (1/4, 1/4, z); Occ. | z = 0.73977(3); 1.00(1) | z = 0.73833(7); 1.00(1) |
U
11![[thin space (1/6-em)]](https://www.rsc.org/images/entities/char_2009.gif) b = U22; U33; U23 = U13 = U12 = 0 b = U22; U33; U23 = U13 = U12 = 0 |
0.0050(1); 0.0058(1) | B iso = 0.28(1) |
| M in 2a (3/4, 1/4, 0); Occ. | 0.78(−)Zn1 + 0.22(−)Nid | 0.87(−) Zn1 + 0.13(−) Ni1d |
U
11![[thin space (1/6-em)]](https://www.rsc.org/images/entities/char_2009.gif) b = U22; U33; U23 = U13 = U12 = 0 b = U22; U33; U23 = U13 = U12 = 0 |
0.0099(2); 0.0070(2) | B iso = 0.26(3) |
| Ni2 in 2c (1/4, 1/4, z); Occ. | z = 0.38514(6); 1.00(1) | z = 0.3883(1); 1.00(1) |
U
11![[thin space (1/6-em)]](https://www.rsc.org/images/entities/char_2009.gif) b = U22; U33; U23 = U13 = U12 = 0 b = U22; U33; U23 = U13 = U12 = 0 |
0.0063(2); 0.0071(3) | B iso = 0.36(4) |
| Si1 in 2b (3/4, 1/4, 1/2); Occ. | 1.00(1) | 1.00(1) |
U
11![[thin space (1/6-em)]](https://www.rsc.org/images/entities/char_2009.gif) b = U22; U33; U23 = U13 = U12 = 0 b = U22; U33; U23 = U13 = U12 = 0 |
0.0061(3); 0.0060(5) | B iso = 0.54(6) |
| Si2 in 2c (1/4, 1/4, z); Occ. | z = 0.1474(2); 1.00(1) | z = 0.1537(3); 1.00(1) |
U
11![[thin space (1/6-em)]](https://www.rsc.org/images/entities/char_2009.gif) b = U22; U33; U23 = U13 = U12 = 0 b = U22; U33; U23 = U13 = U12 = 0 |
0.0106(4); 0.0096(6) | B iso = 0.68(7) |
| Residual electron density; max; min in [electrons per nm3] × 1000 | 1.48; −0.97 | |
| Atom 1 | Atom 2 | d 1,2 [nm] |
|---|---|---|
| Ce1 | Si2 (4×) | 0.31047 |
| Si1 (4×) | 0.31217 | |
| Ni2 (4×) | 0.31491 | |
| M (4×) | 0.32757 | |
| M | Si2 (4×) | 0.25102 |
| M (4×) | 0.29007 | |
| Ce1 (4×) | 0.32757 | |
| Ni2 | Si2 (1×) | 0.23329 |
| Si1 (4×) | 0.23405 | |
| Ce1 (4×) | 0.31491 | |
| Si1 | Ni2 (4×) | 0.23405 |
| Si1 (4×) | 0.29007 | |
| Ce1 (4×) | 0.31217 | |
| Si2 | Ni2 (1×) | 0.23329 |
| M (4×) | 0.25102 | |
| Ce1 (4×) | 0.31047 |
The comparison of the structures of CeNi2+xSi2−x and Ce(Ni,Zn)2Si2 in Fig. 4 clearly reveals an atom site exchange in the tetrahedron-layers sandwiching the Ce-atoms: Ni- and Si-layers are exchanged. However, it is interesting to see that the random substitution of Ni/Si and Ni/Zn always occurs at the same site (2a site).
Several examples of such site exchange variants of the CaBe2Ge2-structure type can be found in the literature, particularly for ternary stannides and antimonides, e.g. Ce{Ni,Cu,Pd,Ir,Pt}2Sn2.12 For ternary silicides, only the high temperature modification LaIr2Si2![[thin space (1/6-em)]](https://www.rsc.org/images/entities/char_2009.gif) 37 is known to exhibit such a site exchange arrangement. A similar situation is also encountered in quaternary Ce(Cu1−xAgx)2−ySb2.41
37 is known to exhibit such a site exchange arrangement. A similar situation is also encountered in quaternary Ce(Cu1−xAgx)2−ySb2.41
In contrast to primitive Ce(Ni1−xZnx)2Si2, where the occupation of Zn/Si sites is inverted with respect to primitive CeNi2+xSi2−x, body centred Ce(Ni1−xZnx)2Si2 as well as off-stoichiometric CeZn2+xSi2−x (x ∼ 0.5) do not exhibit such a site exchange.
The Rietveld refinement performed on single-phase body centred Ce(Ni1−xZnx)2Si2 (x = 0.18) shows that Zn substitutes Ni at the 4d site, while the 4e site remains fully occupied by Si. In the case of ternary CeZn2+xSi2−x (x = 0.5), due to the higher Zn-content, Zn and Si share the 4e site with a ratio of 3![[thin space (1/6-em)]](https://www.rsc.org/images/entities/char_2009.gif) :
:![[thin space (1/6-em)]](https://www.rsc.org/images/entities/char_2009.gif) 7 whereas the 4d site is fully occupied by Zn.14 A detailed group–subgroup diagram relating the parent BaAl4 structure to the ThCr2Si2 and CaBe2Ge2 for the various phases in the Ce–Ni–Zn–Si system is presented in terms of a Bärnighausen tree, depicted in Fig. II of the ESI.‡
7 whereas the 4d site is fully occupied by Zn.14 A detailed group–subgroup diagram relating the parent BaAl4 structure to the ThCr2Si2 and CaBe2Ge2 for the various phases in the Ce–Ni–Zn–Si system is presented in terms of a Bärnighausen tree, depicted in Fig. II of the ESI.‡
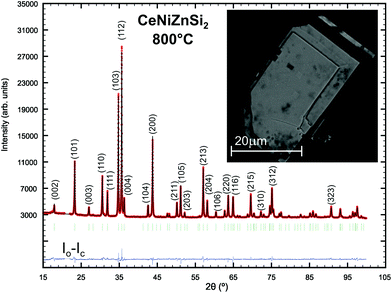
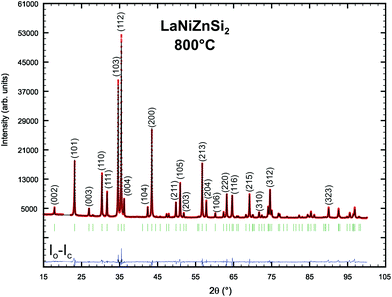
In analogy to the section Ce(Ni1−xZnx)2Si2, phase relations have also been explored for the isopleth La(Ni1−xZnx)2Si2 (see Fig. 1). Combined EPM and X-ray powder intensity data analyses revealed a solid solution with the ThCr2Si2-type for 0 ≤ x ≤ 0.125, followed by a change to a primitive tetragonal symmetry typical for the CaBe2Ge2-type for 0.25 ≤ x ≤ 0.55. The solid solution terminates at x = 0.55 as for higher Zn-concentrations multiphase X-ray spectra were observed. Rietveld refinement data for La(Ni0.56Zn0.44)2Si2 are summarized in Table 2 and Fig. 5.
3.3. Physical properties of La(Ni1−xZnx)2Si2 and Ce(Ni1−xZnx)2Si2
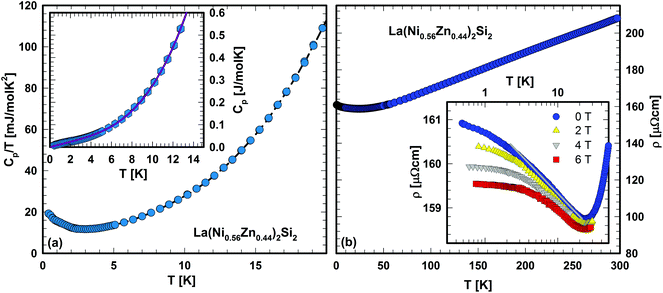
Two samples, {La,Ce}(Ni,Zn)2Si2 were selected from the solid solution to check on the physical properties of this series.![[thin space (1/6-em)]](https://www.rsc.org/images/entities/char_2009.gif) ln(T/T*) is employed to the experimental data, revealing excellent agreement for γ = 13 mJ mol−1 K−2 and T* = 8.7 K (solid line, inset Fig. 6(a)). This agreement would suggest spin fluctuations in the nearly localized regime present in La(Ni0.56Zn0.44)2Si2. The fit parameter β = 0.13 mJ mol−1 K−4 allows the estimation of a Debye temperature of about 460 K, referring to the rather stiff lattice of this system.
ln(T/T*) is employed to the experimental data, revealing excellent agreement for γ = 13 mJ mol−1 K−2 and T* = 8.7 K (solid line, inset Fig. 6(a)). This agreement would suggest spin fluctuations in the nearly localized regime present in La(Ni0.56Zn0.44)2Si2. The fit parameter β = 0.13 mJ mol−1 K−4 allows the estimation of a Debye temperature of about 460 K, referring to the rather stiff lattice of this system.
The resistivity, ρ, of La(Ni0.56Zn0.44)2Si2 was studied within the temperature range 4.2–300 K. At elevated temperatures (T > 100 K) ρ(T) behaves metallic-like. The almost linear slope of ρ(T) refers predominantly to electron–phonon interactions. A shallow minimum is observed at about 25 K and below this temperature the resistivity increases with decreasing temperature (see Fig. 6(b)). A plot of the resistivity on a logarithmic temperature scale (inset, Fig. 6(b)) for various externally applied magnetic fields reveals, unexpectedly a logarithmic behaviour, indicating Kondo-type interactions, which might be attributed to a small amount of uncompensated Ni spins. These features were reproduced in several independently prepared samples and comply with the enhanced value of the Sommerfeld constant deduced from the specific heat experiment.
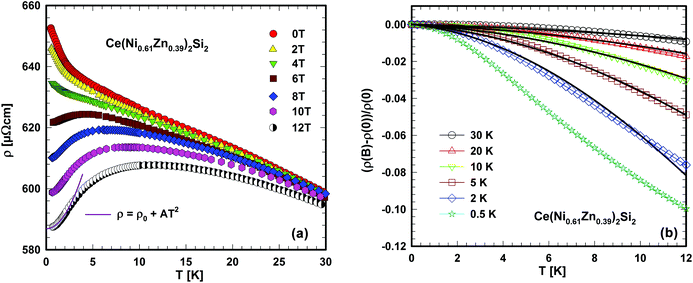 | ||
| Fig. 8 (a) Low temperature electrical resistivity ρ of Ce(Ni0.61Zn0.39)2Si2 for various externally applied magnetic fields. The solid line is a least squares fit as explained in the text. (b) Field dependent magnetoresistance (ρ(B) − ρ(0))/ρ(0) of Ce(Ni0.61Zn0.39)2Si2 for various temperatures. ρ(B) and ρ(0) are the field and the zero field resistivities. The solid lines correspond to numerical calculations according to Schlottmann's theory.45 | ||
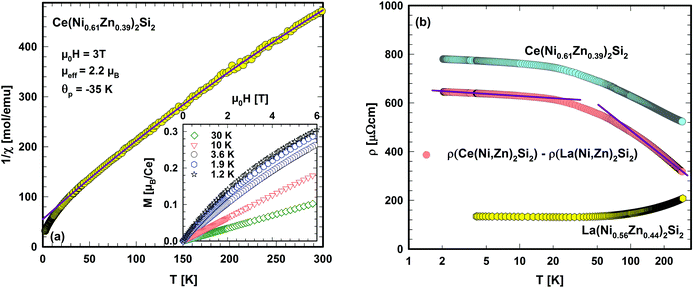
A simple proof of whether or not this EC is preserved in the solid state of Ce(Ni0.61Zn0.39)2Si2 can be obtained from temperature dependent magnetic measurements. The inverse magnetic susceptibility at 3 T is shown in Fig. 7(a). Phase transitions above 2.5 K are not obtained from this measurement. A quantitative description of the high temperature magnetic susceptibility (50–300 K) can be made by applying a modified Curie Weiss law, revealing a temperature independent Pauli susceptibility (χ0 = 3.9 × 10⁻⁴ emu mol−1), an effective magnetic moment, which is related to the Curie constant (μeff = 2.20μB/Ce) and a paramagnetic Curie temperature (θp = −35 K) from a least squares fit of this model to the experimental data (solid line, Fig. 7(a)).
A negative paramagnetic Curie temperature, in general, refers to antiferromagnetic interactions between conduction electrons and the almost localized Ce 4f electrons. Crystalline electric field (CEF) effects, lifting the 2j + 1 = 6 fold degenerate ground state, as well as the Kondo effect, modify, however, the absolute value of θp. The effective magnetic moment observed from the Curie Weiss law is below that (2.54μB) expected for the free ion Ce3+ state (EC: 4f1). This reduction may be caused by the fraction of Ce ions in the Ni richer environments, whereas Zn tends to stabilise the Ce3+ local moment character.
The slight curvature observed in the 1/χ vs. T data-set might result from CEF effects which are simply modelled here by adjusting the parameter χ0. At temperatures below about 2 K, the susceptibility, χ(T), displays a smooth cross-over from the high temperature Curie–Weiss behaviour towards a low temperature Kondo-like flattening of the susceptibility which reaches a value χLT = 0.054 emu mol−1 at 0.7 K (see inset in Fig. 9b).
The inset in Fig. 7(a) shows isothermal magnetization curves, M, for Ce(Ni0.61Zn0.39)2Si2 measured at temperatures ranging from 1.2 K to 30 K. Neither spontaneous magnetization nor metamagnetic-like features are obvious from these measurements, thus excluding long range magnetic order in the measured temperature range. A smooth, slightly curvilinear M(H) dependence at low temperatures is observed with relatively small magnetization values near 0.3μB/Ce at 1.2 K and 6 T. A combination of both, CEF splitting and the Kondo effect (see below) is expected to be responsible for the magnitude of the low temperature magnetic moment.
Fig. 7(b) shows the temperature dependent electrical resistivity, ρ, of Ce(Ni0.61Zn0.39)2Si2 in comparison with that of La(Ni0.56Zn0.44)2Si2. In distinct contrast to ρ(T) of La(Ni0.56Zn0.44)2Si2, the electrical resistivity of Ce(Ni0.61Zn0.39)2Si2 evidences a negative value of dρ/dT in the entire temperature range. Additionally, much larger ρ(T) values are observed as a consequence of additional magnetic scattering processes. If ρ(T) of La(Ni0.56Zn0.44)2Si2 is assumed to primarily derive from electron–phonon interactions, besides a constant residual resistivity, the magnetic scattering processes of electrons on the 4f moments of Ce can be isolated by simply subtracting the resistivity curve of La(Ni0.56Zn0.44)2Si2 from that of Ce(Ni0.61Zn0.39)2Si2. Results are shown in Fig. 7(b) on a semi-logarithmic temperature scale. Obviously, two temperature ranges can be identified, where ρmag(T) behaves in a negative-logarithmic manner (see the solid lines in Fig. 7(b) as a guide for the eyes). Such a behaviour is a hallmark of Kondo-type interactions, as present in a huge amount of cerium based compounds. Following the preposition of Cornut and Coqblin43 the logarithmic resistivity ranges at low and high temperatures can be understood as derived from the Kondo effect in the CEF ground state and in an excited CEF state, respectively. If these levels are well separated in energy, a pronounced maximum in ρmag(T) would be expected as well. Overall, the present resistivity study strongly indicates a Kondo effect existing in Ce(Ni0.61Zn0.39)2Si2.
In general, a lattice of Kondo ions (i.e., a Kondo lattice) is characterised by a drop of the electrical resistivity at lowest temperatures due to coherence. A distribution of Kondo temperatures due to random Ni/Zn occupation may inhibit the formation of a coherent state at low temperatures in the present system (compare Fig. 7b and 8a). Externally applied magnetic fields tend to suppress incoherent scattering processes. Accordingly, for fields above about 6 T, a smooth maximum forms in ρ(T), which shifts continuously to higher temperatures. Such behaviour can be understood in terms of a Kondo lattice, where the maximum in ρ(T) is a measure of the Kondo temperature.44 At lowest temperatures, a Kondo lattice exhibits a Fermi liquid ground state documented by the T2 behaviour of the electrical resistivity (solid line, Fig. 8(a)). Isothermal resistivity data at various external fields, as presented in Fig. 8(b), reveal a moderate negative magnetoresistance, amounting to about 10% at lowest temperatures and 12 T.
The overall negative magnetoresistance is in line with the Kondo behaviour, where increasing magnetic fields suppress Kondo interactions and as a result decrease resistivity. Although the field dependence of (ρ(B) − ρ(0))/ρ(0) complies with numerical results employing Schlottmann's theory45 (solid lines, Fig. 8(b)), the Kondo temperature inferred from such fits appears to be unphysically high (about 50 K) which may be a consequence of the aforementioned site-dependent hybridisation/Kondo interaction strength.
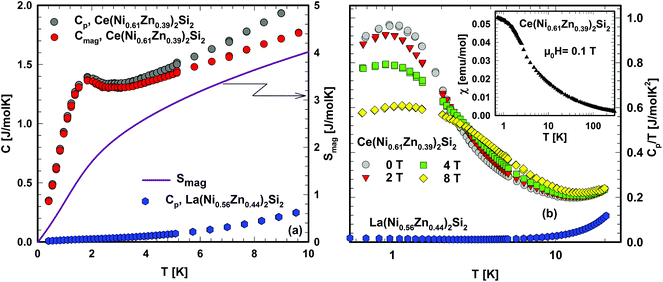
In Fig. 9 the heat capacity data of Ce(Ni0.61Zn0.39)2Si2, measured down to 400 mK, are displayed as Cpvs. T. For comparison, Cp(T) of La(Ni0.56Zn0.44)2Si2 is added, too. Below 2 K, the specific heat of Ce(Ni0.61Zn0.39)2Si2 shows an anomaly, which is attributed to Kondo-type interactions and is in close correspondence with the smooth cross-over behaviour displayed by the low temperature magnetic susceptibility shown in the inset of Fig. 9b. In order to calculate the magnetic entropy, released at low temperatures, the specific heat data of La(Ni0.56Zn0.44)2Si2 are assumed to represent the phonon contribution to this quantity, i.e., Cmag = C(Ce(Ni0.61Zn0.39)2Si2) − C(La(Ni0.56Zn0.44)2Si2). Results of this procedure are shown in Fig. 9(a) as well. Integrating Cmag/T from zero to the upper limit of the present measurements reveals the temperature dependent magnetic entropy, S, shown as a solid line in Fig. 9(a). At 3.9 K, the entropy reaches 0.45R![[thin space (1/6-em)]](https://www.rsc.org/images/entities/char_2009.gif) ln2 which according to Desgranges and Schotte,46 corresponds to a Kondo temperature TK = 3.9 K. As is obvious from Fig. 9(a), S(T) continuously increases, finally reaching a value of R
ln2 which according to Desgranges and Schotte,46 corresponds to a Kondo temperature TK = 3.9 K. As is obvious from Fig. 9(a), S(T) continuously increases, finally reaching a value of R![[thin space (1/6-em)]](https://www.rsc.org/images/entities/char_2009.gif) ln2 around 20 K. The response of the system to the application of magnetic fields is shown in Fig. 9(b), where the heat capacity data are plotted as Cp/T vs. log
ln2 around 20 K. The response of the system to the application of magnetic fields is shown in Fig. 9(b), where the heat capacity data are plotted as Cp/T vs. log![[thin space (1/6-em)]](https://www.rsc.org/images/entities/char_2009.gif) T. The overall observation that Cp/T becomes reduced by magnetic fields, concomitant with an entropy transfer to higher temperatures, is in line with a typical Kondo scenario.
T. The overall observation that Cp/T becomes reduced by magnetic fields, concomitant with an entropy transfer to higher temperatures, is in line with a typical Kondo scenario.
Comparing the absolute numbers of the low temperature Sommerfeld coefficient (γ = Cp/T) and of the susceptibility χLT, the value of the Wilson ratio, R = π2kB2χLT/[gJ2J(J + 1)μB2γ] ∼ 2, provides a further proof that a Kondo screened ground-state CEF doublet dominates the low temperature physics of Ce(Ni0.61Zn0.39)2Si2.
Finally, it is interesting to see that the substitution of Ni by Zn in CeNi2Si2 at 800 °C supports the ThCr2Si2-type only up to Ce(Ni0.82Zn0.18)2Si2, where a transition to an atom site occupation variant with the CaBe2Ge2-type is observed extending up to a composition Ce(Ni0.45Zn0.55)2Si2 and maintaining the stoichiometry Ce(Ni,Zn)2Si2. At higher Zn contents the ThCr2Si2-type reappears at temperatures below 800 °C in the form of CeZn2(Si0.7Zn0.3)2 where Zn-atoms are found to enter the Si-site. It should be noted that Zn atoms in the Ni/Zn substitution enlarge the volume and concomitantly introduce a higher electron/atom ratio. Both facts provide the basis for a gradual change from the intermediate valent Ce in CeNi2Si2 with a characteristic Kondo-lattice temperature T* ∼ 600 K (ref. 21–26) towards a localised magnetic behaviour of Ce in CeZn2(Si0.7Zn0.3)2 with a ground state close to trivalent Ce (μeff = 2.34μB).14 Intermediate compositions such as Ce(Ni0.61Zn0.39)2Si2 exhibit a Kondo-type ground state.
4. Conclusions
Although the systems La–Zn–Si and Ce–Zn–Si at 800 °C do not contain a compound “{La,Ce}Zn2Si2”, solid solutions exist starting from CeNi2Si2 by the addition of Zn which substitutes Ni. This homogeneity range has been studied for {La,Ce}(Ni1−xZnx)2Si2, 0 ≤ x ≤ 0.55. Single crystal X-ray diffraction data define the CaB2Ge2-type for the crystals of the compounds Ce(Ni0.61Zn0.39)2Si2 (P4/nmm; a = 0.41022(1) nm, c = 0.98146(4) nm) and CeNi2+xSi2−x, x = 0.33 (P4/nmm; a = 0.40150(2) nm, c = 0.95210(2) nm). Whilst the quaternary CaB2Ge2-type phase is stable at 800 °C, a reinvestigation of the Ce–Ni–Si system near the stoichiometric composition 1![[thin space (1/6-em)]](https://www.rsc.org/images/entities/char_2009.gif) :
:![[thin space (1/6-em)]](https://www.rsc.org/images/entities/char_2009.gif) 2
2![[thin space (1/6-em)]](https://www.rsc.org/images/entities/char_2009.gif) :
:![[thin space (1/6-em)]](https://www.rsc.org/images/entities/char_2009.gif) 2 revealed that the CaB2Ge2-type phase exists only at high temperatures (≥1000 °C) in the Ni-rich side. Bravais lattice changes from body centered to primitive have been observed at 800 °C starting from Ce(Ni1−xZnx)2Si2 (0 ≤ x ≤ 0.18) I4/mmm to Ce(Ni1−xZnx)2Si2, 0.25 < x ≤ 0.55, P4/nmm, however, on further Zn substitution the stability of the 1
2 revealed that the CaB2Ge2-type phase exists only at high temperatures (≥1000 °C) in the Ni-rich side. Bravais lattice changes from body centered to primitive have been observed at 800 °C starting from Ce(Ni1−xZnx)2Si2 (0 ≤ x ≤ 0.18) I4/mmm to Ce(Ni1−xZnx)2Si2, 0.25 < x ≤ 0.55, P4/nmm, however, on further Zn substitution the stability of the 1![[thin space (1/6-em)]](https://www.rsc.org/images/entities/char_2009.gif) :
:![[thin space (1/6-em)]](https://www.rsc.org/images/entities/char_2009.gif) 2
2![[thin space (1/6-em)]](https://www.rsc.org/images/entities/char_2009.gif) :
:![[thin space (1/6-em)]](https://www.rsc.org/images/entities/char_2009.gif) 2 phase is reduced (<695 °C) and it exists only with an excess amount of Zn as CeZn2(Si1−xZnx)2 with the ThCr2Si2 type.
2 phase is reduced (<695 °C) and it exists only with an excess amount of Zn as CeZn2(Si1−xZnx)2 with the ThCr2Si2 type.
The effective paramagnetic moment of Ce in Ce(Ni0.61Zn0.39)2Si2 suggests that the ground state of the Ce ions in this compound is close to trivalent. Enhanced values of the electronic contribution to the specific heat, a Curie–Weiss to Kondo-type cross-over behaviour of the low temperature susceptibility and pronounced ranges of negative logarithmic temperature dependences of the electrical resistivity reveal the presence of the Kondo effect in this cerium compound, in the context of a Wilson ratio, R ∼ 2. Unexpectedly, La(Ni0.56Zn0.44)2Si2 exhibits a spin fluctuation scenario at low temperatures together with a distinct minimum of the temperature dependent electrical resistivity which we, presumably, interpret as a Kondo effect due to a very low concentration of uncompensated nickel spins.
Acknowledgements
Z. Malik acknowledges the support from the Higher Education Commission of Pakistan (HEC) under the scholarship scheme “PhD in Natural & Basic Sciences from Austria”. F. Failamani is thankful for the support from the Austrian Federal Ministry of Science and Research (BMWF) under the scholarship scheme: Technology Grant Southeast Asia (PhD) in the frame of the ASEA UNINET. We thank Dr S. Puchegger for his expert assistance in EPMA measurements and Dr N. Ponweiser and P. Wibner for their contributions to Ce–Ni–Si at the early stage of this work. Support by the FWF P24380 is acknowledged.References
- K. R. Andress and E. Alberti, Z. Metallkd., 1935, 27 Search PubMed.
- Z. Ban and M. Sikirica, Acta Crystallogr., 1965, 18, 594–599 CrossRef CAS.
- O. S. Zarechnyuk, P. I. Kripyakevich and E. I. Gladyshevskii, Kristallografiya, 1965, 9, 706–708 Search PubMed.
- B. Eisenmann, N. May, W. Müller and H. Schäfer, Z. Naturforsch., B, 1972, 27, 1155–1157 CAS.
- W. Dörrscheidt and H. Schäfer, J. Less-Common Met., 1978, 58, 209–216 CrossRef.
- E. Parthé, B. Chabot, H. F. Braun and N. Engel, Acta Crystallogr., Sect. B: Struct. Sci., 1983, 39, 588–595 CrossRef.
- O. I. Bodak and E. I. Gladyshevskii, Izv. Akad. Nauk SSSR, Neorg. Mater., 1969, 5, 2060–2065 CAS.
- O. I. Bodak, M. G. Mis'kiv, A. T. Tyvanchuk, O. I. Kharchenko and E. I. Gladyshevskii, Izv. Akad. Nauk SSSR, Neorg. Mater., 1973, 9, 864–866 CAS.
- B. Chabot and E. Parthé, J. Less-Common Met., 1984, 97, 285–290 CrossRef CAS.
- E. R. Hovestreydt, J. Less-Common Met., 1984, 102, L27–L29 CrossRef CAS.
- F. Merlo, M. L. Fornasini and M. Pani, J. Alloys Compd., 2005, 387, 165–171 CrossRef CAS.
- P. Villars and K. Cenzual, Pearson's Crystal Data–Crystal Structure Database for Inorganic Compounds, release 2014/15, ASM International, Materials Park, OH, USA, 2014 Search PubMed.
- Z. Malik, A. Grytsiv, P. Rogl and G. Giester, Intermetallics, 2013, 36, 118–126 CrossRef CAS.
- F. Failamani, A. Grytsiv, R. Podloucky, H. Michor, E. Bauer, P. Brož, G. Giester and P. Rogl, RSC Adv., 2015, 5, 36480–36497 RSC.
- F. Steglich, J. Aarts, C. D. Bredl, W. Lieke, D. Meschede, W. Franz and H. Schäfer, Phys. Rev. Lett., 1979, 43, 1892–1896 CrossRef CAS.
- M. Rotter, M. Tegel, D. Johrendt, I. Schellenberg, W. Hermes and R. Pöttgen, Phys. Rev. B: Condens. Matter, 2008, 78, 020503 CrossRef.
- M. Rotter, M. Tegel and D. Johrendt, Phys. Rev. Lett., 2008, 101, 107006 CrossRef PubMed.
- A. S. Sefat, R. Jin, M. A. McGuire, B. C. Sales, D. J. Singh and D. Mandrus, Phys. Rev. Lett., 2008, 101, 117004 CrossRef PubMed.
- E. Bauer, R. T. Khan, H. Michor, E. Royanian, A. Grytsiv, N. Melnychenko-Koblyuk, P. Rogl, D. Reith, R. Podloucky, E.-W. Scheidt, W. Wolf and M. Marsman, Phys. Rev. B: Condens. Matter, 2009, 80, 064504 CrossRef.
- F. Kneidinger, E. Bauer, I. Zeiringer, P. Rogl, C. Blaas-Schenner, D. Reith and R. Podloucky, Phys. C, 2015, 514, 388–398 CrossRef CAS.
- G. Knebel, M. Brando, J. Hemberger, M. Nicklas, W. Trinkl and A. Loidl, Z. Phys. B: Condens. Matter, 1999, 259–261, 399–400 CrossRef CAS.
- E. V. Sampathkumaran and R. Vijayaraghavan, Phys. Rev. Lett., 1986, 56, 2861–2864 CrossRef CAS PubMed.
- M. Koterlyn, I. Shcherba, R. Yasnitskii and G. Koterlyn, J. Alloys Compd., 2007, 442, 176–179 CrossRef CAS.
- T. Toliński, K. Synoradzki, M. Koterlyn, G. Koterlyn and R. Yasnitskii, J. Alloys Compd., 2013, 580, 512–516 CrossRef.
- R. K. Singhal, N. L. Saini, K. B. Garg, J. Kanski, L. Ilver, P. O. Nilsson, R. Kumar and L. C. Gupta, J. Phys.: Condens. Matter, 1993, 5, 4013 CAS.
- M. Bertin Tchoula Tchokonté, P. de Villiers du Plessis, A. M. Strydom, T. B. Doyle, S. Ghosh and D. Kaczorowski, J. Phys. Chem. Solids, 2015, 77, 56–61 CrossRef.
- E. M. Levin, O. I. Bodak, E. I. Gladyshevskii and V. G. Sinyushko, Phys. Status Solidi A, 1992, 134, 107–117 CrossRef CAS.
- J. Rodriguez-Carvajal, FULLPROF, a program for Rietveld refinement and pattern matching analysis, Abstract of the satellite meeting on powder diffraction of the XV congress, Int. Union of Crystallography, Talence, France, 1990, p. 127; see also Search PubMed; J. Rodriguez-Carvajal, Physica B, 1993, 55, 192–194 Search PubMed.
- Nonius Kappa CCD Program Package COLLECT, DENZO, SCALEPACK, SORTAV, Nonius Delft, The Netherlands, 1998 Search PubMed.
- G. M. Sheldrick, Acta Crystallogr., Sect. A: Fundam. Crystallogr., 2007, 64, 112–122 CrossRef PubMed.
- L. J. Farrugia, J. Appl. Crystallogr., 1999, 32, 837–838 CrossRef CAS.
- M. Falmbigl, F. Kneidinger, A. Grytsiv, H. Michor, H. Müller, P. Rogl, E. Bauer, G. Hilscher and G. Giester, Intermetallics, 2013, 42, 45–51 CrossRef CAS ; see also: F. Kneidinger, H. Michor, A. Sidorenko, E. Bauer, I. Zeiringer, P. Rogl, C. Blaas-Schenner, D. Reith and R. Podloucky, Phys. Rev. B: Condens. Matter, 2013, 88, 104508 CrossRef.
- H. Zhou, Q. Yao, S. Yuan, J. Liu and H. Deng, J. Alloys Compd., 2004, 366, 161–164 CrossRef CAS.
- O. I. Bodak, E. I. Gladyshevskii and P. I. Kripyakevich, Izv. Akad. Nauk SSSR, Neorg. Mater., 1966, 2, 2151–2155 CAS.
- A. V. Morozkin, A. V. Knotko, V. O. Yapaskurt, F. Yuan, Y. Mozharivskyj and R. Nirmala, J. Solid State Chem., 2013, 208, 9–13 CrossRef CAS.
- A. V. Morozkin, Y. D. Seropegin, A. V. Gribanov, I. A. Sviridov, J. M. Kurenbaeva and A. L. Kurenbaev, J. Alloys Compd., 1998, 264, 190–196 CrossRef CAS.
- H. F. Braun, N. Engel and E. Parthé, Phys. Rev. B: Condens. Matter, 1983, 28, 1389–1395 CrossRef CAS.
- I. Zeiringer, A. Grytsiv, E. Bauer, G. Giester and P. Rogl, Z. Anorg. Allg. Chem., 2015, 641, 1404–1421 CrossRef CAS.
- L. M. Gelato and E. Parthé, J. Appl. Crystallogr., 1987, 20, 139–143 CrossRef.
- B. Belan, O. Bodak, R. Gladyshevskii, I. Soroka, B. Kuzhel, O. Protsyk and I. Stets, J. Alloys Compd., 2005, 396, 212–216 CrossRef CAS.
- A. Guzik and E. Talik, J. Alloys Compd., 2002, 346, 10–16 CrossRef CAS.
- K. Ikeda, S. K. Dhar, M. Yoshizawa and K. A. Gschneidner Jr., J. Magn. Magn. Mater., 1991, 100, 292–321 CrossRef CAS.
- B. Cornut and B. Coqblin, Phys. Rev. B: Solid State, 1972, 5, 4541–4561 CrossRef.
- D. L. Cox and N. Grewe, Z. Phys. B: Condens. Matter, 1988, 71, 321–340 CrossRef.
- P. Schlottmann, Phys. Rev. B: Condens. Matter, 1982, 25, 4815–4827 CrossRef CAS , see also: P. Schlottmann, Phys. Rev. B: Condens. Matter, 1982, 25, 4828 CrossRef , and P. Schlottmann, Phys. Rev. B: Condens. Matter, 1982, 25, 4838 CrossRef.
- H.-U. Desgranges and K. D. Schotte, Phys. Lett. A, 1982, 91, 240–242 CrossRef.
Footnotes |
| † Dedicated to Prof. Dr Wolfgang Jeitschko on the occasion of his 80th birthday. |
| ‡ Electronic supplementary information (ESI) available. See DOI: 10.1039/c5dt04705f |
| § Present address: Department of Chemistry, SNS, NUST, H-12, Islamabad, Pakistan. |
| This journal is © The Royal Society of Chemistry 2016 |

