 Open Access Article
Anticancer activity of a cis-dichloridoplatinum(II) complex of a chelating nitrogen mustard: insight into unusual guanine binding mode and low deactivation by glutathione†
Subhendu
Karmakar
,
Kallol
Purkait
,
Saptarshi
Chatterjee
and
Arindam
Mukherjee
*
Department of Chemical Sciences, Indian Institute of Science Education and Research Kolkata, Mohanpur Campus, Nadia-741246, West Bengal, India. E-mail: a.mukherjee@iiserkol.ac.in
First published on 12th January 2016
Abstract
A pyridine ring containing a chelating nitrogen mustard ligand bis(2-chloroethyl)pyridylmethylamine hydrochloride (L2·HCl) was synthesized from bis(2-hydroxyethyl)pyridylmethylamine (L1) on reaction with thionyl chloride. Both the ligands upon reaction with cis-[PtCl2(DMSO)2] afforded square planar complexes cis-[PtCl2(L1)] (1) and cis-[PtCl2(L2)] (2) respectively. Both the complexes were characterized by NMR, IR, UV and elemental analysis. 2 crystallized in the P21/c space group. 2 shows greater solution stability than 1 in kinetic studies by 1H NMR. Both 1 and 2 bind the model nucleobase 9-ethylguanine (9-EtG) and form multiple mono-adducts. Existence of unusual N7,O6 chelated guanine bound 2 (2e) was traced. Binding studies of 2 with glutathione (GSH) show formation of a mono-adduct cis-[PtCl(L2)SG] (2c), which transformed within a day to give an aziridinium ion of L2 (2b) after loss of L2. In vitro cytotoxicity of ligands, complexes and the clinical anticancer drug cisplatin show that 2 is the most potent against MCF-7, A549 and MIA PaCa2 exhibiting IC50 values of 12.6 ± 0.8, 18.2 ± 1.8 and 4.2 ± 1.0 μM respectively. The in vitro cytotoxicity of 2 against MCF-7, A549 and MIA PaCa2 was also probed in hypoxia and in the presence and absence of added GSH. Even in the presence of excess GSH in hypoxia, 2 exhibits significant cytotoxicity against MIA PaCa2 and MCF-7 with IC50 of 4.4 ± 0.8 and 12.5 ± 1.1 μM respectively. Metal accumulation studies by ICP-MS display greater cellular internalization of 2, than 1 and cisplatin in MCF-7 cells. 2 arrests the cell cycle at sub G1 and G2/M phases in MCF-7 whereas cisplatin exhibits S phase arrest to be dominant with increase in concentration. Complex 2 exhibits a change in mitochondrial membrane potential, caspase activity and suggests apoptotic cell death through the intrinsic pathway. Moreover it is encouraging to find that 2 also restricts angiogenesis in chick embryo.
Introduction
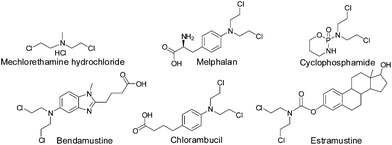
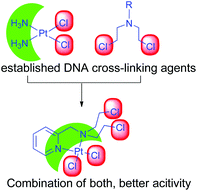
The alkylating agents bearing the –N(CH2CH2Cl)2 moiety, commonly known as ‘nitrogen mustards’ were among the first chemotherapeutic agents against cancer.1–3 However, soon it was realized that further tuning of the drugs is necessary since the side effects were too high. Hence the research continued leading to better control on the activity providing the current generation of nitrogen mustards in clinic (viz. Cyclophosphamide, Melphalan, Estramustine; Chart 1). The major objectives were to slow down the reactivity, let the drugs reach the target intact and also develop target selectivity. The mechanisms of action of the nitrogen mustards and cisplatin are mainly through cross-linking of DNA viz. purine nucleobases especially guanine.4 During their action the nitrogen mustards form an aziridinium cation (electrophile) as the active intermediate which is attacked by the electron rich N7 of guanine (nucleophile) forming intrastrand/interstrand cross-linked DNA adducts (Scheme 1A).4,5 Cisplatin also forms a cationic complex after crossing the cell membrane due to subsequent aquation, which when in proximity of guanine binds to the N7 followed by binding to another N7 of a guanine and hence it also acts as a cross-linking agent (Scheme 1B).6–8 This cross-linking leads to deformation of the helical structure which in turn hinders the replication and transcription of DNA9 leading to cell cycle arrest and apoptosis.10 The literature data suggest that at present 50% of anticancer chemotherapeutics involve platinum drugs, used either in combination or as standalone.11–13 The increase in resistance towards many of the existing chemotherapeutic agents of cancer viz. cisplatin,11,12,14 melphalan,15,16 and adriamycin16,17 also demands the invention of new molecules showing potential as anticancer agents.Among the various ways to control reactivity to minimize side effects34,35 controlling the reactivity of the lone pair on the nitrogen of the nitrogen mustard seems to be a very important factor. In order to control the reactivity of the lone pair numerous routes have been adapted which include the formation of benzyl quaternary salts of nitrogen mustards,36–39 deactivation by conjugation to electron withdrawing nitro group(s)40–42 and complexation with metal ions.43 Among the above, relatively few attempts have been made to bind metals to the nitrogen of the nitrogen mustards thus engaging the lone pair of nitrogen which may be available on reduction or loss of the metal ion under physiological conditions.43,44 The most considerable effort has been made with ‘Co’ as the metal ion providing a handful cobalt containing mustards.43–50 Platinum, which is the most widely used metal for cancer chemotherapy, has very few complexes where a nitrogen mustard is either co-ordinated to the metal center or is part of the ligand and there are few reports of anticancer activities (Table 1).18,20,21,26,29
| Serial no. | Complexes | Biological activities | Ref. |
|---|---|---|---|
| a Drawing of ligands are listed in Chart 2. Complexes containing only the –N(CH2CH2Cl)2 moiety are considered here. | |||
| 1 | cis-[Pt(L2)Cl2] | Anticancer activities studies | This work |
| 2 | cis-[Pt(L3)Cl2], cis-[Pt(L4)Cl2] | Binds to double-stranded DNA oligonucleotides, inhibits cell division in E. coli | 18 |
| 3 | cis-[Pt(L5)Cl2] | — | 19 |
| 4 | [Pt(L6)]Cl3 | Inhibits telomerase | 20 |
| 5 | cis-[Pt(L7)2Cl2] | — | 21 |
| 6 | cis-[Pt(L8)2Cl2] | — | 22 |
| 7 | cis-[Pt(L9)2Cl2] | — | 23 |
| 8 | cis-[Pt(L10)2Cl2] | — | 24 |
| 9 | cis-[Pt(L11)2Cl2] | — | 25 |
| 10 | cis-[Pt(L12)(L13)], cis-[Pt(L12)(L14)] | Active against leukemia in vivo | 26 |
| 11 | cis-[Pt(L15)(L16)Cl2], cis, cis, trans-[Pt(L15)(L16)Cl4] | — | 27 |
| 12 | cis, cis, trans-[Pt(L15)2Cl4], trans, cis, cis-[Pt(L15)2Cl4], trans-[Pt(L15)2Cl2], cis-[Pt(L15)2Cl2] | — | 28 |
| 13 | cis-[Pt(L17)2Cl2] | Active against leukemia in vivo | 29 |
| 14 | cis-[Pt(L18)2(L19)2] | — | 30 |
| 15 | cis-[Pt(L12)(L20)2] | — | 31 |
| 16 | cis-[Pt(L21)2Cl2], cis-[Pt(L-22)2Cl2] | Inactive against leukemia in vivo | 21 |
| 17 | cis-[Pt(L21)2Cl2], cis-[Pt(L21)2I2], cis-[Pt(L21)(L23)Cl2], cis-[Pt(L21)(L23)I2], cis-[Pt(L21)(L24)Cl2], cis-[Pt(L21)(L24)I2], cis-[Pt(L21)(L25)Cl2], cis-[Pt(L21)(L26)Cl2], cis-[Pt(L21)(L26)I2], cis-[Pt(L21)(L27)Cl2] | — | 32, 33 |
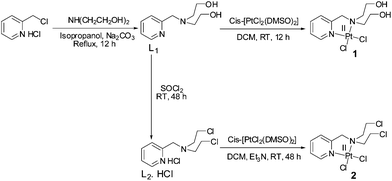
Our objective was to probe the possible effect on the mechanism of action when the nitrogen mustard is present in a Pt(II) complex (Scheme 2). Hence, we have synthesized two complexes bearing cis-dichloridoplatinum(II). The two complexes have two ligands out of which the second one has the nitrogen mustard group, bis(2-hydroxyethyl)pyridylmethylamine (L1) and bis(2-chloroethyl)pyridylmethylamine hydrochloride (L2·HCl) (Scheme 3). The impetus was to study the effect of the engagement of the lone pair on the nitrogen (in the mustard moiety) with Pt(II) leading to the coordination of the Pt center and deactivation of the nitrogen lone pair of the mustard motif which should slow down the aziridinium cation formation. The deactivation would lead to an enhanced half-life in solution leading to a greater probability of reaching the cellular targets due to less dissociation in the cytoplasm. Hence, we probed the two complexes cis-[PtCl2(L1)] (1) and cis-[PtCl2(L2)] (2) for their ability to cross-link DNA and cytotoxicity.
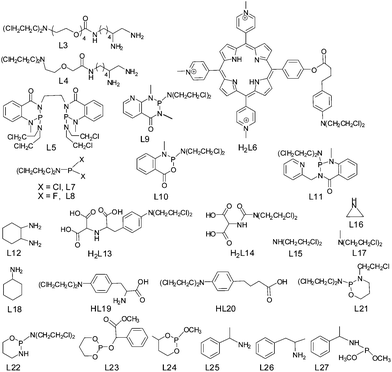 | ||
| Chart 2 Drawing of ligands (L3–L27) for the earlier reported Pt(II/IV) complexes represented in Table 1. | ||
Results & discussion
Synthesis and characterization
The ligand L1 was synthesized using a modified literature procedure51 where the hydrochloride salt of picolyl chloride was reacted with diethanolamine in the presence of a base (Na2CO3) to yield L1 (Scheme 3). The crude ligand was further reacted with SOCl2 to yield the nitrogen mustard ligand (L2·HCl) as a hydrochloride (Scheme 3). The ligands L1 and L2 showed two four-proton triplets for the methylene protons at 2.76 & 3.67 ppm and 3.76 & 3.47 ppm respectively (Fig. S1 & S3†). The two cis platinum complexes were prepared by replacing the two monodentate cis DMSO ligands of cis-[PtCl2(DMSO)2] by L1 or L2 (Scheme 3). The ligands L1 and L2 are not stable and hence a quick reaction of the ligands is necessary to obtain a good yield of the pure complexes 1 and 2 respectively. In the proton NMR spectra of 1, both the –OH protons appear as a triplet at 2.22 ppm (Fig. S5†). The aliphatic protons belonging to the mustard moiety develop a more asymmetrical nature in the complexes 1 and 2 compared to the ligands, L1 and L2. The methylene protons of two –CH2OH give a pair of two proton multiplets at 4.00 and 4.25 ppm respectively. Similarly methylene protons of the two –CH2N also give a pair of two proton multiplets at 2.86 and 3.30 ppm respectively (Fig. S5†). A similar type of spectral feature is also observed in the case of methylene protons of 2 (Fig. S10†). The 195Pt NMR of 1 & 2 showed chemical shift values of −2077.5 & −2105.5 ppm respectively (Fig. S9 and S14†), which are also in accordance with the given coordination environment containing two nitrogen atoms and two chlorine atoms in cis geometry with a Pt(II). The IR spectra of 1 displayed an intense broad band at around 3465 cm−1 for the two primary –OH groups of the ligand. The intense band at 3465 cm−1 is missing for 2, which is expected and instead a sharp peak appears at 772 cm−1 for the aliphatic (C–Cl) stretching supporting the presence of a nitrogen mustard moiety in the ligand. The bulk analytical purity of 1 & 2 was confirmed by elemental analysis which matches well with the calculated percentage of C, H & N.X-ray crystallography
The attempts to crystallize the complexes led to only good diffraction quality single crystals of complex 2. It was found to crystallize with the space group P21/c in a monoclinic system (Table S1†). Each unit cell contains 4 complexes with density 2.456 mg mm−3. The crystal structure shows that the pyridine ring, platinum, the chlorides and one tertiary carbon atom are in the same plane whereas in the chloroethyl group of the two mustards, one is above and the other is below the plane (Fig. 1). The Pt metal centre is present in a square planar arrangement where the average Pt–Cl and Pt–N bond distances are ca. 2.29(1) & 2.04(1) Å respectively (Table 2). The N–Pt–N angle is 82.79(18)° which is lesser than two cis N–Pt–Cl and Cl–Pt–Cl angles (Table 2). The bond distances are quite within expectation and so is the square planar geometry of the Pt(II).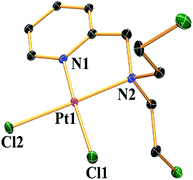 | ||
| Fig. 1 ORTEP diagram of complex 2. The thermal ellipsoids are drawn at 50% probability level and hydrogens have been omitted for clarity. | ||
| Bond angles (Å) | Bond lengths (°) | ||
|---|---|---|---|
| Pt1–Cl1 | 2.2977(14) | Cl2–Pt1–Cl1 | 88.38(5) |
| Pt1–Cl2 | 2.2903(13) | N1–Pt1–Cl2 | 94.38(13) |
| Pt1–N1 | 2.012(4) | N1–Pt1–Cl1 | 177.20(12) |
| Pt1–N2 | 2.076(4) | N1–Pt1–N2 | 82.79(18) |
| N2–Pt1–Cl2 | 176.84(13) | ||
| N2–Pt1–Cl1 | 94.44(13) | ||
Compound stability in solution
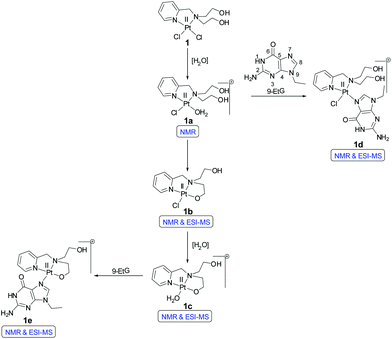
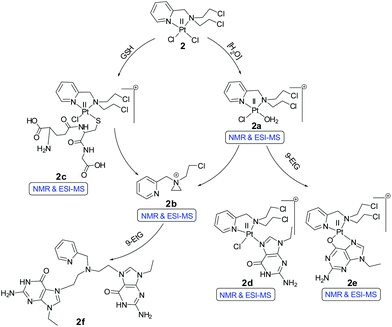
The solution stability of complexes 1 & 2 was performed in 20% PBS (pD 7.4, prepared in D2O) in DMSO-d6. A greater ratio of D2O or H2O with DMSO-d6 could not be used, since in order to conduct the kinetic studies with a good signal to noise ratio the complex concentration required often showed precipitation within a short time upon increasing the D2O or H2O ratio at the concentrations used (5–7 mM). The ESI-MS speciation during the hydrolysis study of both 1 and 2 are tabulated in Tables S2 and S3† respectively. The NMR experiments confirm the formation of hydrolyzed species. The square planar cis-dichlorido platinum complex has two monodentate chlorido ligands which may be replaced by water molecules in aqueous solvents. In both the complexes 1 & 2, one of the chlorido ligands is replaced first in aqueous solutions resulting in the mono aqua platinum complexes. Due to the higher bond distance of the Pt–Cl trans to the Pt–N bond of the pyridyl nitrogen (observed in the crystal structure of 2, Table 2) mono aquation would take place trans to the pyridyl nitrogen due to ‘trans effect’. It should be noted that the mono aquation would be difficult to suggest from the 1H NMR and ESI-MS of the complexes alone. However, when the NMR data of the other binding experiments (with 9-EtG or GSH) are interpreted the results suggest the formation of mono aquated species for both 1 and 2, discussed later in this section.The NMR and ESI-MS data suggest that complex 1 forms multiple hydrolyzed species. Three new sets of peaks form within 2 h in the aromatic region of complex 1 apart from the original complex peaks [9.01 (H6), 8.10 (H4), 7.62 (H3) and 7.47 (H5) ppm (Fig. S15†)]. Among the new set of peaks, the H6 protons are the most well resolved ones and they appear at 9.11, 8.96 and 8.69 ppm. The other proton (H4, H3 & H5) peaks are not well resolved in distinct sets hence not mentioned in the discussion further (Fig. S15†). The H6 doublet at 9.11 ppm corresponds to the mono aquated complex 1 (1a, Scheme 4). The hydroxyethyl arm of L1 seems to bind itself through the O-donor to the Pt(II) center once a chloride has left and renders a stable five membered N,O-bonded chelate ring (Scheme 4). This may negatively influence the DNA interaction with the Pt(II) centre in 1 due to the incurred steric hindrance. The H6 doublet at 8.69 ppm is assigned to the mono chlorido N,O-chelated 1b (Scheme 4). The doublet at 8.96 ppm is the aquated species 1c (Scheme 4). The ESI-MS speciation (Fig. S18 and S19†) and isotopic distribution of the obtained m/z peaks (Fig. S20 and S21†) also confirm the generation of species 1b and 1c. Although initially the hydrolysis starts within 2 h for complex 1 but even after 2 days the hydrolysis is not more than 45%.
The NMR results show that complex 2 under the same experimental conditions (20% PBS in D2O pD 7.4, in DMSO-d6) hydrolyzes less compared to 1 (Fig. S24†). The peaks at 9.10 (H6), 8.24 (H4) and 7.82 (H3) ppm correspond to the mono aquated complex (2a, Scheme 5) and the intensity (Fig. S24,† H5 proton of the aquated complex is buried within original complex H5) did not increase more than 10–12% up to 72 h. However, after around 24 h new peaks at 8.67, 8.39 and 7.87 ppm appear (Fig. S24†). These peaks correspond to the H6, H4 & H3 (H5 was merged within H3) protons of the aziridinium ion (2b, Scheme 5) which may be formed after the dissociation of the ligand from the metal ion. The stability studies of 2 in 20% H2O in DMSO-d6, showed that within an hour almost 45% of the complex is hydrolyzed (Fig. S25†) in the unbuffered solution, compared to ca. 10% hydrolysis in the presence of 20% PBS (Fig. S24†). However, even in 20% H2O in DMSO-d6 the aziridinium cation formation time still remains to be ca. 24 h (Fig. S25†), suggesting that the dissociation of the platinum from the ligand does not exhibit dependence on the chloride concentration. Stability of 2 was also tested in neat DMSO-d6 (by 1H NMR, Fig. S26†) since stock solutions for cytotoxicity are in general made in DMSO after which the necessary dilutions in media or buffer are made and added to the cells. The event of stock solution making and dilution in the respective wells do not take more than 10–15 min. The NMR of 2 in neat DMSO-d6 showed that up to 6 h there was no observable dissociation.
The formation of aziridinium is an important step in the mechanistic pathway of alkylation by nitrogen mustards. The initiation of the aziridinium cation formation after 24 h as per the NMR studies indicates a greater lifetime of complex 2 in solution which is advantageous. The delayed formation of an aziridinium cation suggests that the alkylation by the aziridinium may take place well even after the Pt(II) has been consumed by other nucleophiles inside the cell.
9-Ethylguanine binding study
The cytotoxic properties of nitrogen mustards and Pt(II) drugs are attributed to the binding ability towards the deoxyguanosine rich region of DNA via intra or interstrand cross-links. We performed the binding ability of 1 & 2 (by NMR and ESI-MS) using the model nucleobase 9-ethylguanine (9-EtG). The N7 of guanine is the favored binding position52 and a downfield chemical shift of the H8 immediate next to the N7 is known to be observed in the 1H NMR after the binding with the metal center.On addition of three molar equivalents of 9-EtG compared to complex 1 in 20% PBS (pD 7.4, prepared in D2O) in DMSO-d6, there is formation of a mono-adduct (1d, Scheme 4) as shown by the shift of the H8 proton of the 9-EtG from 7.69 to 8.45 ppm (marked as H8*) within 6 h (Fig. S16†). This corroborates well with the mono-adduct of formulation [(1 − Cl−) + 9-EtG]+ as per the observed ESI-MS peak at m/z 606.1368 (calcd 606.1349) (Table S2 and Fig. S19†) including the isotopic distribution (Fig. S22†). The above data support the possibility of mono aquation followed by binding of 9-EtG.
However, there is the presence of another peak corresponding to the H8 which appears at 8.40 ppm (marked as H8**) (Fig. S16†). This new peak may be attributed to the binding of one of the hydroxo oxygens of L1 to the Pt(II) in 1 leading to a five-membered stable chelate bound to the 9-EtG (1e, Scheme 4) also supported by ESI-MS providing a m/z of 569.1595 (calcd 569.1589) corresponding to the 9-EtG mono-adduct of formulation [(1 − 2Cl−) + 9-EtG − H+]+ (Table S2, Fig. S19† & isotope modelling at Fig. S23†). A similar speciation of related platinum complexes has also been found earlier in the literature.53–56 Both the hydrolysis and binding to 9-EtG went up to ca. 10 h with an almost equal rate but after 10 h the binding rate predominates and the peaks corresponding to the hydrolyzed species 1a and 1c start to decrease and the 9-EtG adducts 1d and 1e start to increase (Fig. S16† and Scheme 4). The signals for the pyridyl hydrogens corresponding to the adducts 1d and 1e appear to be poorly resolvable at ca. 8.95 (H6), 7.68 (H3) and 7.27 (H5) ppm (H4 signal was buried within hydrolyzed complex signals, Fig. S16†). The reason may be that the chemical shift of H8 for 9-EtG bound 1 (1d and 1e in Scheme 4) has only a difference of 0.05 ppm (Fig. S16†). Hence the effect of the difference in the environment on the chemical shifts of H3, H5 and H6 is so small that they are not resolved well for 1d and 1e. Similar results are also obtained for the chemical shifts of pyridyl hydrogens in complex 2 upon binding with 9-EtG (discussed later).
We have also observed the speciation of 1 during 9-EtG binding by 195Pt NMR. It displays an initial chemical shift of −2135.8 ppm for 1, which after one day diminished and produced a broad peak around −2205 ppm (Fig. S17†). The observed chemical shift of H8 in 1d and 1e (Scheme 4) only has a difference of 0.05 ppm. Hence, due to a similarity in the bonding nature the two Pt species generated show similar chemical shifts resulting in the poorly resolvable 195Pt NMR, which is depicted by the appearance of a single broad peak although 1d and 1e are two different species.
At a first glance it may seem that the 9-EtG bound species of 1 might appear to be in syn and anti configurations giving rise to the two new H8 peaks. However, the trans effect of the pyridyl nitrogen leading to the preferential displacement of the Cl−trans to the pyridyl nitrogen and the strain involved in trying to go to the anti configuration suggests that only the syn configuration might prevail. In spite of that even if the anti configuration would have been present it should lead to more difference in the chemical shift than what is observed. Hence, the very little chemical shift in 1H and 195Pt NMR for both the 9-EtG bound species exclude the possibility of the presence of any syn/anti isomers.57 Later it is shown that in the case of complex 2 which has more changes in the chemical environment after binding with 9-EtG compared to 1, as is evident also from the shift in H8, the speciation is rather prominent in the 195Pt NMR.
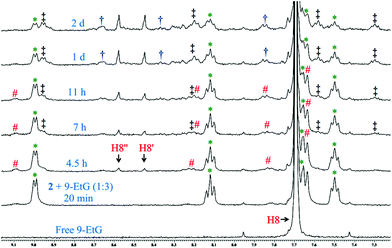
The binding studies of 9-EtG with complex 2 following the same experimental condition as 1 also shows the mono-adduct of 9-EtG with 2 within 4.5 h after mixing (Fig. 2). The H8 signal of 9-EtG at 7.69 ppm is shifted to 8.44 ppm (H8′). The ESI-MS data showed a m/z at 642.0645 (calcd 642.0657) which matches well with [(2 − Cl−) + 9-EtG]+ (Table S3, Fig. S37† & isotope modelling at Fig. S43†), pointing towards the formation of mono-adduct (2d, Scheme 5). Complex 2 showed another new chemical shift for the H8 (8.57 ppm, marked as H8′′, Fig. 2) which is not seen in 1. This peak is assigned as the 9-EtG chelated mono-adduct with the Pt(II) center in 2. The chelation happens through the N7 and O6 of 9-EtG (2e, Scheme 5). The m/z at 606.0881 (calcd 606.0896) matches well with the formulation [(2 − 2Cl−) + 9-EtG − H+]+ (Table S3 and Fig. S37†) and the simulated isotopic distribution (Fig. S44†).
The formation of the N7,O6 chelate is controversial. However, although scarce the literature shows that N7,O6 chelation is structurally reported58 in a multinuclear Pt(II) complex and a mononuclear Pt(II) intermediate bearing N7,O6 chelation is also reported through ESI-MS characterization.59 It should be noted here that this type of speciation has been found in the NMR studies but will not be favoured when the guanine is part of a DNA strand (in complex 1 we do not see the N7,O6 chelation since a –OH from the ligand chelates to the Pt). After 11 h the intensity of the signals at 9.10 (H6), 8.24 (H4) & 7.82 (H3) ppm for the initially hydrolyzed species (2a) started to decrease and the poorly resolvable peaks corresponding to the two different types of 9-EtG adducts (2d & 2e) at 8.96 (H6), 8.21 (H4), 7.58 (H3) and 7.31 (H5) ppm started to increase with time (Fig. 2). The aliphatic region also contains the signals of 9-EtG binding by complex 2 as shown in Fig. S29.† 9-EtG binding monitored by 195Pt NMR displays a change of the initial chemical shift of −2159.8 ppm (of 2) to −2216.0 & −2205.0 ppm after 1 day of 9-EtG addition (Fig. S30†) which also supports the formation of two types of 9-EtG adducts 2d and 2e respectively as predicted by 1H NMR and ESI-MS. The results suggest that the Pt(II) in 2 may first bind to a DNA base and then if the platinum is taken away by other cellular nucleophiles of higher affinity for Pt, viz. GSH, an exposed thiol of proteins then dissociated L2 due to the availability of the nitrogen lone pair forms the aziridinium cation which may act as a potential DNA cross-linking agent, under cellular conditions and hence enhance the cytotoxicity of 2, which is not possible in the case of 1.
Glutathione binding study
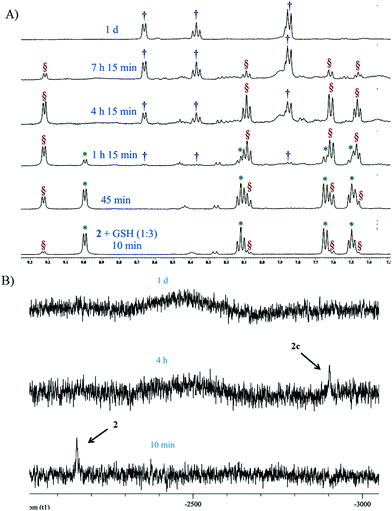
Complex 2 was also probed for its reactivity with the well-known thiol containing cellular tripeptide glutathione (GSH) which is abundant in most cancer cells and is thought to be one of the major components responsible for the deactivation of platinum drugs and hence drug resistance.60 The GSH binding study of the most active complex 2 in 20% PBS (pD 7.4, prepared in D2O) in DMSO-d6 showed a quick formation of the GSH bound complex within 10 minutes (Fig. 3A and S31†). This is confirmed by the appearance of new peaks for the H6, H4, H3 and H5 protons at 9.23, 8.08, 7.62 and 7.46 ppm respectively which in the unbound complex 2 appear at 9.00, 8.14, 7.65 and 7.51 ppm respectively (Fig. 3A). The result shows that GSH/cellular thiols may affect the activity of 2. In the aliphatic region, a new multiplet at 2.2 ppm of the methylene protons (marked as c′) attached to the thiolate group (–SH) appears due to the binding with the Pt(II) center of 2 which in the unbound form appears at 2.8–2.7 ppm (marked as c) (Fig. S31†). The above interpretation is well supported by literature evidence which has also suggested a similar adduct of Pt with GSH.61,62 The ESI-MS data of the solution show m/z of 770.0684 (calcd m/z 770.0688) which matches well with the species [(2 − Cl−) + (GSH − H+) + H+]+ (Table S3, Fig. S38† & isotope modelling at Fig. S42†) suggesting the formation of the proposed mono-adduct (2c, Scheme 5). In addition there are other peaks present which are a good match for various sodium ion containing adducts of the same species. These appear at m/z 792.0432 ([(2 − Cl−) + (GSH − 2H+ + Na+) + H+]+, calcd m/z 792.0508), 814.0299 ([(2 −Cl−) + (GSH−3H++2Na+) + H+]+, calcd m/z 814.0327) and 836.0093 ([(2 −Cl−) + (GSH−3H++2Na+) + Na+]+, calcd m/z 836.0146) respectively (Table S3 and Fig. S38†) strengthening the identity of the predicted species (2c, Scheme 5). 2 completed the GSH adduct formation within 4.5 h. During this time there is also an appearance of the free aziridinium cation (2b, Scheme 5) as is evident from the peaks at 8.67 (H6), 8.39 (H4) & 7.87 (H3 & H5) ppm (aromatic region, Fig. 3A) and 4.62 (CH2N+), 4.18 (PyCH2), 3.76 (CH2Cl), 3.13 (CH2N+) & 2.93 (C![[H with combining low line]](https://www.rsc.org/images/entities/char_0048_0332.gif) 2CH2Cl) (aliphatic region, Fig. S31†). After 7 h the peak intensities corresponding to the GSH adduct start decreasing and the peaks corresponding to the aziridinium cationic species start increasing (Fig. 3A and S31†). However, after a day all the GSH adduct peaks vanished and only the aziridinium ion peaks were visible (Fig. 3A and S31†). This was also supported by ESI-MS where m/z 197.0805 (calcd m/z 197.0845) corresponding to the aziridinium ion only prevailed as the base peak (Table S3, Fig. S39† & isotope modelling at Fig. S41†). GSH binding kinetics monitored by 195Pt NMR displayed a peak at −2156.8 ppm when the spectrum was recorded within 20 min of addition, which shifted to −2902.2 ppm after 4 h (Fig. 3B). The above data support the attachment of the sulfur to the Pt(II) centre. After a day the chemical shift responsible for the GSH adduct vanishes.
2CH2Cl) (aliphatic region, Fig. S31†). After 7 h the peak intensities corresponding to the GSH adduct start decreasing and the peaks corresponding to the aziridinium cationic species start increasing (Fig. 3A and S31†). However, after a day all the GSH adduct peaks vanished and only the aziridinium ion peaks were visible (Fig. 3A and S31†). This was also supported by ESI-MS where m/z 197.0805 (calcd m/z 197.0845) corresponding to the aziridinium ion only prevailed as the base peak (Table S3, Fig. S39† & isotope modelling at Fig. S41†). GSH binding kinetics monitored by 195Pt NMR displayed a peak at −2156.8 ppm when the spectrum was recorded within 20 min of addition, which shifted to −2902.2 ppm after 4 h (Fig. 3B). The above data support the attachment of the sulfur to the Pt(II) centre. After a day the chemical shift responsible for the GSH adduct vanishes.
The dissociation of the Pt(II) bound GSH adduct of 2 and the formation of the aziridinium ion after a certain time as observed in NMR and ESI-MS may be due to a greater trans effect of the S donor in the Pt bound –SG group which helps to dissociate the chelating ligand L2. Following the above, the formation of a polymeric Pt–S–Pt bridged species may take place, which may lead to loss of NMR signals as documented in the literature.61 The reason behind this seems well appreciable that the polymeric species should have slow molecular tumbling in solution and quick chemical shift anisotropy relaxation leading to extensive spectral broadening making the polymeric Pt(II) species invisible in NMR.61
The GSH binding in the DMSO–PBS mixture excludes the competitive binding possibility of DMSO, since no traces of DMSO bound complex 2 were found in NMR and ESI-MS (the DMSO co-ordinated complex 2 gives the 195Pt signal at −2973.6 ppm,63 Fig. S27†). However, to assign the influence of the solvent DMSO we have used the non-coordinating solvent DMF-d7 and performed the NMR binding experiment of 2 with GSH (1![[thin space (1/6-em)]](https://www.rsc.org/images/entities/char_2009.gif) :
:![[thin space (1/6-em)]](https://www.rsc.org/images/entities/char_2009.gif) 3) in 20% PBS in DMF-d7 (PBS prepared in D2O, uncorrected pD 7.4). The GSH-adduct 2c only starts appearing after 1 h (Fig. S32†) in the case of the DMF-d7/PBS mixture whereas in the DMSO-d6/PBS mixture it appears within 10 min. The aziridinium (2b) formation in DMSO-d6/PBS starts appearing after ca. 1 h (Fig. 3A) whereas in DMF-d7 the same (2b) is found to appear only after ca. 3 h (Fig. S32†). 195Pt NMR also gives the indication of delayed formation (ca. 6 h) of 2c at −2910.9 ppm shifted from an initial chemical shift value of 2 at −2164.6 ppm (Fig. S33†). The above results signify that the solvent DMSO has an influence in increasing the lability. The other notable difference is the precipitation of an almost insoluble species (yellow precipitate) which may be a Pt–S–Pt bridged polymer. We recorded the IR spectrum of the yellow precipitate which provided some useful information. We found that the IR band corresponding to the C–Cl stretching at 772 cm−1 (Fig. S34A†) is absent in the precipitate. The IR data showed that there is much similarity of the precipitate with the GSH IR spectrum and almost no similarity with the complex IR spectrum. A band corresponding to the carbonyl (amide) stretching frequency at 1622 cm−1 is observed for the precipitate with a hypsochromic shift from 1600 cm−1 in the free GSH (Fig. S34B†). This may be due to the interaction with Pt. In addition the IR spectra showed that the S–H stretching frequency at 2522 cm−1 was absent in the yellow precipitate (Fig. S34C†) suggesting that the precipitate may contain Pt–S bonded species. We also found a broad band at 3550–2700 cm−1 (Fig. S34C†) which suggests the polymeric nature of the yellow precipitate as supported by the literature data of the reaction of cisplatin with GSH.64
3) in 20% PBS in DMF-d7 (PBS prepared in D2O, uncorrected pD 7.4). The GSH-adduct 2c only starts appearing after 1 h (Fig. S32†) in the case of the DMF-d7/PBS mixture whereas in the DMSO-d6/PBS mixture it appears within 10 min. The aziridinium (2b) formation in DMSO-d6/PBS starts appearing after ca. 1 h (Fig. 3A) whereas in DMF-d7 the same (2b) is found to appear only after ca. 3 h (Fig. S32†). 195Pt NMR also gives the indication of delayed formation (ca. 6 h) of 2c at −2910.9 ppm shifted from an initial chemical shift value of 2 at −2164.6 ppm (Fig. S33†). The above results signify that the solvent DMSO has an influence in increasing the lability. The other notable difference is the precipitation of an almost insoluble species (yellow precipitate) which may be a Pt–S–Pt bridged polymer. We recorded the IR spectrum of the yellow precipitate which provided some useful information. We found that the IR band corresponding to the C–Cl stretching at 772 cm−1 (Fig. S34A†) is absent in the precipitate. The IR data showed that there is much similarity of the precipitate with the GSH IR spectrum and almost no similarity with the complex IR spectrum. A band corresponding to the carbonyl (amide) stretching frequency at 1622 cm−1 is observed for the precipitate with a hypsochromic shift from 1600 cm−1 in the free GSH (Fig. S34B†). This may be due to the interaction with Pt. In addition the IR spectra showed that the S–H stretching frequency at 2522 cm−1 was absent in the yellow precipitate (Fig. S34C†) suggesting that the precipitate may contain Pt–S bonded species. We also found a broad band at 3550–2700 cm−1 (Fig. S34C†) which suggests the polymeric nature of the yellow precipitate as supported by the literature data of the reaction of cisplatin with GSH.64
Cell viability assay
The binding studies for both 1 and 2 exhibited strong interaction with the model substrate 9-EtG, but the cellular toxicity data of various cell lines suggested that only 2 is toxic and not 1 or the ligands. The cell lines investigated were MCF-7, A549, HeLa WT, MIA PaCa2 and a non-tumor cell line HEK293 (Table 3). L2 being a nitrogen mustard should have been toxic, but in the absence of the attached metal ion the active lone pair on the aliphatic nitrogen may be leading to the formation of the aziridinium ion which in turn is attacked by potential nucleophiles in the media leading to quenching of alkylating ability. Hence L2 was not found to be toxic even at a dose of 100 μM. 2 shows the highest toxicity in normoxia against MIA PaCa2 with an IC50 of 4.2 ± 1.0 μM (p < 0.05). In MCF-7 and A549 the activity of 2 is lesser with the IC50 range of ca. 12–18 μM in normoxia (Table 3). Cisplatin shows much less activity in vitro for MIA PaCa2 displaying an IC50 of 31.8 ± 4.8 μM (p < 0.01). A similar IC50 between 2 (7.6 ± 1.0 μM, p < 0.05) and cisplatin (7.0 ± 1.0 μM, p < 0.05) was seen in the case of the HeLa WT cell line (Table 3).| IC50 ± SDa (μM) | |||||||||||||
|---|---|---|---|---|---|---|---|---|---|---|---|---|---|
| Normoxiab | Hypoxiac | ||||||||||||
| MCF-7 | MCF-7 + GSHd | A549 | A549 + GSHd | HeLa WT | MIA PaCa2 | HEK293 | MCF-7 | MCF-7 + GSHd | A549 | A549 + GSHd | MIA PaCa2 | MIA PaCa2 + GSHd | |
| a SD means standard deviation, IC50 values were calculated by nonlinear curve fitting in dose response inhibition – variable slope model using Graph pad prism, the data presented have significance (p value) less than 0.05 or better. b IC50 was determined under normoxic conditions. c IC50 was determined under hypoxic conditions (1.5% O2). d The amount of GSH used in all cases was 20 molar equivalent of the IC50 value of 2 in normoxia in the respective cell lines. e ND means not determined. | |||||||||||||
| 1 | 165.6 ± 13.4 | NDe | 752.2 ± 15.6 | NDe | 178.1 ± 12.5 | >100 | >200 | NDe | NDe | NDe | NDe | NDe | NDe |
| 2 | 12.6 ± 0.8 | 16.4 ± 1.2 | 18.2 ± 1.8 | 31.2 ± 4.2 | 7.6 ± 1.0 | 4.2 ± 1.0 | 14.9 ± 0.8 | 9.4 ± 2.2 | 12.5 ± 1.1 | 20.8 ± 1.5 | 26.6 ± 3.5 | 3.4 ± 0.2 | 4.4 ± 0.4 |
| L1 | >500 | NDe | >500 | NDe | NDe | NDe | NDe | NDe | NDe | NDe | NDe | NDe | NDe |
| L2·HCl | >100 | NDe | >100 | NDe | NDe | NDe | NDe | NDe | NDe | NDe | NDe | NDe | NDe |
| cis-[PtCl2(DMSO)2] | >100 | NDe | >100 | NDe | NDe | NDe | NDe | NDe | NDe | NDe | NDe | NDe | NDe |
| Cisplatin | 14.1 ± 1.2 | 27.8 ± 2.1 | 22.8 ± 1.2 | 41.3 ± 1.5 | 7 ± 1.0 | 31.8 ± 4.8 | >50 | 18.7 ± 1.4 | 29.0 ± 1.1 | 24.4 ± 1.1 | 39.3 ± 1.3 | 18.1 ± 2.9 | 29.7 ± 4.1 |
One important observation apart from the higher cytotoxicity of 2 against MIA PaCa2 is the higher activity of 2 against HEK293. HEK293 is known to express a greater amount of human copper transporting ATPases (ATP7A and ATP7B).65 ATP7A and ATP7B are two known copper pumps which help efflux of cisplatin from cancer cells.66–69 In each of these proteins there are a few conserved cysteine residues (Cys19 and 22 in ATP7A; Cys12 and 15 in ATP7B) which bind to cisplatin leading to its deactivation and efflux.70 Our IC50 data on cisplatin against HEK293 (IC50 > 50 μM) corroborate well with the literature and at the same time we find that, 2 is active (IC50 = 14.9 ± 0.8 μM, p < 0.01) against HEK293 (Table 3) under similar experimental conditions which suggests that the deactivation mechanism that works for cisplatin is unable to deactivate 2 emphasizing that 2 has the potential to be active even in those cancer cells that are resistant due to the overexpression of ATP7A and ATP7B.
After observing the encouraging toxicity profile of 2 compared to cisplatin in normoxia, IC50 data were evaluated in hypoxia against MCF-7, A549 and MIA PaCa2. Against MCF-7 in hypoxia, the IC50 value of cisplatin (18.7 ± 1.4 μM, p < 0.05) is increased whereas 2 retained its IC50 value or more correctly the IC50 was better (9.4 ± 2.2 μM, p < 0.05) (Table 3). The results show that the dosage of 2 does not worsen like that of cisplatin, in MCF-7 in hypoxia, suggesting that the presence of the nitrogen mustard on 2 acts in favour of enhancing the cytotoxicity. However, in the case of A549 the trend was not similar, the IC50 of 2 becomes poor (20.8 ± 1.5 μM, p < 0.05) compared to normoxia. The existing clinical drug cisplatin which is a clinically relevant lung cancer drug also exhibits poor IC50 (24.4 ± 1.1 μM, p < 0.05) in hypoxia as compared to normoxia, against A549 under similar conditions (Table 3). The hypoxia IC50 of 2 (3.4 ± 0.2 μM, p < 0.05) against MIA PaCa2 is almost similar to normoxia (IC50 = 4.2 ± 1.0 μM, p < 0.05). Cisplatin shows a good response against MIA PaCa2 in hypoxia (IC50 = 18.1 ± 2.9 μM, p < 0.05) in comparison with normoxia (IC50 = 31.8 ± 4.8 μM, p < 0.05) but the dosage required is still more than 5 times of 2 as per our in vitro studies (Table 3).
We also studied the influence of GSH on the cytotoxic activity of complex 2in vitro (used 20 molar equivalents of GSH with respect to the IC50 in normoxia for 2 in the respective cell lines). In MCF-7 the deactivation of 2 by GSH was less than that of cisplatin. The IC50 of 2 under hypoxia in the presence of GSH (IC50 = 12.5 ± 1.1 μM, p < 0.05) was similar to that of the IC50 in normoxia without GSH (IC50 = 12.6 ± 0.8 μM, p < 0.001) (Table 3). In A549, the response to GSH deactivation was more and the dose escalated to achieve IC50 in the presence of GSH in hypoxia signifying that 2 has relatively poor potential against A549 (Table 3). In the case of MIA PaCa2, the deactivation by GSH is not significant, since 2 retains IC50 (4.4 ± 0.8 μM, p < 0.05) similar to normoxia (4.2 ± 1.0 μM). However, cisplatin in the presence of the same amount of GSH (as used for 2) shows worsening of IC50 (29.7 ± 4.7 μM, p < 0.05) (Table 3).
In an earlier section when we showed the binding activity of 2 with GSH we found that the binding of 2 completes within 4.5 h but our in vitro toxicity data show that even in the presence of excess GSH (20 molar equiv. compared to the IC50) complex 2 remains much more efficient than that of cisplatin. Hence the presence of nitrogen mustard in 2 renders it more cytotoxic, since the ammine ligand of cisplatin cannot compete with the aziridinium ion in terms of cytotoxicity. In NMR conditions we do not see any 9-EtG (2f, Scheme 5) or GSH binding by the aziridinium cation formed in the solution suggesting that under the NMR experimental concentration GSH or 9-EtG does not bind to the aziridinium ion.
It is not very well evidenced why L2 is not cytotoxic at all although complex 2 is cytotoxic even in the presence of GSH as per the repetitive in vitro studies. One reason could be that due to instability in its non-complexed state there is quick hydrolysis or aziridinium formation of the ligand in solution leading to binding with other nucleophiles in its vicinity, before entering the cells, leading to its deactivation. For complex 2 the dose escalation to achieve IC50 in the presence of GSH is more in A549 whereas in MCF-7 or MIA PaCa2 the dosage to achieve IC50 in the presence of GSH in hypoxia differs by a small amount and does not exceed the dose required in normoxic conditions without any added GSH. The difference in uptake mechanism or more internal degradation of 2 inside A549 may be responsible for this pattern of activity. From our studies this is not very well understood. However, this interesting phenomenon may be investigated by a relevant expert in cancer biology. The results however signify that the studies in the buffer may not exactly correlate with the in vitro cytotoxicity studies due to the presence of the nitrogen mustard in 2 which forms aziridinium, as per the NMR studies, but did not react with GSH may increase the in vitro cytotoxicity. In addition the presence of other potential nucleophile molecules in the media may lead to competition in binding of the Pt with GSH preventing deactivation.
The Pt(II) in 2 being bound to GSH depletes the local GSH pool helping the nitrogen mustard upon dissociation from Pt(II) to bind to various alkylating targets inside the cell through the formation of the cationic aziridinium intermediate. 2 also shows that under similar conditions it is at least 3 times more active against the pancreatic cancer cell line MIA PaCa2 compared to MCF-7, A549 or HEK293. The results hence are suggesting that the in vitro mechanistic pathway is more complicated and may show significant changes compared to that found through NMR. The results suggest that although we conclude the pattern of GSH binding based on the NMR studies and extrapolate it to the deactivation/non-deactivation of the complexes. It may be a good idea to also perform the cytotoxicity assays in the presence of GSH during in vitro studies since that better represents the cell condition compared to the NMR tube and hence would project the differences if any. The above argument corroborates well with the cytotoxicity pattern observed for 2. This is also additionally supported by the higher activity of 2 in the HEK293 cell line which has ATP7A and ATP7B copper pumps where there are cysteine residues which bind to cisplatin and deactivates the drug but not complex 2 suggesting that in vitro the affinity towards sulfur may be different compared to that observed in NMR conditions.
Combining the NMR studies with the cytotoxicity data it is suggested that the binding is due to the hydrolysis of the chloride from 1 or 2 but the efficiency of 2 is due to the presence of the nitrogen mustard which later upon dissociation from the metal alkylates DNA. This alkylation is not possible in the case of complex 1 or cisplatin. Hence, the presence of the nitrogen mustard acts synergistically to increase the toxicity. The Pt binding not only stabilizes the nitrogen mustard in complex 2 but also helps its entry into the cell due to the stability gained. Inside the cell due to the release of the mustard from the Pt(II) complex the alkylating ability is manifested. In addition the initiation of binding by the Pt(II) also helps its proximity to the DNA bases when released which might be one of the reasons of enhancement of activity. As discussed above the presence of two cross-linking moieties also has an impact on the cytotoxicity in the presence of GSH where the Pt helps in depleting some GSH population by binding to them and the mustard upon release hence faces less resistance from the GSH pool.
Metal accumulation inside MCF-7 cells using ICP-MS
The accumulation of platinum inside the cells was probed using MCF-7. After treating equal concentrations (12 μM) of each complex for 24 h, the platinum content of each set was determined by ICP-MS. It was found that 2 is prone to penetrate the cell membrane and accumulate more Pt(II) inside MCF-7 cells compared to 1 or cisplatin at the same dose of treatment (Fig. 4). The comparatively higher uptake of 2 leading to more Pt(II) inside the cell correlates well with its higher resistance to hydrolysis compared to 1 or cisplatin as discussed earlier. In addition as per the 195Pt NMR studies in the DMSO–media mixture (60![[thin space (1/6-em)]](https://www.rsc.org/images/entities/char_2009.gif) :
:![[thin space (1/6-em)]](https://www.rsc.org/images/entities/char_2009.gif) 40 DMSO-d6
40 DMSO-d6![[thin space (1/6-em)]](https://www.rsc.org/images/entities/char_2009.gif) :
:![[thin space (1/6-em)]](https://www.rsc.org/images/entities/char_2009.gif) DMEM v/v) probed for 2 over 18 h we find that the native Pt(II) complex is still present in the solution (Fig. S28†). It should be noted here that if other species are formed and they are still smaller in concentration then we will not be able to see them in the 195Pt NMR but the presence of the native complex peak at ca. −2159.8 ppm even after 18 h is encouraging. Another important observation made here is that when compared with the IC50 results it seems that although platinum accumulation is lower inside MCF-7 for cisplatin, yet the IC50 is similar in MCF-7 suggesting cisplatin is more effective in MCF-7 when the relative Pt(II) content inside the cell is compared. However it may also be argued that the amount of cisplatin that has not entered the cancer cell may lead to more side effects.
DMEM v/v) probed for 2 over 18 h we find that the native Pt(II) complex is still present in the solution (Fig. S28†). It should be noted here that if other species are formed and they are still smaller in concentration then we will not be able to see them in the 195Pt NMR but the presence of the native complex peak at ca. −2159.8 ppm even after 18 h is encouraging. Another important observation made here is that when compared with the IC50 results it seems that although platinum accumulation is lower inside MCF-7 for cisplatin, yet the IC50 is similar in MCF-7 suggesting cisplatin is more effective in MCF-7 when the relative Pt(II) content inside the cell is compared. However it may also be argued that the amount of cisplatin that has not entered the cancer cell may lead to more side effects.
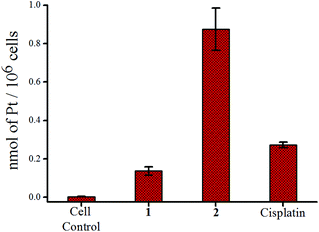 | ||
| Fig. 4 Accumulation of platinum in MCF-7 cells after treatment with 12 μM of 1, 2 and cisplatin respectively. | ||
Flow cytometry for cell cycle analysis
After verifying the toxicity profile, the most active complex 2 and cisplatin were probed for their effects on the cell cycle in MCF-7 and MIA PaCa2 by flow cytometry (PI assay). Three sub IC50 concentrations (6, 8 and 10 μM respectively) of 2 were treated on MCF-7 over 24 h whereas for MIA PaCa2 the treated concentrations of 2 were 2.5, 3.5 and 4.5 μM respectively. The percentage of cells in various phases of cell cycles of MCF-7 and MIA PaCa2 under the influence of increasing concentration of 2 is presented Fig. 5 (see Tables S4 and S6†). In MCF-7 and MIA PaCa2, G2/M phase arrest is prominent for complex 2. However, in MCF-7 in addition a sub G1 phase arrest was also observed with increase in concentration. The arrest of the sub G1 phase is also known to be an indication of the apoptotic pathway.71,72 Cell cycle arrest in MCF-7 by cisplatin was also checked which shows significant concentration dependent S phase arrest (2, 4 and 6 μM respectively) upon 24 h exposure (Table S5†). G2/M phase arrest by cisplatin also takes place as per the results but it seems that with increase in concentration the G2/M phase arrest is less and the S phase arrest is enhanced (Table S5†). In the case of MIA PaCa2 both S and G2/M phase arrests by cisplatin are prominent (Table S6†).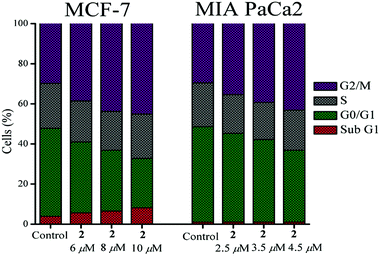 | ||
| Fig. 5 Cell cycle arrest by 2 showing sub G1 & G2/M phase arrest in MCF-7 and G2/M phase arrest in MIA PaCa. | ||
Complex 2 initiates the binding to DNA through the Pt(II) based on our hydrolysis and 9-EtG binding studies. However, the cell cycle arrest in the G2/M phase is a feature of the mustards and the prominence of the S-phase arrest along with some G2/M phases is a feature of cisplatin. Since complex 2 shows prominence in the G2/M phase arrest but not the S-phase hence the results indirectly suggest that the cisplatin type of cross-linking may not be the major sustaining pathway of cytotoxicity after initiation of binding by the Pt(II) as the DNA alkylation by the mustard sustains and leads to the cell cycle arrest in the G2/M phase.
DNA ladder assay for apoptosis detection
One of the well-known hallmarks of apoptosis is internucleosomal DNA fragmentation73 where genomic DNA is fragmented by the endonucleases with steps of around 180 bp.74–76 This phenomenon can be observed by agarose gel electrophoresis where DNA fragments form a ladder. The DNA extracted from MCF-7 cells after a treatment of 24 h with 2, using two sub IC50 and one IC50 concentrations (8, 10 and 12 μM respectively) showed DNA ladder formation whereas in DMSO control there was no such ladder like pattern (Fig. 6).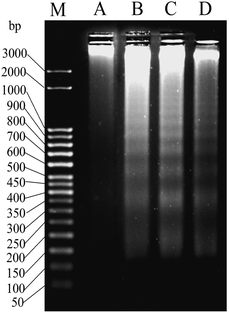 | ||
| Fig. 6 Gel image of DNA ladder formation using MCF-7 cells treated with (A) DMSO, (B) 8 μM of 2, (C) 10 μM of 2 and (C) 12 μM of 2 over 24 h. ‘M’ denotes the known bp ladder. | ||
JC-1 staining assay for detection of mitochondrial membrane potential change
In general it is thought that apoptosis may be induced through extrinsic or intrinsic pathways. Apoptosis through the intrinsic mechanism is regulated via mitochondria77,78 which may be monitored by the change in mitochondrial membrane potential (MMP, ΔΨm) using the fluorescent dye JC-179 by flow cytometry. The green fluorescence (λem = 550 nm) observed is due to the change in ΔΨm from its normal range stabilizing the monomeric form of the dye rather than the aggregated form which emits red fluorescence at ∼590 nm.80 The shift of fluorescence emission from red to green of JC-1 is recognized as loss of MMP.81 In Fig. 7 it is evident that complex 2 shows a steady decrease in red to green fluorescence intensity of JC-1 in a concentration dependent manner after 24 h of exposure, with respect to untreated MCF-7 cells. Hence the apoptotic pathway may be mostly intrinsic. This effect is less pronounced in cisplatin.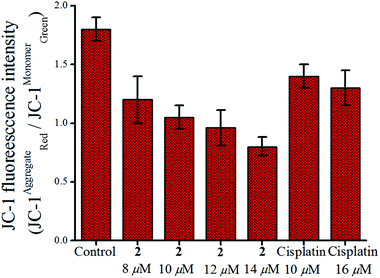 | ||
| Fig. 7 Change in MMP of MCF-7 cells after treatment with 2 and cisplatin respectively over 24 h showing the effect of increase in concentration. | ||
Colorimetric determination of caspase activity
The change in mitochondrial membrane potential leads to release of cytochrome c which activates initiator caspases (e.g. caspase-9) followed by activation of effector caspases (e.g. caspase-7). The activation of initiator caspases (e.g., caspase-9) followed by effector caspases (e.g., caspase-7) lead to cell death after proteolytic cleavage of a wide range of cellular targets.82,83 Our results show that 2 cleaves the Ac-DEVD-pNA substrate which is common to caspase-3 and -7 (exposure time 24 h, determined colourimetrically).84 MCF-7 does not have caspase-3 but it has caspase-7. The caspase-7 activity of 2 increases with concentration as depicted in Fig. 8.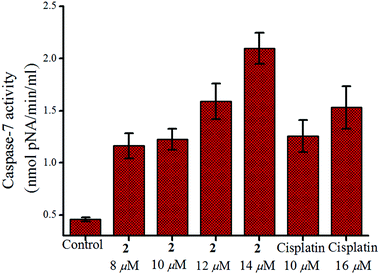 | ||
| Fig. 8 Caspase-7 activity in MCF-7 cells after treatment with 2 and cisplatin respectively over 24 h showing the enhancement in activity with increase in concentration. | ||
Optical microscopy imaging
Apoptosis is also characterized by cellular morphological changes which include cell shrinkage, plasma membrane blebbing and chromatin condensation.85 To check any changes in the nuclear morphology of MCF-7 cells after treatment of 2 for 24 h, DAPI staining was performed and the cells were observed by fluorescence microscopy. The morphology of the drug treated cells show condensed nuclei with some fragmented nuclei with respect to DMSO control (Fig. 9).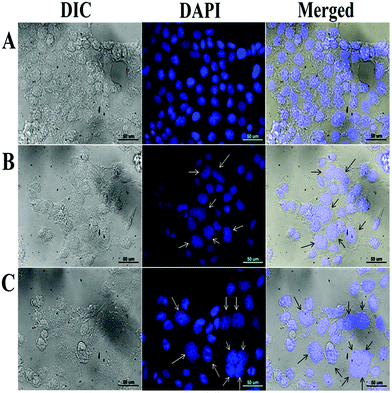 | ||
| Fig. 9 Microscopy image of MCF-7 cells after 24 h treatment with (A) DMSO, (B) 6 μM of 2 and (C) 8 μM of 2. Bright and dark arrows are pointing towards the nuclei with changed morphology. | ||
Chick embryo angiogenesis assay (CEA)
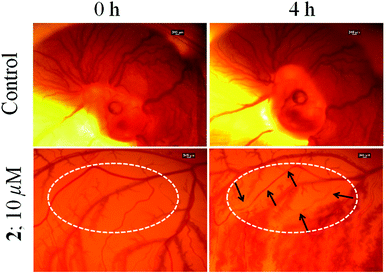
In vivo angiogenesis assays provide insight into the anti-angiogenic potential of an anticancer drug. The chick embryo angiogenesis (CEA) assay is a well-known in vivo angiogenesis assay,86,87 which was conducted to evaluate the anti-angiogenic property of 2. Fig. 10 shows that the control sets show no evidence of damage of blood vessels and rather new blood vessels are generated as normal development of chick embryo during the 4 h of study. While the blood vessels are significantly damaged in the embryo treated with 2 (indicated in Fig. 10 with arrows) and no new blood vessels could form during the course of treatment. The above results suggest that complex 2 has anti-angiogenic potential.Conclusions
The cytotoxicity and the binding studies show that there is a synergistic effect of having a nitrogen mustard coordinated to Pt(II). It is obvious that more tuning and understanding is to be gained, but it has to be appreciated that the properties unfolded in this work are very encouraging. In complex 2, Pt(II) has rendered enhanced stability to the nitrogen mustard moiety. The presence of the nitrogen mustard moiety allows more intracellular accumulation of complex 2 inside the MCF-7 cells as suggested by the ICP-MS data. Complexes 1 and 2 bind to the model substrate 9-EtG. The 9-EtG binding shows that depending on the ability of the ligand and steric factors various binding modes are possible and the guanine derivatives may bind in chelating mode under such circumstances. However, in spite of showing reactivity with GSH, even with 20 equivalent GSH with respect to the IC50 of complex 2, we could find that 2 is as effective as without GSH in normoxia, in contrast to cisplatin. This enhanced activity shows that apart from the DNA cross-linking ability, which acts in synergism to the otherwise cisplatin type complex 2, the steric factor of the nitrogen mustard group also imposes some degree of resistance towards the GSH binding. The activity of complex 2 in the presence of excess of GSH may be a good indication towards its effective nature in certain resistant forms of cancer, since they are known to generate more GSH. Complex 2 appears to be selectively more toxic to the pancreatic cancer cell line MIA PaCa2. Pancreatic cancer is a very aggressive form of cancer hence strong activity against such cancer is highly desired. Complex 2 arrests the cell cycle in the G2/M phase for the two probed cell lines, MIA PaCa2 and MCF-7, where it is most active. The mechanistic action of 2 as per the in vitro studies in MCF-7 shows that it is able to induce loss of mitochondrial membrane potential and activate caspase-7 followed by apoptosis and the activity is better than cisplatin. Complex 2 also demonstrates its anti-angiogenic potential as per the results of the CEA assay.Experimental section
Materials and methods
All the chemicals and solvents were purchased from commercial sources: 2-(chloromethyl)pyridine hydrochloride, diethanolamine, K2[PtCl4], 9-ethylguanine (9-EtG), and L-glutathione reduced (GSH) were purchased from Spectrochem, Sigma-Aldrich, Precious Metals Online & Carbosynth respectively and used as received. Solvents were of analytical grade and were distilled before use. All the solvents used for spectroscopy measurements were of spectroscopy grade (Spectrochem). 3-(4,5-Dimethyl-2-thiazolyl)-2,5-diphenyl-2H-tetrazolium bromide (MTT), 4′,6-diamidino-2-phenylindole dihydrochloride (DAPI) & penicillin–streptomycin were purchased from USB & Hyclone respectively and Dulbecco's Modified Eagle's Medium (DMEM), Phosphate-Buffered Saline (PBS) and 5,5′,6,6′-tetrachloro-1,1′,3,3′-tetraethylbenzimidazolylcarbocyanine iodide (JC-1) & propidium iodide (PI) were purchased from Invitrogen & Sigma-Aldrich respectively. UV–Visible measurements were performed using a Perkin Elmer lambda 35 spectrophotometer. FT-IR spectra were recorded using a Perkin-Elmer SPECTRUM RX I spectrometer in KBr pellets. 1H & proton decoupled 13C NMR spectra were measured using either a JEOL ECS 400 MHz or a Bruker Avance III 500 MHz spectrometer at room temperature and proton coupled 195Pt were recorded in a Bruker Avance III 500 MHz spectrometer at room temperature. The chemical shifts are reported in parts per million (ppm). All the 195Pt NMR chemical shifts are reported against the standard K2[PtCl4] chemical shift in D2O at −1628.0 ppm. Elemental analysis was performed in a Perkin-Elmer 2400 series II CHNS/O analyzer. Electrospray ionization mass spectra (ESI-MS) were recorded using a Micromass Q-Tof micro™ (Waters) by +ve mode electrospray ionization. The synthetic yields reported are of isolated analytically pure compounds. The compounds synthesized were dried in a vacuum and stored in desiccators.![[H with combining low line]](https://www.rsc.org/images/entities/char_0048_0332.gif) 2OH), 2.76 (t, 4H, J = 6.1 Hz, CH2N); 13C NMR (125 MHz, D2O) δ: 157.3 (PyC2), 148.1 (PyC6), 138.0 (PyC4), 124.6 (PyC5), 123.1 (PyC3), 59.5 (PyCH2N), 58.7 (CH2N), 55.5 (CH2OH); HRMS (ESI) in MeOH calcd (m/z) for [L1 + H+]+: 197.1290, found: 197.1206.
2OH), 2.76 (t, 4H, J = 6.1 Hz, CH2N); 13C NMR (125 MHz, D2O) δ: 157.3 (PyC2), 148.1 (PyC6), 138.0 (PyC4), 124.6 (PyC5), 123.1 (PyC3), 59.5 (PyCH2N), 58.7 (CH2N), 55.5 (CH2OH); HRMS (ESI) in MeOH calcd (m/z) for [L1 + H+]+: 197.1290, found: 197.1206.
![[H with combining low line]](https://www.rsc.org/images/entities/char_0048_0332.gif) 2OH), 4.00 (m, 2H, C
2OH), 4.00 (m, 2H, C![[H with combining low line]](https://www.rsc.org/images/entities/char_0048_0332.gif) 2OH), 3.31 (m, 2H, CH2N), 2.86 (m, 2H, CH2N); 13C NMR (125 MHz, DMSO-d6) δ: 163.2 (PyC2), 147.0 (PyC6), 139.3 (PyC4), 124.2 (PyC5), 122.1 (PyC3), 68.3 (PyCH2N), 64.7 (CH2N), 58.5 (CH2OH); 195Pt NMR (107.5 MHz, DMSO-d6) δ: −2077.5. Elemental analysis calcd (%) for C10H16Cl2N2O2Pt: C 25.98, H 3.49, N 6.06, found: C 26.05, H 3.50, N 6.08; FT-IR (KBr, cm−1): 3465 (br, s), 3393 (br, s); UV–vis in MeCN [λmax, nm (ε, M−1 cm−1)]: 239 (4650), 300 (3705).
2OH), 3.31 (m, 2H, CH2N), 2.86 (m, 2H, CH2N); 13C NMR (125 MHz, DMSO-d6) δ: 163.2 (PyC2), 147.0 (PyC6), 139.3 (PyC4), 124.2 (PyC5), 122.1 (PyC3), 68.3 (PyCH2N), 64.7 (CH2N), 58.5 (CH2OH); 195Pt NMR (107.5 MHz, DMSO-d6) δ: −2077.5. Elemental analysis calcd (%) for C10H16Cl2N2O2Pt: C 25.98, H 3.49, N 6.06, found: C 26.05, H 3.50, N 6.08; FT-IR (KBr, cm−1): 3465 (br, s), 3393 (br, s); UV–vis in MeCN [λmax, nm (ε, M−1 cm−1)]: 239 (4650), 300 (3705).
X-ray crystallography
X-ray diffraction measurements of a suitable single crystal were performed through an Agilant SuperNova, Dual, Cu at zero, Eos diffractometer at 100(1) K using Mo X-ray source of wavelength 0.7107 Å. The structure was processed with the ShelXS89 structure solution program using the direct method and the refinement was done with the ShelXL89 refinement package using least squares minimisation and all the processing was done through Olex2.90 All the non-hydrogen atoms were refined anisotropically by full matrix least-squares on F2. A few important crystallographic refine parameters and crystal data are summarized in Table S1† and Table 2 respectively. The ORTEP diagrams were processed through the POV-ray with 50% probability level. Crystallographic data for the structure have been deposited at the Cambridge Crystallographic Data Centre as supplementary publication, https://deposit.ccdc.cam.ac.uk and the CCDC number is 1405234.NMR experiments
The sample for NMR experiments was prepared in 20% PBS (pD 7.4, prepared in D2O) in DMSO-d6/DMF-d7 or 20% H2O in DMSO-d6 and the data were recorded in a JEOL ECS 400 MHz spectrophotometer in the dark. pD was adjusted to 7.4 either using DCl or NaOD. The uncorrected pD values are reported.91 The ESI-MS (HRMS) samples were prepared after taking the solutions from NMR tubes and diluted in HPLC grade methanol. Binding kinetics monitored by 195Pt NMR were performed using a Bruker Avance III 500 MHz spectrometer.Cell lines and culture
Breast adenocarcinoma (MCF-7), lung adenocarcinoma (A549), and human cervical carcinoma (HeLa WT) were obtained from the Department of Biological Sciences, IISER Kolkata (purchased from ATCC), human pancreatic carcinoma (MIA PaCa2) was obtained from NCCS (Pune, India) and human embryonic kidney cell line (HEK293) was kindly donated by Prof. S. M. Srinivasula of IISER TVM, India. Cell lines were maintained in the logarithmic phase at 37 °C under a 5% carbon dioxide atmosphere using the cell culture media containing DMEM supplemented with 10% FBS (GIBCO), antibiotics (100 units per mL penicillin and 100 μg per mL streptomycin).Cell viability assay
The growth inhibitory effect towards tumour cell lines was evaluated with the help of the MTT assay. In brief, 6 × 10³ cells per well were seeded in 96-well microplates in DMEM (200 μL) and incubated at 37 °C under a 5% carbon dioxide atmosphere. After 48 h, DMEM was renewed with a fresh one (200 μL). Stock solutions of metal complexes were made immediately prior to drug dilution. The stock solution for each complex was made in ca. 1![[thin space (1/6-em)]](https://www.rsc.org/images/entities/char_2009.gif) :
:![[thin space (1/6-em)]](https://www.rsc.org/images/entities/char_2009.gif) 7 DMSO
7 DMSO![[thin space (1/6-em)]](https://www.rsc.org/images/entities/char_2009.gif) :
:![[thin space (1/6-em)]](https://www.rsc.org/images/entities/char_2009.gif) culture media (v/v). The cisplatin stock was made with 0.6% DMSO in 1× PBS pH 7.2. Various concentrations of solution were prepared from the stock solution diluted with the same culture media within 5 min and added in triplicate at the appropriate concentrations. The final DMSO concentration in the well did not exceed 0.5% for the complexes and 0.02% for cisplatin. The same amount of DMSO percentages was maintained in the case of all cell based studies mentioned below. Upon completion of 48 h incubation with the compounds, fresh media (200 μL) were added to each well after removing the drug containing media followed by treatment with 20 μL of a 1 mg mL−1 MTT in 1× PBS (pH 7.2). After 3 h of incubation at 37 °C, media were removed and the resulting formazan crystals were dissolved in DMSO (200 μL). The growth inhibitions of cells were analyzed by measuring the absorbance of the drug treated wells with respect to untreated ones at 515 nm92,93 using a BIOTEK ELx800 plate reader. IC50 values (drug concentrations that are responsible for 50% cell growth inhibition) were calculated by fitting nonlinear curves in GraphPad Prism 5, using a variable slope model constructed by plotting cell viability (%) versus log of drug concentration in μM. Each independent experiment was carried out in triplicate.
culture media (v/v). The cisplatin stock was made with 0.6% DMSO in 1× PBS pH 7.2. Various concentrations of solution were prepared from the stock solution diluted with the same culture media within 5 min and added in triplicate at the appropriate concentrations. The final DMSO concentration in the well did not exceed 0.5% for the complexes and 0.02% for cisplatin. The same amount of DMSO percentages was maintained in the case of all cell based studies mentioned below. Upon completion of 48 h incubation with the compounds, fresh media (200 μL) were added to each well after removing the drug containing media followed by treatment with 20 μL of a 1 mg mL−1 MTT in 1× PBS (pH 7.2). After 3 h of incubation at 37 °C, media were removed and the resulting formazan crystals were dissolved in DMSO (200 μL). The growth inhibitions of cells were analyzed by measuring the absorbance of the drug treated wells with respect to untreated ones at 515 nm92,93 using a BIOTEK ELx800 plate reader. IC50 values (drug concentrations that are responsible for 50% cell growth inhibition) were calculated by fitting nonlinear curves in GraphPad Prism 5, using a variable slope model constructed by plotting cell viability (%) versus log of drug concentration in μM. Each independent experiment was carried out in triplicate.
For determining IC50 in hypoxic conditions the drugs were loaded in a 96-well plate under a normal atmosphere within 10 minutes of solution preparation and the oxygen percentage of the CO2 incubator was maintained at 1.5%. The incubator was equilibrated to the hypoxic condition (1.5% O2) within 30 minutes of drug loading.
Metal accumulation inside MCF-7 cells using ICP-MS
1.2 × 10⁶ MCF-7 cells per 90 mm petri dish were incubated for 48 h and treated with an equal concentration (12 μM) of complex solutions (1, 2 and cisplatin) for additional 24 h. Media were discarded and cells were washed using 1× PBS. After trypsinization cells were counted accurately for each drug and converted to cell pellets by centrifugation. Cell pellets were digested with 200 μL of extra pure (70% v/v) redistilled nitric acid (Sigma-Aldrich) at 70 °C for 12 h. After cooling the sample solutions were diluted with Milli-Q water. The platinum content in the samples was analyzed on a Thermo Scientific XSERIES 2 ICP-MS instrument. Platinum standard solutions were freshly prepared before the experiment.Flow cytometry for cell cycle analysis
Cells were seeded at 1.2 × 10⁶ cells per plate in a 90 mm dia petri dish containing 12 mL DMEM and incubated at 37 °C under a 5% carbon dioxide atmosphere. After 48 h, media were removed and fresh media were added along with adequate concentration of complex solutions and incubated at previously mentioned culturing conditions. Drug containing media was removed and cells were harvested by trypsinization after 24 h of drug exposure. The cells were washed twice with cold 1× PBS (pH 7.2) and were fixed by maintaining a 70% aqueous ethanolic cell solution at 4 °C for 12 h. DNA staining was performed by resuspending the cell pellets in 1× PBS solution comprising PI (55 μg mL−1) and RNase A (100 μg mL−1) solutions. The cell suspension was gently mixed and incubated at 37 °C for half an hour in the dark. Samples were analyzed in a BD Biosciences FACSCalibur flow cytometer.DNA ladder assay for apoptosis detection
DNA ladder assay was performed by a modified literature procedure.94 1.2 × 10⁶ MCF-7 cells per plate were seeded in a 90 mm dia tissue culture petri dish. After growing for 48 h, media were changed and complex solutions were added. After 24 h media were removed and collected in a tube. Cells were washed with 1× PBS (pH 7.2). The washing was also collected in the same tube and mixed with the harvested cells after trypsinization. The cells were washed twice with 1× PBS (pH 7.2). Cells were then centrifuged at 2500 rpm for 10 minutes at 25 °C. 500 μL of lysis buffer (20 mM Tris-HCl, 0.4 mM EDTA, 0.25% Triton-X 100, pH 8.0) was added and incubated at room temperature for 15 minutes. The lysed cells were centrifuged at 14![[thin space (1/6-em)]](https://www.rsc.org/images/entities/char_2009.gif) 000 rpm for 10 minutes at 4 °C and the supernatant was mixed well with 500 μL of a 1
000 rpm for 10 minutes at 4 °C and the supernatant was mixed well with 500 μL of a 1![[thin space (1/6-em)]](https://www.rsc.org/images/entities/char_2009.gif) :
:![[thin space (1/6-em)]](https://www.rsc.org/images/entities/char_2009.gif) 1 (v/v) mixture of phenol and chloroform. Again after centrifugation at 14
1 (v/v) mixture of phenol and chloroform. Again after centrifugation at 14![[thin space (1/6-em)]](https://www.rsc.org/images/entities/char_2009.gif) 000 rpm for 10 minutes at 4 °C, the aqueous layer was pipetted out carefully and mixed with 55 μL of 5 M NaCl solution and 550 μL of isopropanol. The mixture was kept at −20 °C overnight. The resultant solution was then centrifuged at 14
000 rpm for 10 minutes at 4 °C, the aqueous layer was pipetted out carefully and mixed with 55 μL of 5 M NaCl solution and 550 μL of isopropanol. The mixture was kept at −20 °C overnight. The resultant solution was then centrifuged at 14![[thin space (1/6-em)]](https://www.rsc.org/images/entities/char_2009.gif) 000 rpm for 10 minutes at 4 °C and the resulting pellet was washed with 70% ice-cold ethanol and finally air dried. The dried pellet was dissolved in 40 μL of 1× TE buffer (10 mM Tris-HCl, 1 mM EDTA, pH 8.0) and then 8 μL of RNase solution (150 μg mL−1) was added. After centrifugation at 5000 rpm for 10 minutes, the supernatant was loaded in 1.6% agarose gel containing ethidium bromide (1 μg mL−1) and run for 3 h at 60 V in 1× TBE buffer.
000 rpm for 10 minutes at 4 °C and the resulting pellet was washed with 70% ice-cold ethanol and finally air dried. The dried pellet was dissolved in 40 μL of 1× TE buffer (10 mM Tris-HCl, 1 mM EDTA, pH 8.0) and then 8 μL of RNase solution (150 μg mL−1) was added. After centrifugation at 5000 rpm for 10 minutes, the supernatant was loaded in 1.6% agarose gel containing ethidium bromide (1 μg mL−1) and run for 3 h at 60 V in 1× TBE buffer.
JC-1 staining assay for detection of mitochondrial membrane potential change
The same procedure was followed as the DNA ladder assay to harvest the cells after 24 h drug exposure. The cells were collected by centrifugation at 2500 rpm at 25 °C. After washing the cells with 1× PBS (pH 7.2), the cells were mixed with 500 μL of JC-1 (10 μg mL−1 in 10% FBS supplemented 1× PBS). After 30 min incubation at 37 °C, stained cells were collected by centrifugation and resuspended in 1× PBS for analysis in a BD Biosciences FACSVerse flow cytometer measuring green and red fluorescence intensities.Colorimetric determination of caspase activity
Caspase activity was determined by colorimetry using a Caspase Assay kit (Sigma-Aldrich). The free p-nitroaniline (pNA) was quantified after its cleavage from the Ac-DEVD-pNA substrate by caspase-7 from MCF-7 cells. It is worth noting that the substrate Ac-DEVD-pNA is cleaved by caspase-7 or caspase-3. Since MCF-7 is known to be devoid of caspase-3 hence activation of caspase-7 cleaves Ac-DEVD-pNA. 1.2 × 10⁶ MCF-7 cells per 90 mm petri-dish were incubated for 48 h and treated with the complex solutions for an additional 24 h. The cells were collected and treated as per the kit manufacturer's protocol. Released pNA absorbance was detected at 405 nm using an ELISA plate reader following 24 h incubation after the addition of cell lysate. The data are graphically represented here as the concentration of pNA released (nmol min−1 ml−1) on the y-axis and concentrations of treated drugs on the x-axis. Each drug concentration has been performed in triplicate.Optical microscopy imaging
MCF-7 cells were seeded at 12 × 103 per well in a 6-well plate and were grown with 3 mL of DMEM. After 48 h the existing media were replaced with fresh one and incubated with the required concentrations of a metal complex for 24 h. After removal of drug containing media, cells were fixed with a 4% para formaldehyde solution in 1× PBS (pH 7.2). Now the cells were washed several times after 2 minutes of incubation with DAPI (1 μg mL−1). The optical microscopy images of MCF-7 cells were acquired using an OLYMPUS IX 81 epifluorescence inverted microscope at 60× magnification. Both DIC and fluorescence microscopy images were obtained and processed using OLYMPUS Cell P software. Merged images were produced for better understanding.Chick embryo angiogenesis assay (CEA)
The anti-angiogenic activity of 2 was investigated by the chick embryo angiogenesis (CEA) assay using a reported protocol.95 Specific pathogen free (SPF) fertile chicken eggs were obtained from a government poultry firm. The eggs were incubated at 37 °C under a humid atmosphere. After the fourth day of incubation, the shells of the eggs were cautiously broken using forceps and placed on a sterile petri-dish. Precautions were taken to prevent puncture of any of the blood vessels while transferring. A stock solution of 2 was prepared in 10% DMSO–PBS (v/v) solution and further diluted with PBS to achieve complex concentration of 10 μM (final DMSO concentration 0.2%). Sterile filter paper discs (6 mm dia) soaked in solution of 2 were placed in 3 different positions (10 μM; 10 μL) over the generating blood vessels. For the control experiments sterile filter paper disks (6 mm dia) soaked with 10 μL of 0.2% DMSO in PBS were used. Initial images of blood vessels (i.e. 0 h) were taken using a camera attached stereomicroscope (Leica). The petri-dishes were aseptically transferred in a humidified incubator at 37 °C and images were captured similarly after 4 h of incubation.Statistical analysis
All the IC50 data given are means of three independent experiments carried out in each cell line where, in each experiment each concentration was assayed in triplicate. The statistical analyses were conducted using GraphPad Prism 5 with student's t-test.Acknowledgements
We sincerely acknowledge the Department of Science and Technology for financial support vide project no. SB/S1/IC-02/2014. We are also thankful to IISER Kolkata for financial and infrastructural support including NMR, single crystal XRD, ESI-MS, ICP-MS, FACS and fluorescence microscopy. SK & KP thank UGC-India and SC thanks IISER Kolkata for providing fellowships.Notes and references
- L. S. Goodman, M. M. Wintrobe, W. Dameshek, M. J. Goodman, A. Gilman and M. T. McLennan, JAMA, J. Am. Med. Assoc., 1946, 132, 126–132 CrossRef CAS.
- A. Gilman, Am. J. Surg., 1963, 105, 574–578 CrossRef CAS PubMed.
- B. A. Chabner and T. G. Roberts, Nat. Rev. Cancer, 2005, 5, 65–72 CrossRef CAS PubMed.
- S. R. Rajski and R. M. Williams, Chem. Rev., 1998, 98, 2723–2795 CrossRef CAS PubMed.
- D. M. Noll, A. M. Noronha, C. J. Wilds and P. S. Miller, Front. Biosci., 2004, 9, 421–437 CrossRef CAS.
- A. M. J. Fichtinger-Schepman, J. L. Van der Veer, J. H. J. Den Hartog, P. H. M. Lohman and J. Reedijk, Biochemistry, 1985, 24, 707–713 CrossRef CAS PubMed.
- M. Kartalou and J. M. Essigmann, Mutat. Res., Fundam. Mol. Mech. Mutagen., 2001, 478, 1–21 CrossRef CAS PubMed.
- Y. Jung and S. J. Lippard, Chem. Rev., 2007, 107, 1387–1407 CrossRef CAS PubMed.
- J. Reedijk, Chem. Rev., 1999, 99, 2499–2510 CrossRef CAS PubMed.
- D. Wang and S. J. Lippard, Nat. Rev. Drug Discovery, 2005, 4, 307–320 CrossRef CAS PubMed.
- L. Kelland, Nat. Rev. Cancer, 2007, 7, 573–584 CrossRef CAS PubMed.
- N. J. Wheate, S. Walker, G. E. Craig and R. Oun, Dalton Trans., 2010, 39, 8113–8127 RSC.
- R. A. Alderden, M. D. Hall and T. W. Hambley, J. Chem. Educ., 2006, 83, 728–734 CrossRef CAS.
- L. Galluzzi, L. Senovilla, I. Vitale, J. Michels, I. Martins, O. Kepp, M. Castedo and G. Kroemer, Oncogene, 2012, 31, 1869–1883 CrossRef CAS PubMed.
- B. Larrivee and D. A. Averill, Biochem. Pharmacol., 1999, 58, 291–302 CrossRef CAS PubMed.
- M. Sawicka, M. Kalinowska, J. Skierski and W. Lewandowski, J. Pharm. Pharmacol., 2004, 56, 1067–1081 CrossRef CAS PubMed.
- M. Grandi, C. Geroni and F. C. Giuliani, Br. J. Cancer, 1986, 54, 515–518 CrossRef CAS PubMed.
- S. Schiesser, B. Hackner, M. Vrabel, W. Beck and T. Carell, Eur. J. Org. Chem., 2015, 2654–2660 CrossRef CAS.
- Z. Fei, H. Thonnessen, P. G. Jones, L. Crowe, R. K. Harris and R. Schmutzler, Z. Anorg. Allg. Chem., 2000, 626, 1763–1772 CrossRef CAS.
- R. T. Wheelhouse and L. H. Hurley, WO Pat., 1998-US2058 9833503, 1998 Search PubMed.
- A. Okruszek and J. G. Verkade, Phosphorus, Sulfur Relat. Elem., 1979, 7, 235–240 CrossRef CAS.
- H.-J. Plinta, I. Neda, A. Fischer, P. G. Jones and R. Schmutzler, Chem. Ber., 1995, 128, 695–701 CrossRef CAS.
- R. Sonnenburg, I. Neda, A. Fischer, P. G. Jones and R. Schmutler, Chem. Ber., 1995, 128, 628–634 CrossRef CAS.
- A. Fischer, I. Neda, P. G. Jones and R. Schmutzler, Z. Naturforsch., B: Chem. Sci., 1994, 49, 1481–1493 CAS.
- R. Sonnenburg, I. Neda, A. Fischer, P. G. Jones and R. Schmutzler, Z. Naturforsch., B: Chem. Sci., 1994, 49, 788–800 CrossRef CAS.
- Y. Kitani, M. Nomichi, J. Onishi and K. Okamoto, JP Pat., 1991-25693 04330090, 1992 Search PubMed.
- S. V. Yakovlev, O. M. Nozdrina and V. B. Ukraintsev, Zh. Obshch. Khim., 1992, 62, 967–971 CAS.
- S. V. Yakovlev, V. B. Ukraintsev, O. M. Nozdrina and Y. N. Kukushkin, Zh. Obshch. Khim., 1990, 60, 1321–1325 CAS.
- P. C. Merker, I. Wodinsky, J. Mabel, A. Branfman and J. M. Venditti, J. Clin. Hematol. Oncol., 1977, 7, 301–321 CAS.
- M. D. Joesten, E. L. Krasney and J. B. Neidert, Inorg. Chim. Acta, 1989, 159, 143–148 CrossRef CAS.
- S. A. Abello, Fabrica de Productos Quimicos y Farmaceuticos, Spain, BE Pat., 1984-212161 898614, 1984 Search PubMed.
- A. E. Wroblewski, S. M. Socol, A. Okruszek and J. G. Verkade, Inorg. Chem., 1980, 19, 3713–3719 CrossRef CAS.
- A. E. Wroblewski and J. G. Verkade, J. Am. Chem. Soc., 1979, 101, 7719 CrossRef CAS.
- S. M. Hillier, J. C. Marquis, B. Zayas, J. S. Wishnok, R. G. Liberman, P. L. Skipper, S. R. Tannenbaum, J. M. Essigmann and R. G. Croy, Mol. Cancer Ther., 2006, 5, 977–984 CrossRef CAS PubMed.
- S. M. Rink, K. J. Yarema, M. S. Solomon, L. A. Paige, B. M. Tadayoni-Rebek, J. M. Essigmann and R. G. Croy, Proc. Natl. Acad. Sci. U. S. A., 1996, 93, 15063–15068 CrossRef CAS.
- M. Tercel, W. R. Wilson and W. A. Denny, J. Med. Chem., 1993, 36, 2578–2579 CrossRef CAS PubMed.
- M. Tercel, W. R. Wilson, R. F. Anderson and W. A. Denny, J. Med. Chem., 1996, 39, 1084–1094 CrossRef CAS PubMed.
- Y. Kuang, K. Balakrishnan, V. Gandhi and X. Peng, J. Am. Chem. Soc., 2011, 133, 19278–19281 CrossRef CAS PubMed.
- W. Chen, Y. Han and X. Peng, Chem. – Eur. J., 2014, 20, 7410–7418 CrossRef CAS PubMed.
- B. D. Palmer, W. R. Wilson, S. Cliffe and W. A. Denny, J. Med. Chem., 1992, 35, 3214–3222 CrossRef CAS PubMed.
- B. D. Palmer, W. R. Wilson, G. J. Atwell, D. Schultz, X. Z. Xu and W. A. Denny, J. Med. Chem., 1994, 37, 2175–2184 CrossRef CAS PubMed.
- B. D. Palmer, W. R. Wilson, R. F. Anderson, M. Boyd and W. A. Denny, J. Med. Chem., 1996, 39, 2518–2528 CrossRef CAS PubMed.
- D. C. Ware, B. D. Palmer, W. R. Wilson and W. A. Denny, J. Med. Chem., 1993, 36, 1839–1846 CrossRef CAS PubMed.
- D. C. Ware, W. R. Wilson, W. A. Denny and C. E. F. Richard, J. Chem. Soc., Chem. Commun., 1991, 1171–1173, 10.1039/c39910001171.
- B. A. Teicher, M. J. Abrams, K. W. Rosbe and T. S. Herman, Cancer Res., 1990, 50, 6971–6975 CAS.
- D. C. Ware, B. G. Siim, K. G. Robinson, W. A. Denny, P. J. Brothers and G. R. Clark, Inorg. Chem., 1991, 30, 3750–3757 CrossRef CAS.
- D. C. Ware, W. A. Denny and G. R. Clark, Acta Crystallogr., Sect. C: Cryst. Struct. Commun., 1997, 53, 1058–1059 Search PubMed.
- D. C. Ware, H. R. Palmer, F. B. Bruijn, R. F. Anderson, P. J. Brothers, W. A. Denny and W. R. Wilson, Anti-Cancer Drug Des., 1998, 13, 81–103 CAS.
- D. C. Ware, P. J. Brothers, G. R. Clark, W. A. Denny, B. D. Palmer and W. R. Wilson, Dalton Trans., 2000, 925–932 RSC.
- P. R. Craig, P. J. Brothers, G. R. Clark, W. R. Wilson, W. A. Denny and D. C. Ware, Dalton Trans., 2004, 611–618, 10.1039/b311091e.
- C.-C. Wu, S. Datta, W. Wernsdorfer, G.-H. Lee, S. Hill and E.-C. Yang, Dalton Trans., 2010, 39, 10160–10168 RSC.
- J. Reedijk, Chem. Commun., 1996, 801–806, 10.1039/cc9960000801.
- M. S. Robillard, M. Galanski, W. Zimmermann, B. K. Keppler and J. Reedijk, J. Inorg. Biochem., 2002, 88, 254–259 CrossRef CAS PubMed.
- M. Galanski, W. Zimmermann, C. Baumgartner and B. K. Keppler, Eur. J. Inorg. Chem., 2001, 1145–1149, DOI:10.1002/1099-0682(200105)2001:5<1145::aid-ejic1145>3.0.co;2-e.
- A. Zenker, M. Galanski, T. L. Bereuter, B. K. Keppler and W. Lindner, JBIC, J. Biol. Inorg. Chem., 2000, 5, 498–504 CrossRef CAS PubMed.
- B. D. Sarma, S. K. Daley and R. K. Elespuru, Chem.-Biol. Interact., 1983, 46, 219–232 CrossRef CAS PubMed.
- A. P. Neves, M. X. G. Pereira, E. J. Peterson, R. Kipping, M. D. Vargas, F. P. Silva Jr., J. W. M. Carneiro and N. P. Farrell, J. Inorg. Biochem., 2013, 119, 54–64 CrossRef CAS PubMed.
- J. Lorberth, M. El-Essawi, W. Massa and L. Labib, Angew. Chem., Int. Ed. Engl., 1988, 100, 1194–1195 CAS.
- U. Warnke, C. Rappel, H. Meier, C. Kloft, M. Galanski, C. G. Hartinger, B. K. Keppler and U. Jaehde, ChemBioChem, 2004, 5, 1543–1549 CrossRef CAS PubMed.
- X. Wang and Z. Guo, Anti-Cancer Agents Med. Chem., 2007, 7, 19–34 CrossRef.
- S. J. Berners-Price and P. W. Kuchel, J. Inorg. Biochem., 1990, 38, 305–326 CrossRef CAS.
- S. Wu, X. Wang, Y. He, Z. Zhu, C. Zhu and Z. Guo, J. Inorg. Biochem., 2014, 139, 77–84 CrossRef CAS PubMed.
- V. Ramu, M. R. Gill, P. J. Jarman, D. Turton, J. A. Thomas, A. Das and C. Smythe, Chem. – Eur. J., 2015, 21, 9185–9197 CrossRef CAS PubMed.
- B. Odenheimer and W. Wolf, Inorg. Chim. Acta, 1982, 66, L41–L43 CrossRef CAS.
- N. Barnes, M. Y. Bartee, L. Braiterman, A. Gupta, V. Ustiyan, V. Zuzel, J. H. Kaplan, A. L. Hubbard and S. Lutsenko, Traffic, 2009, 10, 767–779 CrossRef CAS PubMed.
- M. Komatsu, T. Sumizawa, M. Mutoh, Z.-S. Chen, K. Terada, T. Furukawa, X.-L. Yang, H. Gao, N. Miura, T. Sugiyama and S.-I. Akiyama, Cancer Res., 2000, 60, 1312–1316 CAS.
- G. Samimi, R. Safaei, K. Katano, A. K. Holzer, M. Rochdi, M. Tomioka, M. Goodman and S. B. Howell, Clin. Cancer Res., 2004, 10, 4661–4669 CrossRef CAS PubMed.
- N. V. Dolgova, D. Olson, S. Lutsenko and O. Y. Dmitriev, Biochem. J., 2009, 419, 51–56 CrossRef CAS PubMed.
- O. Y. Dmitriev, Biochem. Cell Biol., 2011, 89, 138–147 CrossRef CAS PubMed.
- V. Calandrini, F. Arnesano, A. Galliani, T. H. Nguyen, E. Ippoliti, P. Carloni and G. Natile, Dalton Trans., 2014, 43, 12085–12094 RSC.
- X. Huang, H. D. Halicka, F. Traganos, T. Tanaka, A. Kurose and Z. Darzynkiewicz, Cell Prolif., 2005, 38, 223–243 CrossRef PubMed.
- M. Kajstura, H. D. Halicka, J. Pryjma and Z. Darzynkiewicz, Cytometry, Part A, 2007, 71A, 125–131 CrossRef CAS PubMed.
- A. H. Wyllie, J. F. Kerr and A. R. Currie, Int. Rev. Cytol., 1980, 68, 251–306 CAS.
- A. H. Wyllie, Nature, 1980, 284, 555–556 CrossRef CAS PubMed.
- M. Enari, H. Sakahira, H. Yokoyama, K. Okawa, A. Iwamatsu and S. Nagata, Nature, 1998, 391, 43–50 CrossRef CAS PubMed.
- P. T. Daniel, I. Sturm, S. Ritschel, K. Friedrich, B. Dorken, P. Bendzko and T. Hillebrand, Anal. Biochem., 1999, 266, 110–115 CrossRef CAS PubMed.
- S. Nagata, Cell, 1997, 88, 355–365 CrossRef CAS PubMed.
- D. R. Green and J. C. Reed, Science, 1998, 281, 1309–1312 CrossRef CAS PubMed.
- D. R. Green and G. Kroemer, Science, 2004, 305, 626–629 CrossRef CAS PubMed.
- S. T. Smiley, M. Reers, C. Mottola-Hartshorn, M. Lin, A. Chen, T. W. Smith, G. D. Steele Jr. and L. B. Chen, Proc. Natl. Acad. Sci. U. S. A., 1991, 88, 3671–3675 CrossRef CAS.
- G. Kroemer and J. C. Reed, Nat. Med., 2000, 6, 513–519 CrossRef CAS PubMed.
- E. A. Slee, M. T. Harte, R. M. Kluck, B. B. Wolf, C. A. Casiano, D. D. Newmeyer, H.-G. Wang, J. C. Reed, D. W. Nicholson, E. S. Alnemri, D. R. Green and S. J. Martin, J. Cell Biol., 1999, 144, 281–292 CrossRef CAS PubMed.
- M. O. Hengartner, Nature, 2000, 407, 770–776 CrossRef CAS PubMed.
- N. A. Thornberry, T. A. Rano, E. P. Peterson, D. M. Rasper, T. Timkey, M. Garcia-Calvo, V. M. Houtzager, P. A. Nordstrom, S. Roy, J. P. Vaillancourt, K. T. Chapman and D. W. Nicholson, J. Biol. Chem., 1997, 272, 17907–17911 CrossRef CAS PubMed.
- J. F. Kerr, A. H. Wyllie and A. R. Currie, Br. J. Cancer, 1972, 26, 239–257 CrossRef CAS PubMed.
- P. Nowak-Sliwinska, C. M. Clavel, E. Paunescu, M. T. te Winkel, A. W. Griffioen and P. J. Dyson, Mol. Pharm., 2015, 12, 3089–3096 CrossRef CAS PubMed.
- A. K. Barui, V. Veeriah, S. Mukherjee, J. Manna, A. K. Patel, S. Patra, K. Pal, S. Murali, R. K. Rana, S. Chatterjee and C. R. Patra, Nanoscale, 2012, 4, 7861–7869 RSC.
- V. Y. Kukushkin, A. J. L. Pombeiro, C. M. P. Ferreira, L. I. Elding and R. J. Puddephatt, Inorg. Synth., 2002, 33, 189–196 CAS.
- G. M. Sheldrick, Acta Crystallogr., Sect. A: Fundam. Crystallogr., 2008, 64, 112–122 CrossRef CAS PubMed.
- O. V. Dolomanov, L. J. Bourhis, R. J. Gildea, J. A. K. Howard and H. Puschmann, J. Appl. Crystallogr., 2009, 42, 339–341 CrossRef CAS.
- A. K. Covington, M. Paabo, R. A. Robinson and R. G. Bates, Anal. Chem., 1968, 40, 700–706 CrossRef CAS.
- M. C. Alley, D. A. Scudiero, A. Monks, M. L. Hursey, M. J. Czerwinski, D. L. Fine, B. J. Abbott, J. G. Mayo, R. H. Shoemaker and M. R. Boyd, Cancer Res., 1988, 48, 589–601 CAS.
- B. L. Lokeshwar, E. Escatel and B. Zhu, Curr. Med. Chem., 2001, 8, 271–279 CrossRef CAS PubMed.
- K. Sengupta Tapas, M. Leclerc Gilles, T. Hsieh-Kinser Ting, J. Leclerc Guy, I. Singh and C. Barredo Julio, Mol. Cancer, 2007, 6, 46 CrossRef CAS PubMed.
- P. Nagababu, A. K. Barui, B. Thulasiram, C. S. Devi, S. Satyanarayana, C. R. Patra and B. Sreedhar, J. Med. Chem., 2015, 58, 5226–5241 CrossRef CAS PubMed.
Footnote |
| † Electronic supplementary information (ESI) available: Additional crystallographic data, NMR data of synthesized compounds, NMR and ESI-MS data of stability and binding kinetics, tables containing ESI-MS speciation, plots of MTT assay, cell cycle arrest histograms. CCDC 1405234. For ESI and crystallographic data in CIF or other electronic format see DOI: 10.1039/c5dt04459f |
| This journal is © The Royal Society of Chemistry 2016 |

