
 Open Access Article
 This Open Access Article is licensed under a
 Creative Commons Attribution 3.0 Unported Licence
Crystal structure evolution and luminescence properties of color tunable solid solution phosphors Ca2+xLa8−x(SiO4)6−x(PO4)xO2:Eu2+
Yufei
Xia
a,
Jian
Chen
a,
Yan-gai
Liu
*a,
Maxim S.
Molokeev
 bc,
Ming
Guan
a,
Zhaohui
Huang
a and
Minghao
Fang
a
bc,
Ming
Guan
a,
Zhaohui
Huang
a and
Minghao
Fang
a
aSchool of Materials Science and Technology, Beijing Key Laboratory of Materials Utilization of Nonmetallic Minerals and Solid Wastes, National Laboratory of Mineral Materials, China University of Geosciences, Beijing, 100083, China. E-mail: liuyang@cugb.edu.cn
bLaboratory of Crystal Physics, Kirensky Institute of Physics, SB RAS, Krasnoyarsk 660036, Russia
cDepartment of Physics, Far Eastern State Transport University, Khabarovsk 680021, Russia
First published on 23rd November 2015
Abstract
A series of apatite solid solution phosphors Ca2+xLa8−x(SiO4)6−x(PO4)xO2:Eu2+ (x = 0,2,4,6) were synthesized by a conventional high-temperature solid-state reaction. The phase purity was examined using XRD, XPS and XRF. The crystal structure information, such as the concentration, cell parameters and occupation rate, was analyzed using a Rietveld refinement, demonstrating that the Eu2+ activated the Ca2La8(SiO4)6O2 and Ca8La2(PO4)6O2 to form continuous solid solution phosphors. Different behaviors of luminescence evolution in response to structural variation were verified among the series of phosphors. Two kinds of Eu2+ ion sites were proved using low temperature PL spectra (8k) and room temperature decay curves. The substitution of large La3+ ions by small Ca2+ ions induced a decreased crystal field splitting of the Eu2+ ions, which caused an increase in emission energy from the 5d excited state to the 4f ground state and a resultant blue-shift from 508 nm to 460 nm. Therefore, with the crystal structure evolution, the emitted color of the series of phosphors could be tuned from green to blue by adjusting the ratio of Ca/La.
1. Introduction
Compared to conventional incandescent or fluorescent lamps, LED-based lighting devices fabricated by coating the yellow-emitting phosphor YAG: Ce3+ on blue InGaN LED chips have incited a revolution in the lamp industry due to their many advantages, such as significant power reduction, longer lifetime, higher luminous efficiency, environmental friendliness and brightness.1–3 However, this combination exhibits a poor color rendering index (CRI ≈ 70–80) and a high correlated color temperature (CCT ≈ 7750 K) attributed to the insufficient red emission.4,5 One solution is to assemble LEDs by pumping a near-ultraviolet (n-UV) emitting chip with a mixture of blue, green and red emitting phosphors, which can then emit high quality white light with a smoother spectral distribution over the whole visible range.6,7The crystal field strength and coordination environment have great influences on the outermost electron transition of the Eu2+ ion, the most frequently used activator in phosphors, because the active electronic level is not shielded against the surrounding ligands,8–10 indicating that Eu2+ ions can emit light from the ultraviolet to the infrared with broadband emitting fluorescence.11,12 It is well known that apatite structure compounds (space group P63/m), with a general chemical formula of the form A10(XO4)6Z2 (A = Ca2+,Ba2+,Ce3+,La3+,Y3+, etc., X = P5+,As5+,Si4+, etc., and Z = O2−,F−,Cl−,OH−, etc.),13 contain two kinds of cation sites: the 9-fold coordinated 4f sites with C3 point symmetry and the 7-fold coordinated 6 h sites with a CS point symmetry, which are suitable for the substitution of various rare-earth-metal ions.14–16 Consequently, due to their adjustable structures, and excellent thermal and physicochemical stabilities, apatite compounds have become highly efficient host materials for the luminescence of various rare earth ions and have aroused widespread attention.17–19 As discussed above, the coordination environment of the Eu2+ site is anticipated to be changed via chemical composition variation among solid solution phosphors.20 Thus, the emitted color can be controlled by doping Eu2+ ions into a series of apatite solid solution hosts which are expected to display adjustable emission spectra in a wide range to meet the requirements of multi-color phosphors.
In this study, the coordination environment variation of the Eu2+ ion has been realized by the replacement of Ca2+ ions with La3+ ions and resulted in crystal splitting decreases of the Eu2+ ion, a series of color tunable solid solution phosphors Ca2+xLa8−x(SiO4)6−x(PO4)xO2:Eu2+ (x = 0,2,4,6) were successfully prepared by a high-temperature solid-state reaction. Moreover, it's worth noting that the replacement of [PO4]3− with the [SiO4]4− tetrahedron was introduced into the solid solution to realize the charge compensation because of the different valences between Ca2+–La3+ and also that the Ca4La6(SiO4)4(PO4)2O2:Eu2+ and Ca6La4(SiO4)2(PO4)4O2:Eu2+ phosphors were synthesized for the first time.
The phase purity was demonstrated by XRD, XPS and XRF, and the crystal structure information was analyzed base on Rietveld refinement results. In addition, the relationship between the crystal structure evolutions, the PLE and PL spectra at normal and low temperatures, the lifetimes and the temperature dependence spectra have been discussed in detail.
2. Experimental
2.1. Materials and synthesis
A series of apatite solid solution phosphors Ca2+xLa8−x(SiO4)6−x(PO4)xO2:0.02Eu2+ (x = 0,2,4,6) were synthesized according to a conventional high-temperature solid-state method. Ca2CO3 (analytical reagent (A. R.)), La2O3 (A. R.), SiO2 (A. R.), NH4H2PO4 (A. R.), and Eu2O3 (A. R.) were used as the raw materials. After the raw materials were well ground in an agate mortar for 10 min according to the stoichiometric amounts of reactants, all the materials were preheated for 1 h at 1000 °C in a corundum crucible to eliminate H2O and CO2. Then, the mixed powders were sintered at 1525 °C in a reductive atmosphere (H2 10%, N2 90%) for 6 h in a horizontal tube furnace. Finally, the sintered products were well ground after cooling down to room temperature.2.2. Characterization
The X-ray diffraction (XRD) data of the powder samples were collected on an X-ray powder diffractometer (D/max-IIIA, Rigaku, Japan) with a step-wise scanning mode over the 2θ range of 10°–110° using Cu Kα radiation (1.5406 Å) under an operating voltage (40 kV) and current (100 mA). The XRD patterns, which were submitted for Rietveld refinement, were acquired at a step size of 0.02° with a counting time of 2 s per step.X-ray photoelectron spectroscopy (XPS) measurements were collected using a Kratos Axis Ultra DLD, employing an MCP stack & delay-line photoelectron detector with scanned & snapshot spectroscopy modes. X-ray Fluorescence (XRF) measurements were measured by utilizing a Rigaku ZSX Primus II X-ray fluorescence spectrograph. The photoluminescence emission (PL) and the photoluminescence excitation (PLE) spectra at 298k and 8k were measured using a Hitachi F-4600 fluorescence spectrophotometer (Japan) equipped with a 150 W Xe lamp as the excitation source. The temperature-dependent luminescence properties were measured on the same spectrophotometer which was assembled with a computer-controlled electric furnace and a self-made heating attachment. The morphology was observed using high-resolution transmission electron microscopy (HRTEM; JEM-21000, JEOL, Japan). The room-temperature luminescence decay curves were obtained from a spectrofluorometer (Horiba, Jobin Yvon TBXPS) using a tunable pulse laser radiation (nano-LED) for the excitation.
3. Results and discussion
3.1. Phase formation and structural characteristics
The XRD patterns of Ca2+xLa8−x(SiO4)6−x(PO4)xO2:0.02Eu2+ (x = 0,2,4,6) and the standard PDF card (JCPDF 29-0337) of Ca2La8(SiO4)6O2 are displayed in Fig. 1a. All the diffraction peaks of these samples matched well with the JCPDF 29-0337 card, indicating that the series of solid solution phosphors had been prepared successfully and that the introduction of the Eu2+ ion did not cause any impurity phase. In addition, the diffraction peaks of the last three samples (x = 2, 4, 6) have obviously shifted towards the high degrees with the increase of the ratio of Ca/La. This can be explained as the substitution of the large La3+ ion by the small Ca2+ ion and the large [SiO4]4− tetrahedron by the small [PO4]3− tetrahedron causes a decrease in the lattice constant of the Ca2+xLa8−x(SiO4)6−x(PO4)xO2 hosts,21 which is also evidence demonstrating the existence of a solid solution in the whole range (x = 0,2,4,6).9 The photoelectron survey spectrum of the Ca6La4(SiO4)2(PO4)4O2:0.02Eu2+ sample is plotted in Fig. 1b, depicting photoelectron peaks corresponding to O 2s, Si 2p, P 2p, La 4p3/2, Ca 2p, Ca 2s, O 1s, La 3d5/2, La 3d3/2 and Eu 3d5/2 emission. The inset shows the high-resolution XPS spectrum at the Eu 3d5/2 position, and the peak at 1126.28 ev agrees well with the signal of Eu2+ 3d5/2, demonstrating the existence of the Eu2+ ion. Furthermore, the elemental content of the Ca6La4(SiO4)2(PO4)4O2:0.02Eu2+ sample was further examined and calculated by XRF. As shown in Table 1, the proportions of all components match well with the suggested formula.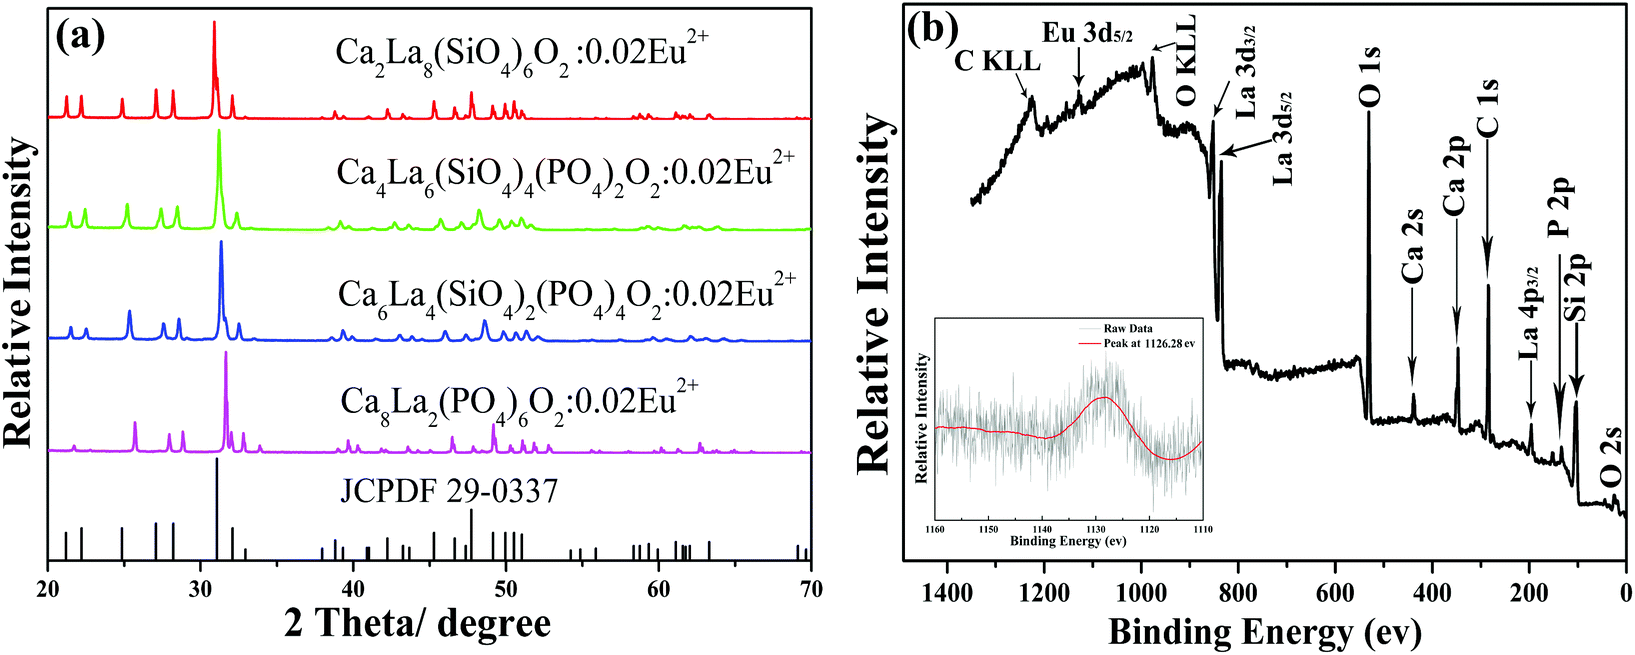 | ||
| Fig. 1 (a) The XRD patterns of Ca2+xLa8−x(SiO4)6−x(PO4)xO2:0.02Eu2+ (x = 0,2,4,6) and the standard PDF card (JCPDF 29-0337) of Ca2La8(SiO4)6O2. (b) The photoelectron survey spectra of the Ca6La4(SiO4)2(PO4)4O2:0.02Eu2+ sample. The inset shows the high-resolution XPS spectra at the Eu 3d5/2 position. | ||
| Component | Result | Unit | Intensity | Spectral lines of the element |
|---|---|---|---|---|
| O | 23.5 | Mass% | 0.0745 | O-KA |
| Si | 3.17 | Mass% | 3.064 | Si-KA |
| P | 8.04 | Mass% | 20.233 | P-KA |
| Ca | 18.7 | Mass% | 35.581 | Ca-KA |
| La | 42.5 | Mass% | 6.245 | La-LA |
| Eu | 1.55 | Mass% | 0.5759 | Eu-LA |
Fig. 2a displays the crystal structure of the 2 × 2 × 2 unit cells of Ca4La6(SiO4)4(PO4)2O2, which is chosen as the representative. Obviously, Ca4La6(SiO4)4(PO4)2O2 has a layered structure and contains two kinds of cation sites: the inner-laminar site labeled M(I) with the local symmetry C3 and the inter-laminar site labeled M(II) with the local symmetry Cs.22 The two kinds of different coordination environment of the cation sites are displayed in Fig. 2b and c. The M(I) site at the 4f site (C3) was surrounded by 9 oxygen atoms to form a mono-caped square antiprism, which was connected with tetrahedral PO4/SiO4 groups, and the M(II) site at the 6 h site (CS) formed a pentagonal bipyramid with the surrounding 7 oxygen atoms and these bipyramids were connected with each other through a vertex. Theoretically, both the Ca2+ ion and the La3+ ion are uniformly distributed in the two kinds of cationic sites,23 illustrating that the ratio of Ca/La is easily changed by adjusting the proportion of raw materials.
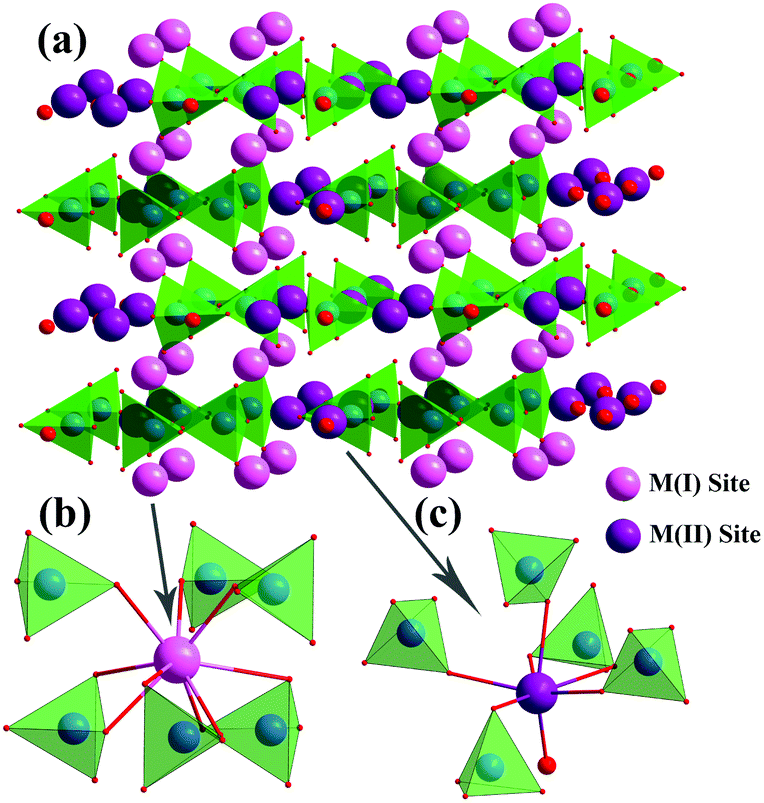 | ||
| Fig. 2 (a) The crystal structure of the 2 × 2 × 2 unit cells of Ca4La6(SiO4)4(PO4)2:0.02Eu2+, (b) the coordination environment of the M(I) site with the local symmetry C3 and (c) the M(II) site with the local symmetry CS. | ||
The four XRD patterns were analyzed using the Rietveld refinement. The observed (×), calculated (red) and difference (gray) XRD profiles for the refinements of Ca2+xLa8−x(SiO4)6−x(PO4)xO2 (x = 0,2,4,6) are shown in Fig. 3a–d. The main refinement parameters of the processing and refinement results are presented in Table 2. The results of the refinement further demonstrate that the series of solid solution phosphors are single phase without any impurity or secondary phases. On the other hand, the ranges of the weighted profile R-factor (Rwp) and the R-Bragg factor (RB) are 10.038%–11.012% and 1.792%–2.777%, respectively, indicating that the crystal structures of these phosphors match well with the starting model (Ca2La8(SiO4)6) after the refinement and that the results are believable and publishable. Meanwhile, we also refined the concentration of these samples while obtaining the high-quality XRD data. According to these refinement results, the calculated formula are Ca2.87(2)La7.13(2)(SiO4)6O2, Ca4.47(2)La5.53(2)(SiO4)3.53(2)(PO4)2.47(2)O2, Ca5.52(2)La3.48(2)(SiO4)1.48(2)(PO4)4.52(2)O2 and Ca8.28(2)La1.72(2)(PO4)6O2, demonstrating that the refined concentrations are highly consistent with the suggested formula and that the coordination environment variation is mainly caused by the replacement of a Ca2+ with a La3+ ion. Moreover, according to the XRD data and the Rietveld refinement, no additive superstructure peaks were detected, this feature proves that the Ca2+ ions and the La3+ ions were randomly mixed at the atomic level.24 In addition, the unit lattice parameters and the unit cell volumes of the as-prepared phosphors are given in Fig. 4. The high linear fitting coefficients (0.99334–0.99796) proved the crystal structure evolution of this continuous solid solution. The lattice parameters and unit cell volumes show linear decreases and are proportional to the value of x, which is attributed to the substitution of the large La3+ ions by small Ca2+ ions, suggesting that the coordination environment of the cations become more unconsolidated as x increases.25
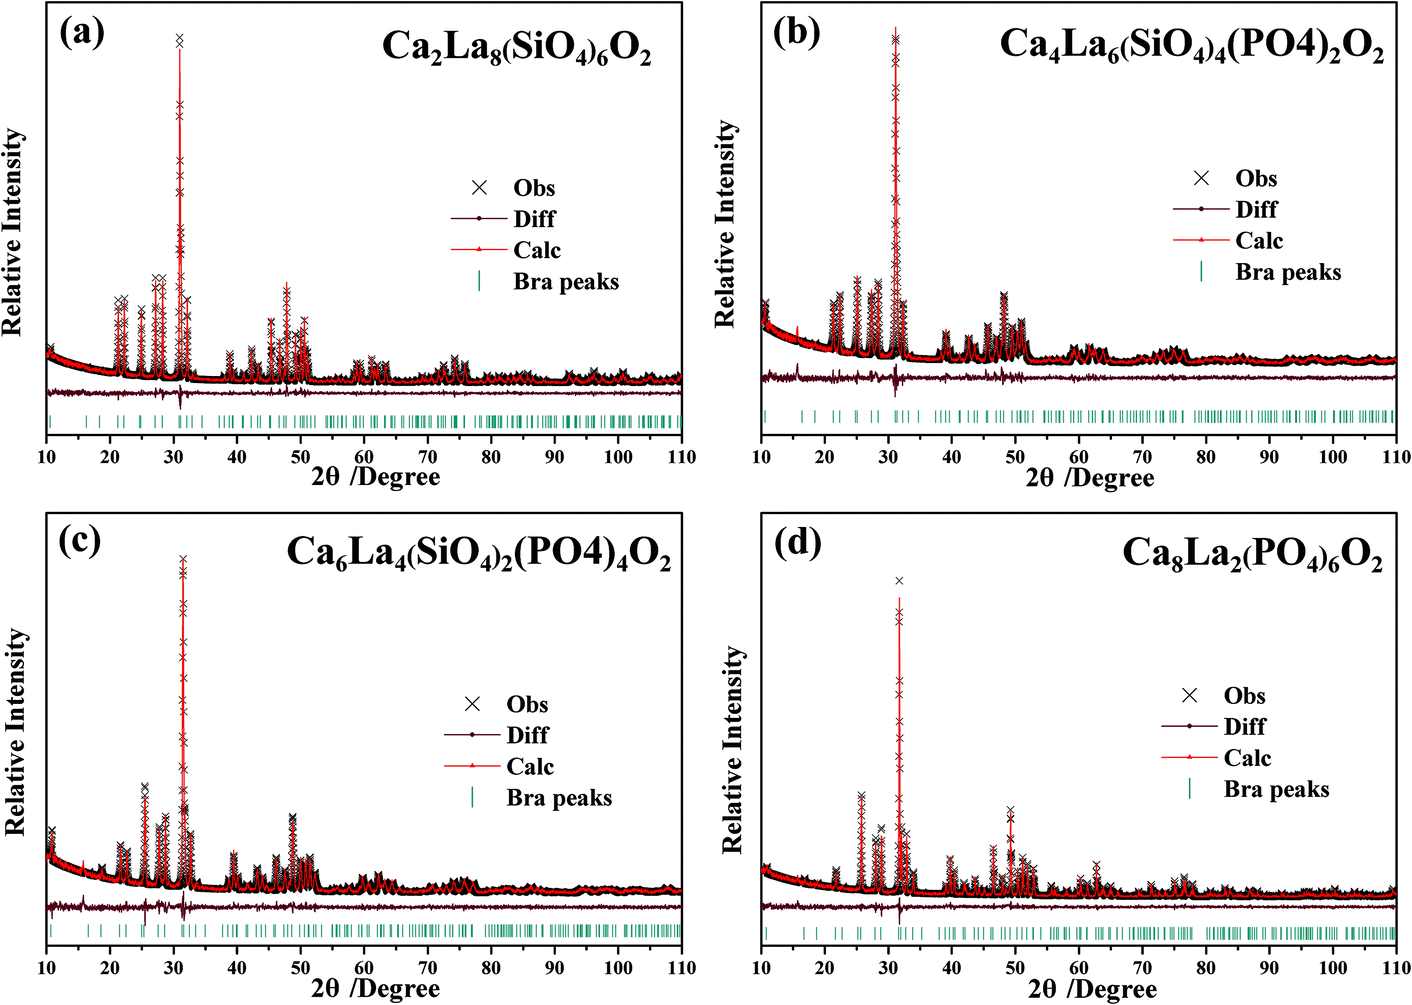 | ||
| Fig. 3 (a–d) Powder XRD patterns (×) of the Ca2+xLa8−x(SiO4)6−x(PO4)xO2:0.02Eu2+ (x = 0,2,4,6) samples with the corresponding Rietveld refinement (red) and residuals (gray). | ||
 | ||
| Fig. 4 The refined unit cell parameters (a, c) and cell volume (v) of Ca2+xLa8−x(SiO4)6−x(PO4)xO2:0.02Eu2+ (x = 0,2,4,6). | ||
| Compound | x = 0 | x = 2 | x = 4 | x = 6 |
|---|---|---|---|---|
| Sp.Gr. | P63/m | P63/m | P63/m | P63/m |
| a, Å | 9.6559(1) | 9.5948(6) | 9.5325(4) | 9.4606(2) |
| b, Å | 9.6559(1) | 9.5948(6) | 9.5325(4) | 9.4606(2) |
| c, Å | 7.1529(1) | 7.0882(5) | 7.0206(4) | 6.9356(1) |
| α, ° | 90 | 90 | 90 | 90 |
| β, ° | 90 | 90 | 90 | 90 |
| γ, ° | 120 | 120 | 120 | 120 |
| V, Å3 | 577.56(2) | 565.12(8) | 552.49(6) | 537.59(2) |
| 2θ-Interval, | 10–110 | 10–110 | 10–110 | 10–110 |
| R wp, % | 10.038 | 11.012 | 10.135 | 10.065 |
| R exp, % | 1.311 | 1.299 | 1.287 | 1.325 |
| R B, % | 2.268 | 2.168 | 1.792 | 2.777 |
As shown in Fig. 5a–d, the linear change in the crystal structure of these solid solution phosphors was further verified by HRTEM and fast Fourier transform (FFT) images. Both the HRTEM and FFT images illustrate that no significant structural defects appeared in the selected areas of these single-phase samples and that good crystallinity was obtained. Moreover, the lattice fringe measurements with the d spacings of 0.315 nm, 0.837 nm, 0.354 nm, and 0.353 nm could be assigned to the planes (210), (010), (021) and (021) for Ca2+xLa8−x(SiO4)6−x(PO4)xO2:0.02Eu2+ (x = 0,2,4,6). The measured d spacing in different orientations could be transformed into the same d spacing value of (021) according to the classic Bragg equation.24 Therefore, the normalized d spacings of (021) were calculated to be 0.358 nm, 0.356 nm, 0.354 nm and 0.353 nm. Consequently, the decrease of the d spacings is well consistent with the refinement results, indicating the existence of structural evolution in the series of solid solutions.
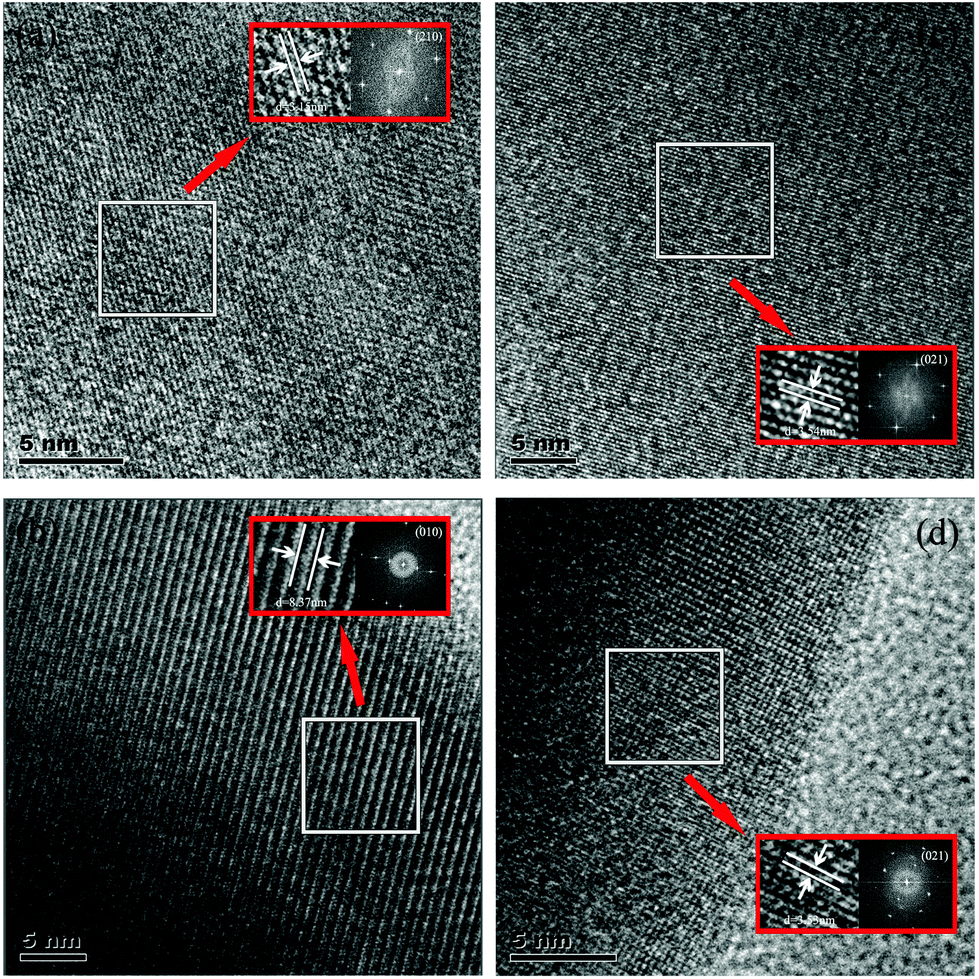 | ||
| Fig. 5 HRTEM and FFT images for Ca2+xLa8−x(SiO4)6−x(PO4)xO2:0.02Eu2+ with different x values, x = 0 (a), x = 2 (b), x = 4 (c) and x = 6 (d). | ||
The effective ionic radii of the Ca2+ ions are 1.18 (CN = 9) and 1.06 Å (CN = 7) and the effective ionic radii of the La3+ ions are 1.21 (CN = 9) and 1.10 Å (CN = 7). Theoretically, considering the similar ionic radius and valence, the Eu2+ ion (RCN=9 = 1.3, RCN=7 = 1.2) is expected to substitute the La3+ and Ca2+ sites in the Ca2+xLa8−x(SiO4)6−x(PO4)xO2 (x = 0,2,4,6) crystal structure.26 Therefore, four kinds of emitting blocks will be included in the host: Ca(I), Ca(II), La(I) and La(II). The occupation rates of Ca(I), Ca(II), La(I), and La(II), reflecting the distribution of Ca2+ ions and La3+ ions in the two cationic sites, have been refined and displayed in Table 3. When the content of Ca2+ ions increases, the occupation rate of La(II) is decreased faster than that of La(I) and the M(II) site is totally occupied by Ca2+ ions while the chemical formula is Ca8La2(PO4)6O2 (x = 6), which shows similar results to the previous studies.16,26 The phenomenon can be explained as follows: the Eu2+ ion located at the M(II) site that is connected with a free oxygen ion, results in a very short Eu–O distance due to the small sum of the electrostatic bond strength of the cations toward the free oxygen ion. Thus, it must be very unfavorable for the (6 h) sites to be occupied by a cation with a large radius in these compounds.27
| Sites | x = 0 | x = 2 | x = 4 | x = 6 |
|---|---|---|---|---|
| Ca1 | 0.12(2) | 0.20(2) | 0.43(1) | 0.714(7) |
| La1 | 0.88(2) | 0.80(2) | 0.57(1) | 0.286(7) |
| Ca2 | 0.53(1) | 0.81(1) | 0.983(7) | 1.000(6) |
| La2 | 0.47(1) | 0.19(1) | 0.017(7) | 0.000(6) |
3.2. Photoluminescence characteristics
The PLE spectra (monitored in the range of 460 nm–508 nm) and the PL spectra (under 365 nm excitation) of the Ca2+xLa8−x(SiO4)6−x(PO4)xO2:0.02Eu2+ (x = 0,2,4,6) phosphors at room temperature are displayed in Fig. 6a and b, respectively. The PLE spectra depict a series of broad excitation bands between 250 nm and 450 nm, which are attributed to the 4f7 → 4f65d1 transition of the Eu2+ ion,28 and the emission spectra show a series of broad emission bands from 400 nm to 650 nm, which are attributed to the 5d → 4f transition of the Eu2+ ion. As shown in Fig. 6b, a strong asymmetric broad band with a maximum wavelength peak at 508 nm was detected in the PL spectrum of Ca2La8(SiO4)6O2:0.02Eu2+, which was chosen as the representative of the solid solution phosphors. The asymmetric emission band can be decomposed into two Gaussian component peaks at 504 nm (I1) and 542 nm (I2) demonstrating the existence of two types of emitting centers in Ca2La8(SiO4)6O2:0.02Eu2+.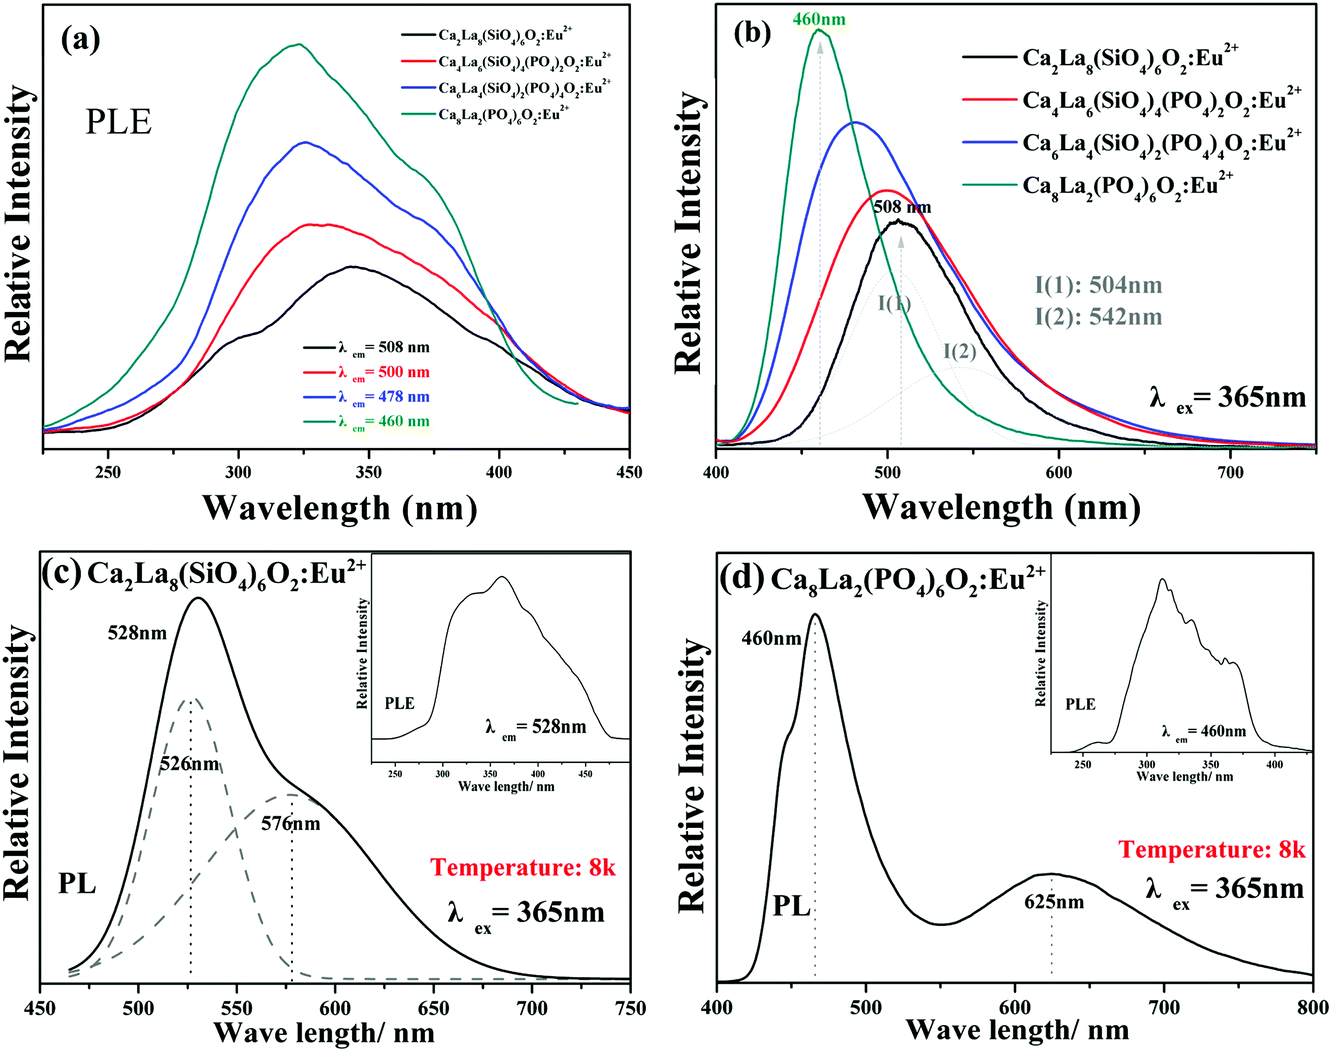 | ||
| Fig. 6 (a) The PLE monitored in the range of 460 nm–508 nm and (b) the PL spectra under 365 nm excitation of Ca2+xLa8−x(SiO4)6−x(PO4)xO2:0.02Eu2+ (x = 0,2,4,6) at room temperature. (c) The PL and PLE spectra at low temperature (8k) of Ca2La8(SiO4)6O2:0.02Eu2+ and (d) the PL and PLE spectra at low temperature (8k) of Ca8La2(PO4)6O2:0.02Eu2+. | ||
Fig. 6c and d display the low temperature (8k) PLE and PL spectra of Ca2La8(SiO4)6O2:0.02Eu2+ and Ca8La2(PO4)6O2:0.02Eu2+. The PL spectra of Ca2La8(SiO4)6O2:0.02Eu2+ can be separated into two components with peaks at 526 nm and 576 nm, and the PL spectra of Ca8La2(PO4)6O2:0.02Eu2+ obviously contains two components with peaks at 460 nm and 625 nm. The results further demonstrate that there are two kinds of cation sites included in the series of apatite phosphors which could be occupied by the Eu2+ ion.
Actually, considering the valence state and the previous results,16,29 the blue emission band observed in the PL spectrum of Ca2La8(PO4)6O2:0.02Eu2+ is attributed to the substitution of a Ca2+ ion by a Eu2+ ion. According to the report by Van Uitert, to further demonstrate the relationship between emission peaks and emission centers, the possible crystallographic site may be investigated theoretically by the following equation:30
 | (1) |
![[thin space (1/6-em)]](https://www.rsc.org/images/entities/char_2009.gif) 000 cm−1 for Eu2+), V is the valence of the activator (Eu2+) ion (V = 2), n is the number of anions in the immediate shell around the Eu2+ ion, r is the radius of the host cation replaced by the Eu2+ ion (in Å), and Ea is the electron affinity of the atoms that form anions (in eV) depending on the anion complex type. Here, Ea was approximately determined as 1.60 for the [SiO4]4− in the oxide host31 and the r values of Ca(I) and Ca(II) were calculated to be 118 pm and 106 pm, respectively. Consequently, the Ecalcd values of Ca(I) and Ca(II) were calculated to be 19693 cm−1 and 18546 cm−1, respectively. The results indicated that the emission band centered at 504 nm was attributed to a Eu2+ ion occupying the Ca(I) site with C3 symmetry and nine-coordination and that the emission band peaked at 542 nm was attributed to a Eu2+ ion occupying the Ca(II) site with CS symmetry and seven-coordination.
000 cm−1 for Eu2+), V is the valence of the activator (Eu2+) ion (V = 2), n is the number of anions in the immediate shell around the Eu2+ ion, r is the radius of the host cation replaced by the Eu2+ ion (in Å), and Ea is the electron affinity of the atoms that form anions (in eV) depending on the anion complex type. Here, Ea was approximately determined as 1.60 for the [SiO4]4− in the oxide host31 and the r values of Ca(I) and Ca(II) were calculated to be 118 pm and 106 pm, respectively. Consequently, the Ecalcd values of Ca(I) and Ca(II) were calculated to be 19693 cm−1 and 18546 cm−1, respectively. The results indicated that the emission band centered at 504 nm was attributed to a Eu2+ ion occupying the Ca(I) site with C3 symmetry and nine-coordination and that the emission band peaked at 542 nm was attributed to a Eu2+ ion occupying the Ca(II) site with CS symmetry and seven-coordination.
The emission wavelengths of the Ca2+xLa8−x(SiO4)6−x(PO4)xO2:0.02Eu2+ (x = 0,2,4,6) PL spectra show a wide blue shift from 508 nm to 460 nm with the increase of the x value which is dependent on the crystal field strength variation. The structural model of the cation substitution around the Eu2+ ion sites is depicted in Fig. 7. In this regard, the crystal field splitting of the Eu2+ ions can be determined as obeying:17,32,33
 | (2) |
 | ||
| Fig. 7 Structural model for explaining the photoluminescence evolution observed in the Ca2+xLa8−x(SiO4)6−x(PO4)xO2:0.02Eu2+ (x = 0,2,4,6) phosphors: (a–d) represent Eu2+ located in the M(I) site, (e–h) represent Eu2+ located in the M(II) site. | ||
In addition, as shown in Table 4, the stokes shifts were estimated to be 6135 cm−1–5985 cm−1 and the full width at half-maximum (FWHMs) of the PLE spectra decrease from 142 nm to 113 nm with the increase in x. The crystal-field splitting of the Eu2+ ions was estimated to be 22230 cm−1–18190 cm−1, which is calculated by the gap between the first and the last component peaks of the PLE spectra. All the computations further demonstrate the decrease of the crystal field splitting.37
| x Values | λ ex range (nm) | FWHM of λex (nm) | λ em (nm) | Stokes shift (cm−1) | Crystal field splitting (cm−1) |
|---|---|---|---|---|---|
| 0 | 250–450 | 142 | 508 | 6135 | 22230 |
| 2 | 250–450 | 127 | 500 | 6082 | 20833 |
| 4 | 250–450 | 118 | 478 | 6039 | 19231 |
| 6 | 250–400 | 113 | 460 | 5985 | 18190 |
Furthermore, Fig. 8 presents the room temperature decay curves of the Eu2+ ion luminescence in the Ca2+xLa8−x(SiO4)6−x(PO4)xO2:0.02Eu2+ (x = 0,2,4,6) series. All of the decay curves can be well fitted with a second order exponential equation:
| I(t) = A1 exp(−t/τ1)+A2 exp(−t/τ2) | (3) |
| τ* = (A1τ12 + A2τ22)/(A1τ1 + A2τ2) | (4) |
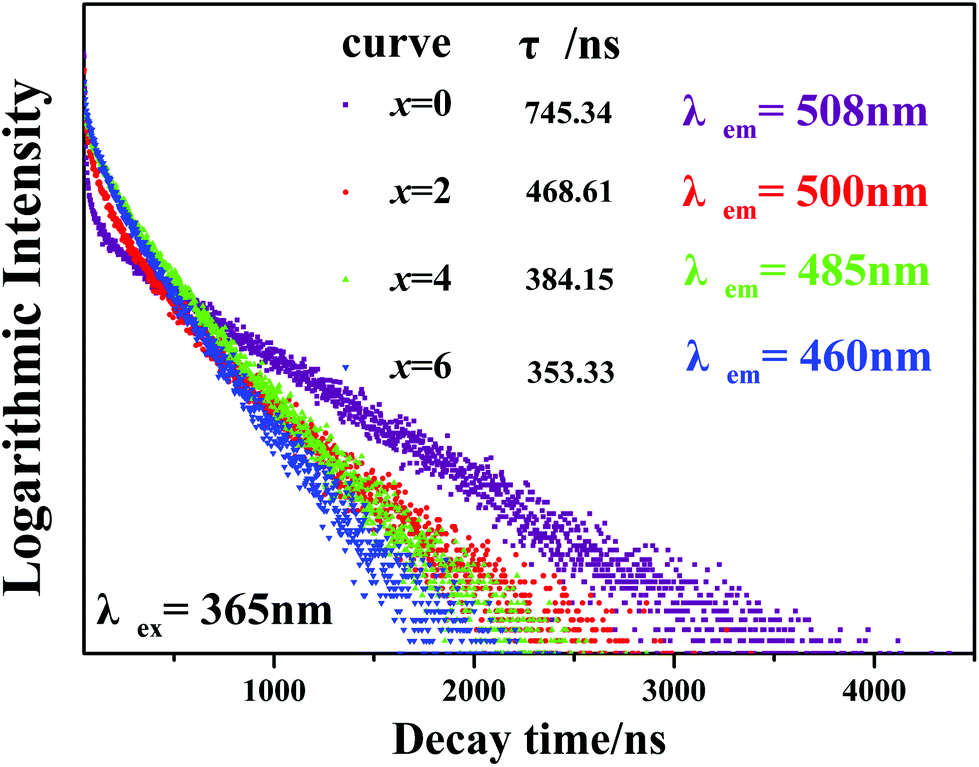 | ||
| Fig. 8 Room temperature decay curves of the Ca2+xLa8−x(SiO4)6−x(PO4)xO2:0.02Eu2+ (x = 0,2,4,6) phosphors. | ||
The effective decay times were calculated to be 745.34, 468.61, 384.15 and 353.33 ns with x = 0, 2, 4 and 6, respectively. One can see that the decay times decrease with the increasing Ca2+ ion content. Due to the phase structures becoming more unconsolidated compared to the original Ca2La8(SiO4)4:0.02Eu2+ phase, the increasing possibility of energy transfer among the Eu2+ ions increases the possible non-radiative transition and leads to the decreasing lifetime values.32,38 Also the two decay components (τ1 and τ2) proved that the Eu2+ occupied two different Ca2+ sites.13
The temperature dependence experiment proved that the thermal stability is consistent with the crystal structure evolution in the as-prepared series phosphors, and the peak emission intensity that normalized to 25 °C values was depicted in Fig. 9. As shown in Fig. 9, the emission intensity of all the samples decreases with the increase in temperature. Additionally, the thermal stability gradually decreases with the increasing x values, this phenomenon can be explained by the neighboring-cation effect.39,40 The replacement of large La3+ ions by small Ca2+ ions makes the distances between the Eu2+ activator ion and the neighboring cations become smaller, as demonstrated by the refined cell parameters and cell volume, resulting in a larger coulombic force following the inverse-square law41,42 and the decrease of the thermal quenching barrier height. Thus, the thermal stability becomes lower when the replacement occurs.
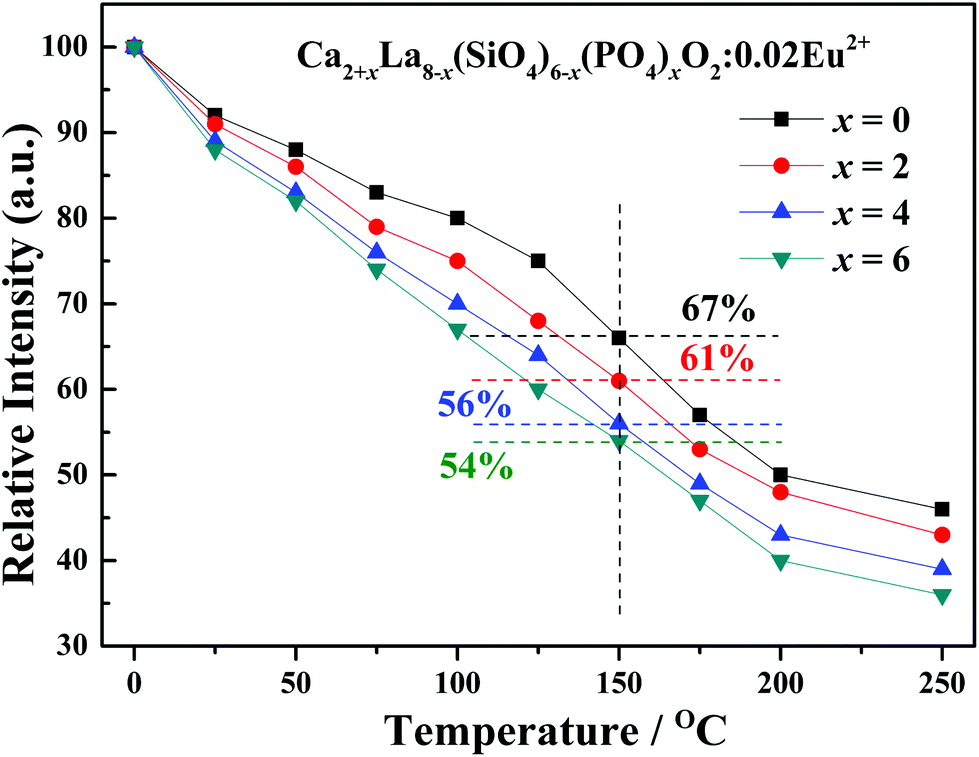 | ||
| Fig. 9 The peak emission intensity of temperature dependence that normalized to 25 °C values. | ||
Luminescence efficiency is an important technological parameter for the application of phosphors. The internal quantum efficiency (QE) of the Ca2+xLa8−x(SiO4)6−x(PO4)xO2:0.02Eu2+ (x = 0,2,4,6) phosphors was measured and calculated following:12
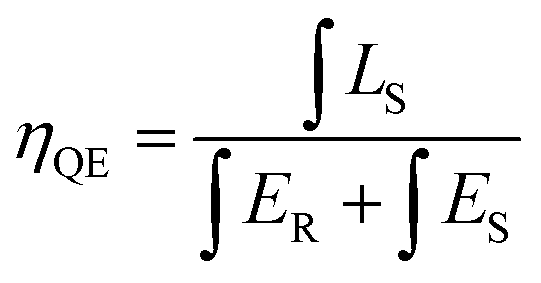 | (5) |
The CIE coordinates and the digital photos of the Ca2+xLa8−x(SiO4)6−x(PO4)xO2:0.02Eu2+ (x = 0,2,4,6) phosphors under 365 nm excitation are displayed in Fig. 10. The calculated CIE coordinates are (0.2099, 0.4884) for x = 0, (0.2167, 0.3585) for x = 2, (0.1955, 0.2992) for x = 4 and (0.1846, 0.1851) for x = 6. Obviously, both the digital photos and the coordinates demonstrate that the emitted color of the solid solution phosphors Ca2+xLa8−x(SiO4)6−x(PO4)xO2:0.02Eu2+ (x = 0,2,4,6) can be adjusted in the wide range from green to blue by changing the ratio of Ca/La.
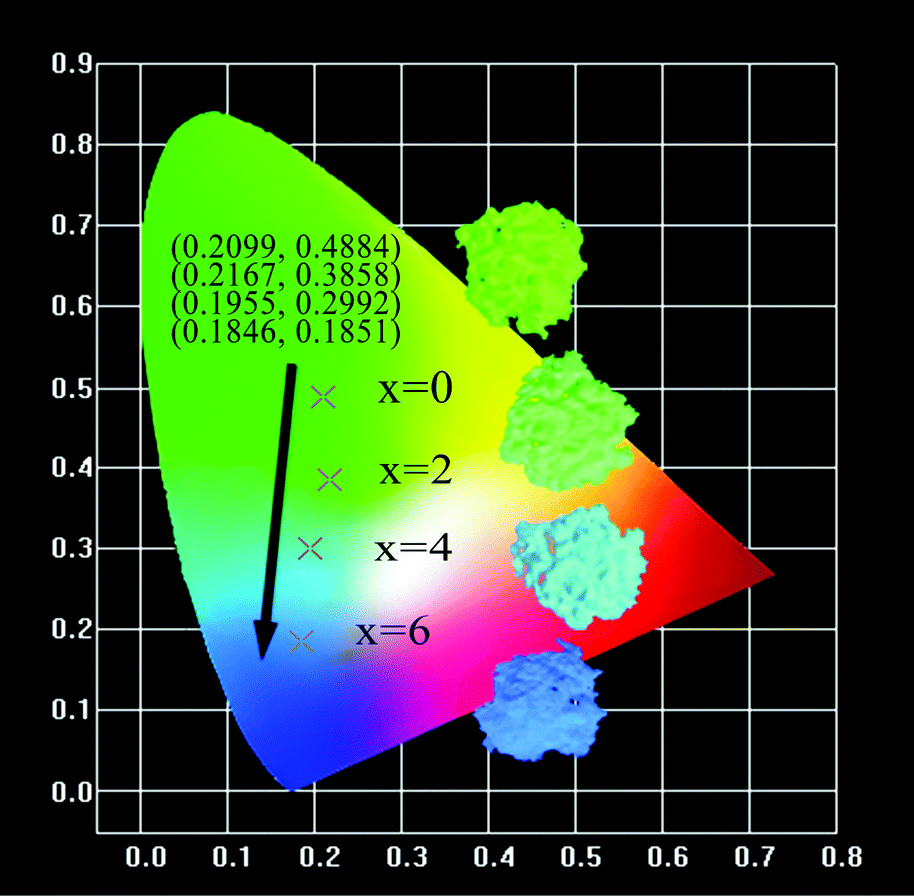 | ||
| Fig. 10 The CIE coordinates and the digital photos of the Ca2+xLa8−x(SiO4)6−x(PO4)xO2:0.02Eu2+ (x = 0,2,4,6) phosphors. | ||
4. Conclusions
In summary, a series of continuous solid solution phosphors Ca2+xLa8−x(SiO4)6−x(PO4)xO2:0.02Eu2+ (x = 0,2,4,6) were successfully synthesized by a solid-state reaction method. The phase purity was examined by XRD, XPS and XRF, the crystal structure information was identified by both Rietveld refinement and HRTEM. The refined concentration, cell parameters and occupation rate matched well with the suggested formula and the variation tendency of Ca/La demonstrating that Eu2+ activated Ca2La8(SiO4)6O2 and Ca8La2(PO4)6O2 to form continuous solid solution phosphors. Different spectroscopic behavior properties based on structural variations were verified among the series of phosphors. The PL spectra at room temperature and low temperature (8k) were well separated into two component peaks, demonstrating that there are two kinds of Eu2+ ion sites included in these apatite phosphors. Furthermore, the short wavelength emission peak is from the Eu2+ ion located at the 4f site with nine coordination and the long wavelength emission peak is ascribed to the Eu2+ ion occupying the 6 h site with seven coordination. Under 365 nm excitation, the series of phosphors show a strong blue shift from 508 nm to 460 nm. It can be explained by the fact that the substitution of the large La3+ ions by small Ca2+ ions induced a decreased crystal field splitting of the Eu2+ ions, which led to the emission energy from the 5d excited state to the 4f ground state increasing. Consequently, the emitted color of the series of phosphors could be tuned from green to blue by adjusting the ratio of Ca/La.Acknowledgements
This work was sponsored by National Natural Science Foundation of China (Grant No. 51472223), the Program for New Century Excellent Talents in University of Ministry of Education of China (Grant No. NCET-12-0951) and the Fundamental Research Funds for the Central Universities (Grant No. 2652015020).References
- W. R. Liu, C. H. Huang, C. W. Yeh, J. C. Tsai, Y. C. Chiu, Y. T. Yeh and R. S. Liu, Inorg. Chem., 2012, 51, 9636 CrossRef CAS PubMed.
- H. Wu, X. M. Zhang, C. F. Guo, J. Xu, M. M. Wu and Q. Su, IEEE Photonics Technol. Lett., 2015, 17, 1160–1162 CrossRef.
- X. J. Zhang, L. Huang, F. J. Pan, M. M. Wu, J. Wang, Y. Chen and Q. Su, ACS Appl. Mater. Interfaces, 2014, 6, 2709–2717 CAS.
- M. M. Shang, D. L. Geng, D. M. Yang, X. Kang, Y. Zhang and J. Lin, Inorg. Chem., 2013, 52, 3102–3112 CrossRef CAS PubMed.
- Z. G. Xia, Y. Y. Zhang, M. S. Molokeev and V. V. Atuchin, J. Phys. Chem. C, 2013, 117, 20847–20854 CAS.
- J. Chen, Y. G. Liu, M. H. Fang and Z. H. Huang, Inorg. Chem., 2014, 53, 11396–11407 CrossRef CAS PubMed.
- X. J. Zhang, J. Wang, L. Huang, F. J. Pan, Y. Chen, B. F. Lei, M. Y. Peng and M. M. Wu, ACS Appl. Mater. Interfaces, 2015, 7, 10044–10054 CAS.
- J. Chen, Y. G. Liu, H. K. Liu, H. Ding, M. H. Fang and Z. H. Huang, Opt. Mater., 2015, 42, 80–86 CrossRef CAS.
- M. Zhang, J. Wang, Z. Zhang, Q. Zhang and Q. Su, Appl. Phys. B: Lasers Opt., 2008, 93, 829–835 CrossRef CAS.
- K. H. Kwon, W. B. Im, H. S. Jang, H. S. Yoo and D. Y. Jeon, Inorg. Chem., 2009, 48, 11525–11532 CrossRef CAS PubMed.
- P. Dorenbos, J. Lumin., 2003, 104, 239–260 CrossRef CAS.
- J. Chen, Y. G. Liu, L. F. Mei, H. K. Liu, M. H. Fang and Z. H. Huang, Sci. Rep., 2015, 14, 13258 Search PubMed.
- Z. Xia, M. S. Molokeev, W. B. Im, S. Unithrattil and Q. Liu, J. Phys. Chem. C, 2015, 119, 9488–9495 CAS.
- G. Zhu, Y. R. Shi, M. Mikami, Y. Shimomura and Y. H. Wang, Opt. Mater., 2013, 3, 229–236 CrossRef CAS.
- H. K. Liu, Y. Y. Zhang, L. B. Liao, Q. F. Guo and L. F. Mei, Ceram. Int., 2014, 40, 13709–13713 CrossRef CAS.
- M. M. Shang, G. G. Li, D. L. Geng, D. M. Yang, X. J. Kang, Y. Zhang, H. Z. Lian and J. Lin, J. Phys. Chem. C, 2012, 116, 10222–10231 CAS.
- N. Guo, H. P. You, C. Z. Ji, R. Z. Ouyang and D. H. Wu, Dalton Trans., 2014, 43, 12373–12379 RSC.
- G. G. Li, Y. Zhang, D. L. Geng, M. M. Shang, C. Peng and J. Lin, ACS Appl. Mater. Interfaces, 2012, 4, 296–305 CAS.
- Y. Zhang, G. G. Li, D. L. Geng, M. M. Shang, C. Peng and J. Lin, Inorg. Chem., 2012, 51, 11655–11664 CrossRef CAS PubMed.
- H. P. Ji, Z. H. Huang, Z. G. Xia, M. S. Molokeev, V. V. Atuchin, M. H. Fang and Y. G. Liu, J. Phys. Chem. C, 2015, 119, 2038–2045 CAS.
- Y. R. Do, K. Y. Ko, S. H. Na and Y. D. Huh, J. Electrochem. Soc., 2006, 153, 142–146 CrossRef.
- F. M. Ryan, R. W. Warren, R. H. Hopkins and J. Murphy, J. Electrochem. Soc., 1978, 125, 1493–1498 CrossRef CAS.
- W. Y. Huang, F. Yoshimure, K. Ueda, Y. Shimomura, H. S. Sheu, T. S. Chen, H. F. Greer, W. Z. Zhou, S. F. Hu, R. S. Liu and J. P. Attfield, J. Am. Chem. Soc., 2012, 134, 14108 CrossRef PubMed.
- Z. Xia, Y. Zhang, M. S. Molokeev, V. V. Atuchin and Y. Luo, Sci. Rep., 2013, 3, 3310 Search PubMed.
- K.-W. Huang, W.-T. Chen, C.-I. Chu, S.-F. Hu, H.-S. Sheu, B.-M. Cheng, J.-M. Chen and R.-S. Liu, Chem. Mater., 2012, 24, 2220–2227 CrossRef CAS.
- R. E. Ouenzerfia, G. Panczera, C. Goutaudiera, M. T. Cohen-Adada, G. Boulona, M. Trabelsi-Ayedib and N. Kbir-Ariguibc, Opt. Mater., 2001, 16, 301–310 CrossRef.
- G. Li, D. Geng, M. Shang, Y. Zhang, C. Peng, Z. Cheng and J. Lin, J. Phys. Chem. C, 2011, 115, 21882–21892 CAS.
- G. Blasse, W. L. Wanmaker, J. W. Tervrugt and A. Bril, Philips Res. Rep., 1968, 23, 189–200 CAS.
- B. Lee, S. Lee, H. G. Jeong and K. S. Sohn, ACS Comb. Sci., 2011, 13, 154–158 CrossRef CAS PubMed.
- V. Uitert, J. Lumin., 1984, 29, 1–9 CrossRef.
- H. P. Ji, Z. H. Huang, Z. G. Xia, M. S. Molokeev, X. X. Jiang, Z. H. Lin and V. V. Atuchin, Dalton Trans., 2015, 44, 7679–7686 RSC.
- C. Zhao, Z. Xia and S. Yu, J. Mater. Chem. C, 2014, 2, 6032 RSC.
- C.-H. Huang, P.-J. Wu, J.-F. Lee and T.-M. Chen, J. Mater. Chem., 2011, 21, 10489 RSC.
- P. Dorenbos, Phys. Rev. B: Condens. Matter, 2001, 64, 117–125 CrossRef.
- K. A. Denault, J. Brgoch, M. W. Gaultois, A. Mikhailovsky, R. Petry, H. Winkler, S. P. DenBaars and R. Seshadri, Chem. Mater., 2014, 26, 2275–2282 CrossRef CAS.
- C. H. Huang, Y. C. Chiu, Y. T. Ye, T. S. Chan and T. M. Chen, ACS Appl. Mater. Interfaces, 2012, 4, 6661–6668 CAS.
- G. P. Dong, X. D. Xiao, L. L. Zhang, Z. J. Ma, X. Bao, M. Y. Peng, Q. Y. Zhang and J. R. Qiu, J. Mater. Chem., 2011, 21, 2194–2203 RSC.
- J. Zhou, Z. Xia, M. Chen, M. S. Molokeev and Q. Liu, Sci. Rep., 2015, 5, 12149 CrossRef PubMed.
- N. Guo, Y. Zheng, Y. Jia, H. Qiao and H. You, J. Phys. Chem. C, 2012, 116, 1329–1334 CAS.
- W. Y. Huang, F. Yoshimure, K. Ueda, Y. Shimomura, H. S. Sheu, T. S. Chen, H. F. Greer, W. Z. Zhou, S. F. Hu, R. S. Liu and J. P. Attfield, J. Am. Chem. Soc., 2012, 134, 14108 CrossRef PubMed.
- D. J. Griffiths, Introduction to Electrodynamics, Prentice Hall, 3rd edn, 1998, ISBN 0-13-805326-X Search PubMed.
- Z. Y. Wang, Z. G. Xia, M. S. Molokeev, V. V. Atuchin and Q. L. Liu, Dalton Trans., 2014, 43, 16800 RSC.
| This journal is © The Royal Society of Chemistry 2016 |