
 Open Access Article
 This Open Access Article is licensed under a
 Creative Commons Attribution 3.0 Unported Licence
Magnetic structures of the low temperature phase of Mn3(VO4)2 – towards understanding magnetic ordering between adjacent Kagomé layers
Oliver
Clemens
*ab,
Jochen
Rohrer
c and
Gwilherm
Nénert†
d
aTechnische Universität Darmstadt, Joint Research Laboratory Nanomaterials, Jovanka-Bontschits-Straße 2, 64287 Darmstadt, Germany. E-mail: oliver.clemens@kit.edu; Fax: +49 6151 16 6335
bKarlsruher Institut für Technologie, Institut für Nanotechnologie, Hermann-von-Helmholtz-Platz 1, 76344 Eggenstein-Leopoldshafen, Germany
cTechnische Universität Darmstadt, Institut für Materialwissenschaft, Fachgebiet Materialmodellierung, Jovanka-Bontschits-Straße. 2, 64287 Darmstadt, Germany
dInstitut Laue Langevin, 71 Avenue des Martyrs, 38000 Grenoble, France
First published on 3rd November 2015
Abstract
In this article we report on a detailed analysis of the magnetic structures of the magnetic phases of the low temperature (lt-) phase of Mn3(VO4)2 (![[double bond, length as m-dash]](https://www.rsc.org/images/entities/char_e001.gif) Mn3V2O8) with a Kagomé staircase structure determined by means of powder neutron diffraction. Two magnetic transitions were found at ∼25 K (HT1 phase, Cmc′a′) and ∼17 K (LT1 phase, Pmc′a′), in excellent agreement with previous reports. The LT1 phase is characterized by commensurate magnetic ordering of the magnetic moments on two magnetic sites of the Mn1a/b (2a + 2d) and Mn2 (8i) ions of the nuclear structure (where for the latter site two different overall orientations of magnetic moments within the ab-plane (Mn2a and Mn2b) can be distinguished. This results in mainly antiferromagnetic interactions between edge-sharing Mn-octahedra within the Kagomé planes. The HT1 phase is characterised by strong spin frustration resulting from the loss of ordering of the magnetic moments of Mn2a/b ions along the b-axis. Both magnetic structures are in agreement with the previously reported ferrimagnetic properties of lt-Mn3(VO4)2 and shed light on the magnetic phase diagram of the compound reported previously. The magnetic structures are discussed with respect to superexchange interaction pathways within the Kagomé layers, which appear to be predominantly antiferromagnetic. The magnetic structures of Mn3(VO4)2 are different compared to those reported for Ni3(VO4)2 and Co3(VO4)2 and represent an unique commensurate way out of spin frustration for compounds with strong antiferromagnetic superexchange interactions within the Kagomé layers. Additionally, we derive a superexchange model, which will be called redox-mediated M–M′(d0)–M superexchange and which can help to understand the exclusively ferromagnetic ordering of adjacent Kagomé layers found only for lt-Mn3(VO4)2.
Mn3V2O8) with a Kagomé staircase structure determined by means of powder neutron diffraction. Two magnetic transitions were found at ∼25 K (HT1 phase, Cmc′a′) and ∼17 K (LT1 phase, Pmc′a′), in excellent agreement with previous reports. The LT1 phase is characterized by commensurate magnetic ordering of the magnetic moments on two magnetic sites of the Mn1a/b (2a + 2d) and Mn2 (8i) ions of the nuclear structure (where for the latter site two different overall orientations of magnetic moments within the ab-plane (Mn2a and Mn2b) can be distinguished. This results in mainly antiferromagnetic interactions between edge-sharing Mn-octahedra within the Kagomé planes. The HT1 phase is characterised by strong spin frustration resulting from the loss of ordering of the magnetic moments of Mn2a/b ions along the b-axis. Both magnetic structures are in agreement with the previously reported ferrimagnetic properties of lt-Mn3(VO4)2 and shed light on the magnetic phase diagram of the compound reported previously. The magnetic structures are discussed with respect to superexchange interaction pathways within the Kagomé layers, which appear to be predominantly antiferromagnetic. The magnetic structures of Mn3(VO4)2 are different compared to those reported for Ni3(VO4)2 and Co3(VO4)2 and represent an unique commensurate way out of spin frustration for compounds with strong antiferromagnetic superexchange interactions within the Kagomé layers. Additionally, we derive a superexchange model, which will be called redox-mediated M–M′(d0)–M superexchange and which can help to understand the exclusively ferromagnetic ordering of adjacent Kagomé layers found only for lt-Mn3(VO4)2.
1. Introduction
Manganese orthovanadate Mn3(VO4)2 (Mn3V2O8) is known to crystallize in two modifications depending on temperature: an orthorhombic low temperature modification (lt-Mn3(VO4)2, space group Cmce)1–4 and a tetragonal high temperature modification (ht-Mn3(VO4)2, space group I![[4 with combining macron]](https://www.rsc.org/images/entities/char_0034_0304.gif) 2d).4–6
2d).4–6
ht-Mn3(VO4)2 was only discovered recently, and is stable at temperatures above ∼946 °C.4 Due to the reconstructive nature of the phase transition, the phase can be stabilized at ambient temperatures by quick cooling or partial substitution of Mn2+ by the single valent alkali metals Li+ or Na+.4–6 The material was shown to order ferrimagnetically below 55 K, and the ferrimagnetic properties agree well with the magnetic structure determined by means of neutron diffraction.
In contrast, the low temperature phase of Mn3(VO4)2 has been known for about 40 years.3 In 2000, Wang et al. showed that lt-Mn3(VO4)2 can be prepared as a single crystal from a melt containing MoO3.2 Clemens et al. recently described a facile route to prepare the material via a solid state reaction from MnO and V2O5, where special care needs to be taken on the grinding and heating procedure, in order to avoid reaction with oxygen.4
The structure of lt-Mn3(VO4)2 is isotypic to Ni3(VO4)2 and Co3(VO4)2![[thin space (1/6-em)]](https://www.rsc.org/images/entities/char_2009.gif) 7–12 and characterized as a layered Kagomé staircase lattice. This structural arrangement is well known for its spin frustration within the triangular like edge sharing coordination of MO6 octahedra (M = Mn, Co, Ni).
7–12 and characterized as a layered Kagomé staircase lattice. This structural arrangement is well known for its spin frustration within the triangular like edge sharing coordination of MO6 octahedra (M = Mn, Co, Ni).
Ni3(VO4)2 and Co3(VO4)2 were extensively studied for their magnetic properties, with Ni3(VO4)2 even showing multiferroic properties.7,13,14 The magnetic properties of lt-Mn3(VO4)2 were examined on a single crystal by Morosan et al. via direction dependent SQUID magnetization measurements. The material was shown to undergo magnetic ordering below Tm1 = 21 K (ref. 1) (described as the HT1 phase), and the authors report a second phase transition below Tm2 ∼ 15 K (described as the LT1 phase). The remanent ferromagnetic magnetisation was reported to be approximately 1.5μB per Mn3(VO4)2 unit by Wang et al., which is very low compared to the maximum magnetic moment of ∼15μB per Mn3(VO4)2 (expected for ferromagnetic ordering of high spin Mn2+ ions) or of ∼5μB, expected for antiferromagnetic alignment of the Mn ions on the two crystallographic sites within the Cmce space group (Mn1 and Mn2), being the 4a (Mn1, also referred to as crosstie site) and the 8e site (Mn2, also referred to as spine site). In this respect, Wang et al. assume that “the existence of two different occupancies for the Mn sites in this structure is the origin of the ferrimagnetic behaviour observed below TC ∼ 20 K”.2
In the article of Morosan et al., the authors state that neutron diffraction would be a valuable tool to determine the detailed nature of the different magnetic states found for Mn3(VO4)2.1 In this article, we report on a detailed examination of the structures of the magnetic phases of lt-Mn3(VO4)2 by means of a temperature dependent powder neutron diffraction study. We will give a detailed description of the exchange interactions arising between the Mn2+ ions within the Kagomé planes, and will show that the determined structures are in excellent agreement with magnetisation measurements reported by Wang et al.2 and Morosan et al.1 Furthermore, the magnetic structure which was found for the LT1 phase represents a unique commensurate way to facilitate mainly antiferromagnetic interactions within a spin frustrated Kagomé staircase lattice. In the last part of the article we will discuss differences in the magnetic structures of Co3(VO4)2 and in Ni3(VO4)2 between the adjacent Kagomé layers, and we will derive a superexchange model to explain magnetic ordering between the adjacent Kagomé planes for lt-Mn3(VO4)2 (which will be called redox-mediated M–M′(d0)–M superexchange).
2. Experimental
2.1 Sample preparation
For the synthesis of lt-Mn3(VO4)2, stoichiometric amounts of MnO (99%, Alfa Aesar) and V2O5 (99.6+ %, Aldrich) were milled for 2 h in a planetary ball mill (Fritsch pulverisette 7) at a speed of 440 rpm. The as-received powder was pressed into a pellet and heated to 800 °C for 15 h under dry flowing Ar of purity 4.6.2.2 Neutron diffraction experiments
Neutron powder diffraction (NPD) data to determine the magnetic structure of lt-Mn3(VO4)2 were recorded at the Institute Laue-Langevin (Grenoble, France) in the temperature range between 3 and 40 K on the high intensity powder diffractometer D20. The samples were enclosed in a large thin-walled vanadium cylinder. For recording, the high resolution mode including a radial oscillating collimator was applied and an angular range of 3° ≤ 2θ ≤ 150° (step width Δ2θ = 0.1°) was investigated. The total time for a single measurement was approximately 1.2 min. The wavelength of the measurement was determined using Na2Ca3Al2F14 to be 2.40 Å. A detailed description of the diffractometer can be found in ref. 15.Neutron powder diffraction (NPD) data to determine the nuclear structure of lt-Mn3(VO4)2 were recorded at the Institute Laue-Langevin (Grenoble, France) at temperatures of 2 K, 18 K, and 32.2 K on the D2B diffractometer. The wavelength of the measurement was calibrated using Na2Ca3Al2F14 to be 1.59 Å. A detailed description of the diffractometer can be found in ref. 16.
2.3 Refinement of the magnetic structure
Analysis of neutron diffraction data recorded on the D20 diffractometer was performed using TOPAS Academic V517,18 in the angular range between 10° and 120° 2θ. Reflection broadening was described by convolution of a VOIGT function with a modified pseudo Voigt function according to Thompson–Cox–Hastings.19 Full details on the analysis and determination of the magnetic structure will be provided in section 3.1.
2.4 Refinements of the nuclear structure
After determination of the principle magnetic structures, the nuclear structures were analysed again using TOPAS Academic V517,18 in the angular range between 5 and 150° 2θ recorded on the D2B diffractometer. Reflection broadening was described by convolution of a VOIGT function with a modified pseudo Voigt function according to Thompson–Cox–Hastings.19 Positional parameters were refined for all atoms except for vanadium (for which the scattering length for neutrons is very low). Thermal parameters were refined independently, but the same types of atoms were constrained to the same value. Although the magnetic symmetry was shown to break the nuclear symmetry at lowest temperatures, no indications of peak splitting, misfit of intensity, etc. could be found and refinements within nuclear subgroups of Cmce did not give a significant improvement of the goodness of fit with insignificant shifts of the atoms from the positions being adopted within the Cmce symmetry. Therefore, all the nuclear structural data reported in this article refer to a nuclear symmetry of Cmce. At this point it is also worth mentioning that refining both, nuclear and magnetic structures at the same time did not result in significant changes of the magnetic moments as found for the data recorded on the D20 diffractometer.
2.5 DFT calculations
Density functional theory (DFT) calculations were performed using the real-space implementation of the GPAW code20 in conjunction with the PBE21,22 exchange–correlation functional including Hubbard U corrections.23 The transition metals are represented by projector-augmented wave setups that contain the outer 4s and 3d electrons as valence states. A grid-spacing of 0.18 Å and a Γ-centered 8 × 4 × 6 k-point mesh were used. With these computational parameters, we estimate the numerical accuracy for energy differences to be below ±5 meV per formula unit (13 atoms) which is well below the mean physical accuracy of state-of-the-art DFT calculations.Starting from the experimental structures, atomic positions were optimized until forces did not exceed 0.01 eV Å−1. Lattice parameters were then varied and the corresponding energy variations are fitted to quadratic forms as to obtain optimal lattice parameters for each system. At the optimal lattice parameters, atomic structures were finally re-optimized. Structure optimizations were performed using spin-paired calculations. For optimized structures, energetics and electronic structures were then evaluated using spin-polarized calculations with a ferromagnetic and an antiferromagnetic order (see section 3.4).
3. Results and discussion
3.1 Determination and characterisation of the magnetic structure of lt-Mn3(VO4)2
Neutron diffraction patterns recorded on the D20 diffractometer at various temperatures are depicted in Fig. 1 (40 K → 17 K) and Fig. 2 (18 K → 3 K). For temperatures below 25 K, the (0 2 0)Cmce reflection increases in intensity due to the arising of magnetic scattering, with the nuclear scattering contribution to this reflection being basically zero (Inuc/Imag ∼ 1%; see Fig. 1). Below 17 K, additional reflections which cannot be indexed within the nuclear space group Cmce appear, indicating a second magnetic phase transition (see Fig. 2). Those temperatures are in excellent agreement with the ones reported by Morosan et al. (Tm1 = 21 K and Tm2 = 15 K),1 and we assign those magnetic phases to be the HT1 (17 K < T < 25 K) and the LT1 phase (17 K < T).1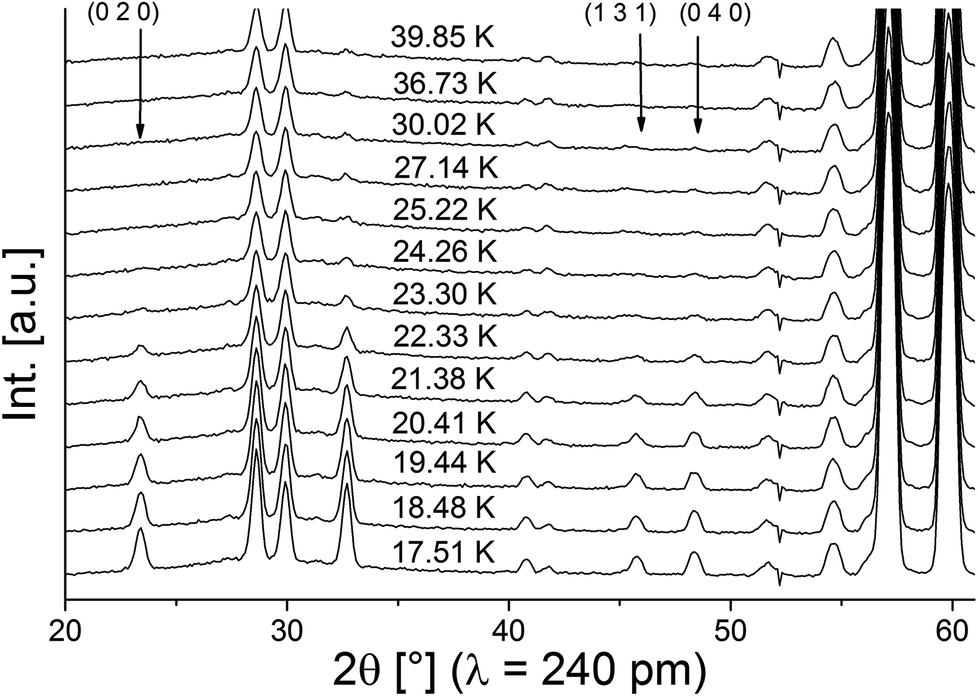 | ||
| Fig. 1 Neutron diffraction patterns of lt-Mn3(VO4)2 in the temperature range between 40 and 17 K. Indexes are given for selected reflections with high magnetic intensity (with Cmc′a′ being the magnetic symmetry). | ||
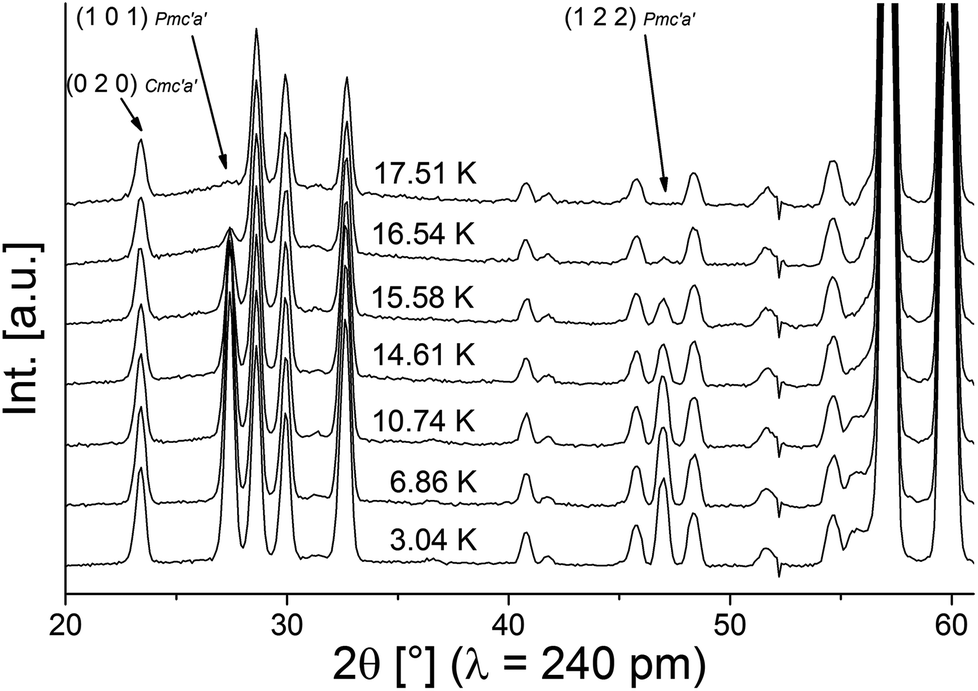 | ||
| Fig. 2 Neutron diffraction patterns of lt-Mn3(VO4)2 in the temperature range between 18 and 3 K. Indexes are given for selected reflections with high magnetic intensity (with Pmc′a′ being the magnetic symmetry). | ||
Pawley fits were performed to determine the magnetic k-vector. The HT1 phase can be well described using a single phase with symmetry Cmce, indicating k to be [0 0 0].
For the LT1 phase, it was found that the additional magnetic reflections cannot be described based on k = [0 0 0]. We therefore approached the determination of the magnetic k-vector by using Pawley fits with different subgroups of Cmce. Doing so, we observed that loss of C-centering is required (e.g. from the observation of the (1 0 1) reflection), e.g. the nuclear subgroups Pbnb (56) and Pmna (53) both can be used to obtain equally good description of the pattern. Loss of C-centering is consistent with a magnetic k-vector of [1 0 0].
In the next step, full Rietveld analysis was then performed on the patterns recorded at 3.04 K (for the LT1 phase) and 18.48 K (for the HT1 phase) using the nuclear structural model of lt-Mn3(VO4)2 as reported in ref. 4, refining only the lattice parameters but not the structural parameters. A second lt-Mn3(VO4)2 phase was added with a reduced symmetry of P1 for which only the magnetic scattering was calculated and for which structural and lattice parameters were constrained to the nuclear structural model to ensure the maintenance of the higher nuclear symmetry of Cmce. However, this reduced symmetry allows for independent refinement of the magnetic moments of all the 12 Mn ions (Mn1 at 4a and Mn2 at 8e within Cmce) per unit cell. Different starting models for the initial orientation of the magnetic moments were tested and the resulting magnetic structures were analysed using the tools provided on the Bilbao Crystallographic Server.24–29 The best fit obtained for the two different patterns can be summarized as follows:
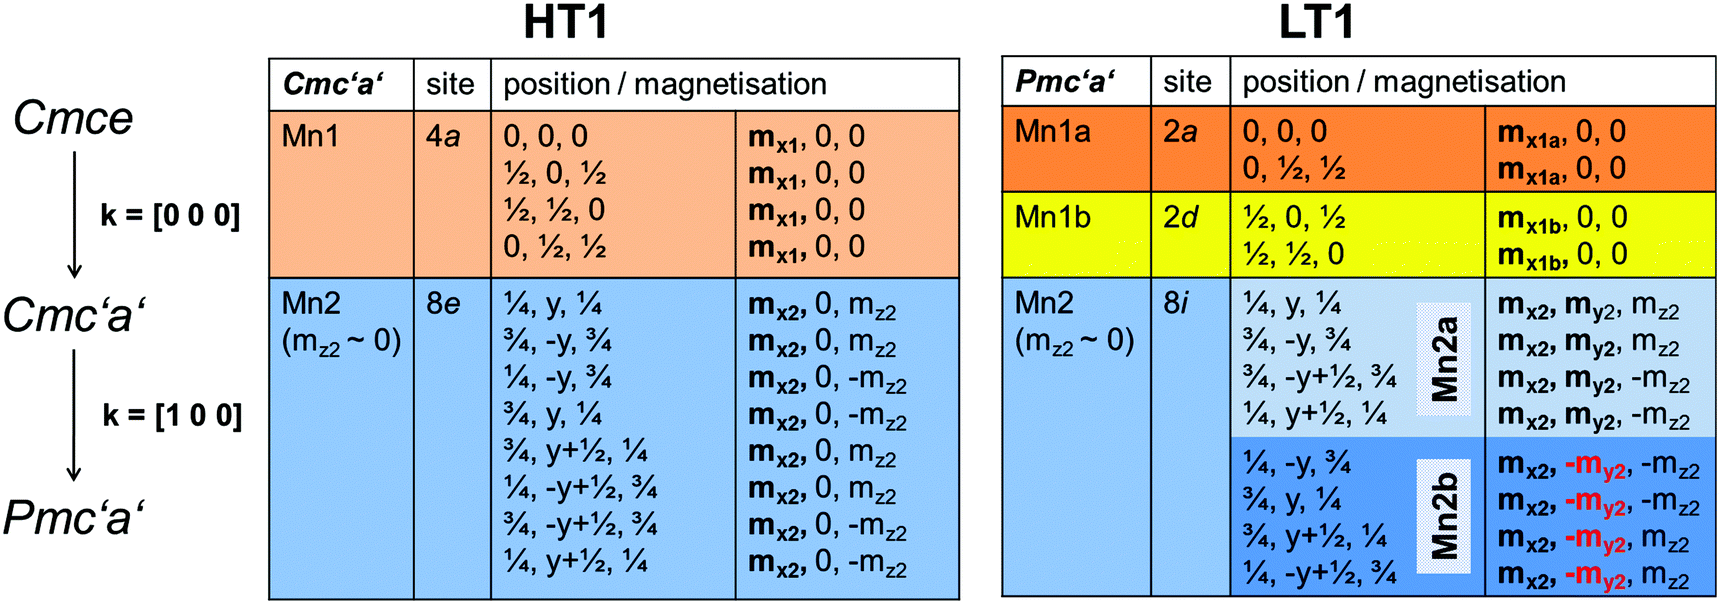 | ||
| Fig. 3 Symmetry and restrictions for magnetic moments for the transition from the paramagnetic to the HT1 and the LT1 phase of lt-Mn3(VO4)2. | ||
 | ||
| Fig. 4 Scheme of the magnetic structures of the HT1 (a) as well as the LT1 (b) phase of lt-Mn3(VO4)2 with view along the a-axis (Kagomé planes are stacked along the b-axis). (a): Mn1 ions (4a) are located in the orange, Mn2 ions (8e) are located in the blue octahedra. (b) Mn1a ions are located in the dark orange, Mn1b ions in the bright orange octahedra. Mn2a ions are located in the bright blue, Mn2b ions are located in the dark blue octahedra. Moments on atoms with the same colour of the octahedron all point towards the identical direction. | ||
Refined diffraction patterns of lt-Mn3(VO4)2 at 3.04 K (LT1), 18.48 K (HT1) and 39.9 K (paramagnetic PM) using magnetic structural models as described above are depicted in Fig. 5. At this point, we would like to point out that we also tried to refine the magnetic scattering using different magnetic space groups (e.g. other magnetic subgroups of Cmce with k = [0 0 0]) for the measurements at 3.04 and 18.48 K, but such structural models did not result in a proper description of intensities of the magnetic scattering, with Rwp values significantly higher according to Hamilton's test.30
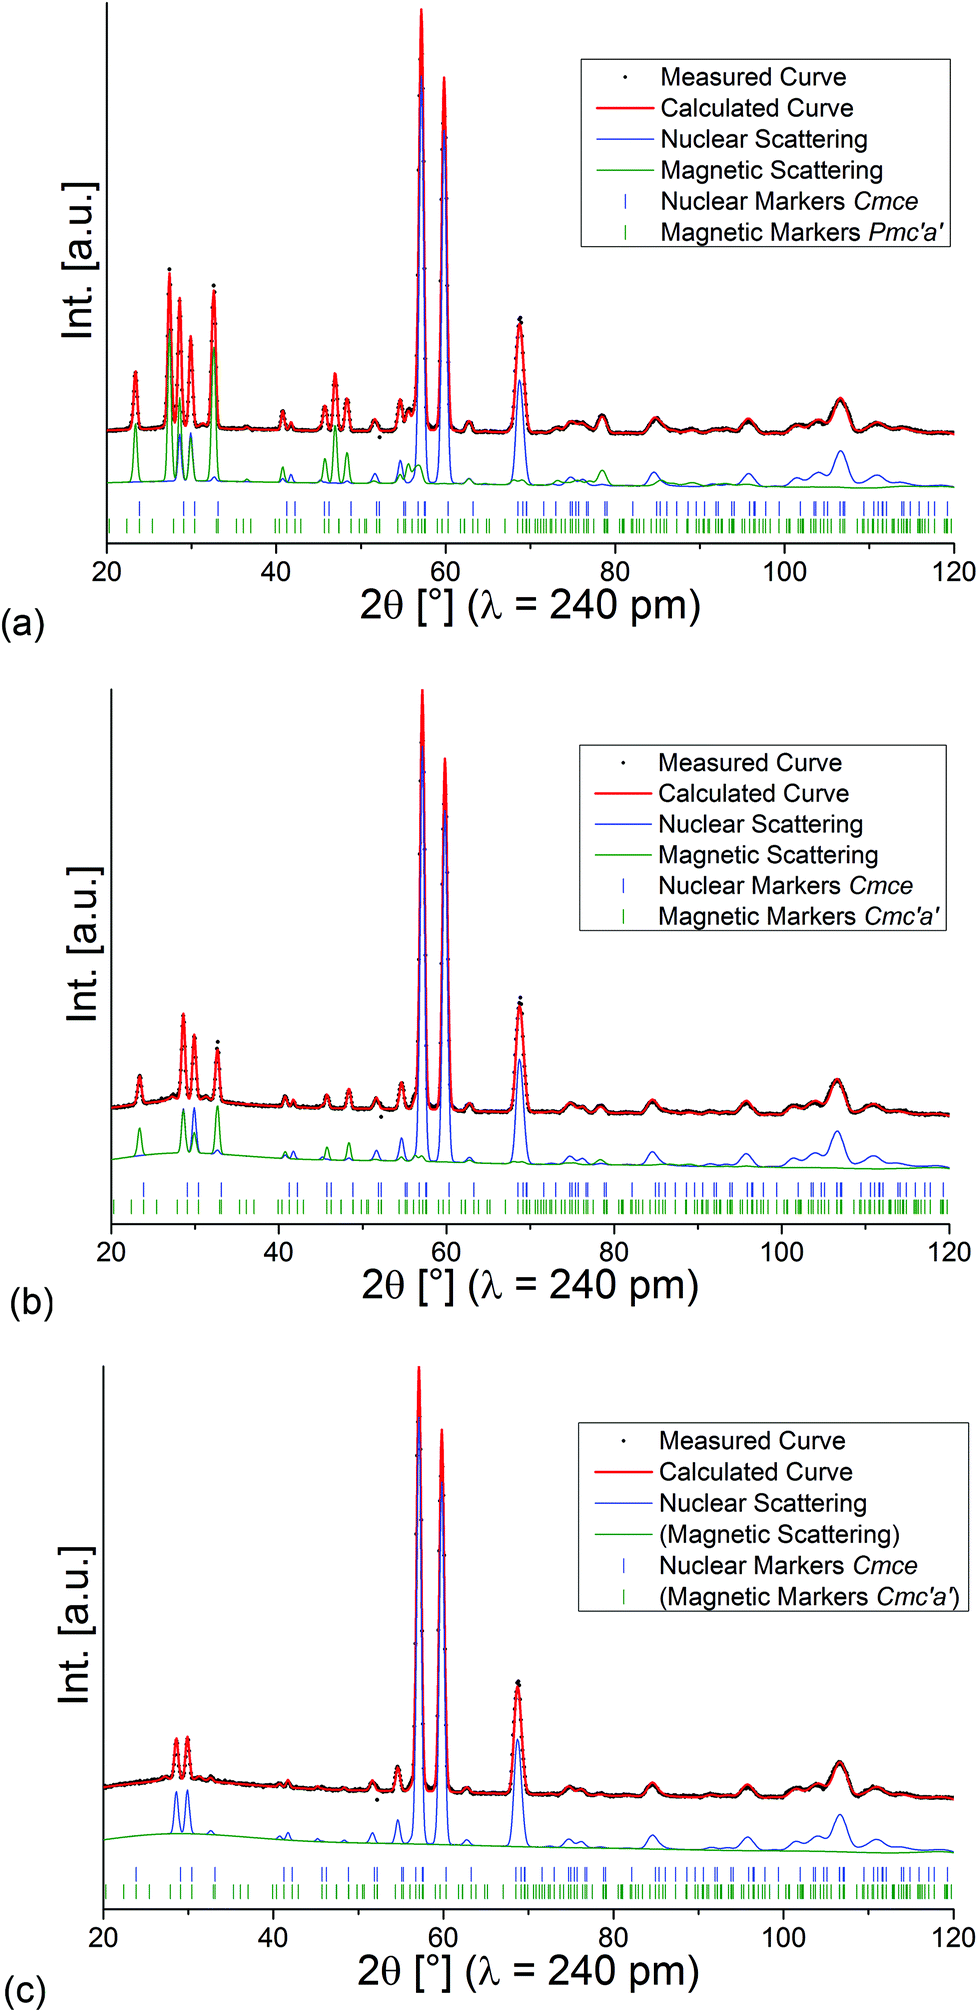 | ||
| Fig. 5 Rietveld analysis of the neutron diffraction patterns recorded for lt-Mn3(VO4)2 at 3.04 K (a), 18.48 K (b), and 39.9 K (c). | ||
We also performed a detailed analysis of the nuclear structures at different temperatures based on the refinement of the higher resolution D2B data. The nuclear structures can be well described within the space group Cmce without further lowering of symmetry. Interestingly, it can be seen from the values given in Table 1 that only very subtle structural changes of bond distances and angles can be observed on cooling the compound to temperatures below the magnetic ordering temperatures. Those changes mainly arise from the shift of the O1 and O2 ions, which mainly affects the bond angles ∢(Mn2–O1–Mn2) as well as ∢(Mn2–O2–Mn2), and causes a shrinkage of the bond distance d(Mn2–O2) and an increase of the bond distance d(Mn2–O1). In addition, the bond distance between Mn1 and Mn2 is found to decrease, whereas the bond distance between Mn2 and Mn2 remains rather constant (i.e. the small shift of Mn2 compensates for the decrease of cell volume on cooling for this distance).
| Temperature (Phase) | 2 K (LT1) | 18 K (HT1) | 32.2 K (PM) | 100 K (PM) | RT2 (PM) |
|---|---|---|---|---|---|
| ∢(Mn1–O3–Mn2) [°] | 89.1 | 89.1 | 89.0 | 89.4 | 89.3 |
| ∢(Mn1–O2–Mn2) [°] | 90.4 | 90.5 | 90.4 | 90.6 | 90.2 |
| ∢(Mn2–O1–Mn2) [°] | 95.9 | 96.0 | 95.9 | 97.1 | 96.7 |
| ∢(Mn2–O2–Mn2) [°] | 88.8 | 88.8 | 88.9 | 88.1 | 88.1 |
| d(Mn1–Mn2) [Å] | 3.08 | 3.08 | 3.08 | 3.10 | 3.09 |
| d(Mn2–Mn2) [Å] | 3.12 | 3.12 | 3.12 | 3.13 | 3.12 |
| d(Mn1–O2) [Å] (×4) | 2.11 | 2.10 | 2.11 | 2.10 | 2.11 |
| d(Mn1–O3) [Å] (×2) | 2.21 | 2.21 | 2.21 | 2.22 | 2.22 |
| d avg.(Mn1–O) [Å] | 2.14 | 2.14 | 2.14 | 2.14 | 2.15 |
| d(Mn2–O1) [Å] (×2) | 2.10 | 2.10 | 2.10 | 2.09 | 2.09 |
| d(Mn2–O3) [Å] (×2) | 2.18 | 2.18 | 2.18 | 2.18 | 2.18 |
| d(Mn2–O2) [Å] (×2) | 2.23 | 2.23 | 2.23 | 2.25 | 2.25 |
| d avg.(Mn2–O) [Å] | 2.17 | 2.17 | 2.17 | 2.17 | 2.17 |
| a [Å] | 6.2343(1) | 6.2353(1) | 6.2345(1) | 6.2596(1) | 6.247(1) |
| b [Å] | 11.7162(2) | 11.7140(2) | 11.7158(2) | 11.7296(2) | 11.728(2) |
| c [Å] | 8.4874(2) | 8.4872(2) | 8.4866(2) | 8.4969(1) | 8.491(2) |
| R bragg, nuc. [%] | 1.38 | 1.37 | 1.47 | 1.19 | — |
| R bragg, mag. [%] | 1.89 | 2.49 | — | — | — |
3.2 Analysis of magnetic structures in relation to single crystal magnetisation data reported by Morosan et al.1
Morosan et al. already concluded that neutron diffraction would be a valuable tool to relate their observed properties to the magnetic and crystallographic structures.1 This holds also true the other way around, since the magnetic structures reported here must obviously relate to the magnetic properties of the compounds. Such comparison to the previous studies will be made in the subsequent paragraphs. We will compare the structures reported here to the magnetic measurements at relatively low fields reported by Morosan et al.,1 since our measurements were performed without application of a magnetic field.The temperature dependence of the magnetic moments on the different Mn ions is shown in Fig. 6. The resulting overall ferrimagnetic moments along the a- and the b-axes (the axes which were found to show magnetic moments for at least one of the magnetic phases) as well as the resulting total ferrimagnetic moment are depicted in Fig. 7 (the reader should be aware that no net magnetisation is allowed for Pmc′a′ along the b-axis from the site moments given in Fig. 3). A schematic re-drawing of the magnetisation data reported by Morosan et al. recorded on a single crystal in different orientations is shown in Fig. 8.
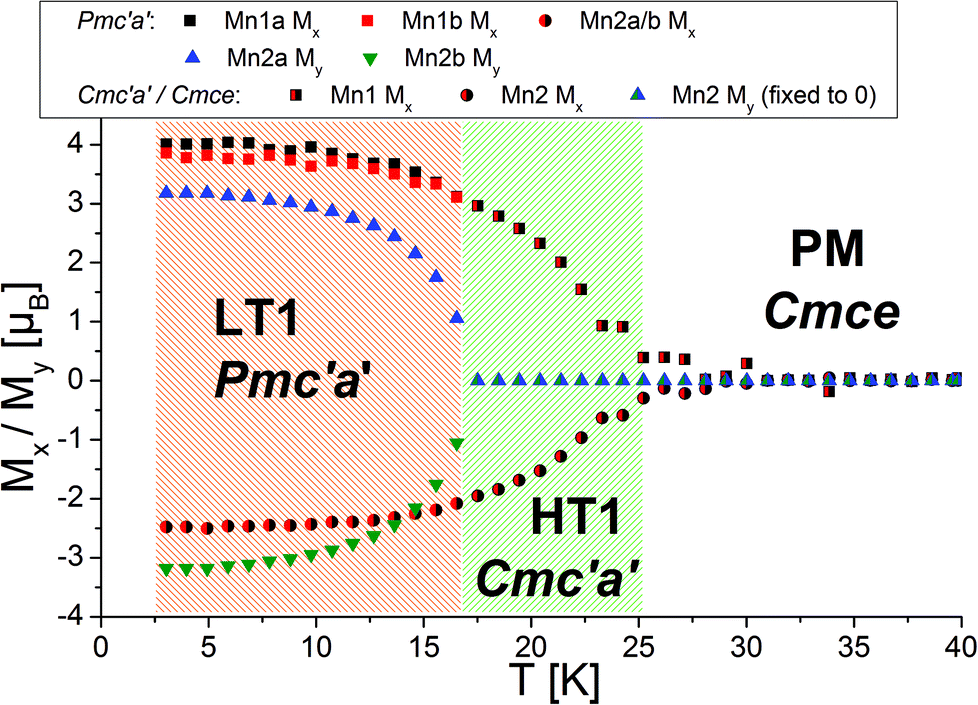 | ||
| Fig. 6 Temperature dependence of magnetic moments refined for different directions of different atoms within Pmc′a′ and Cmc′a′ symmetries. Standard deviations of the refined magnetic moments are in the order of ∼0.1–0.2μB. | ||
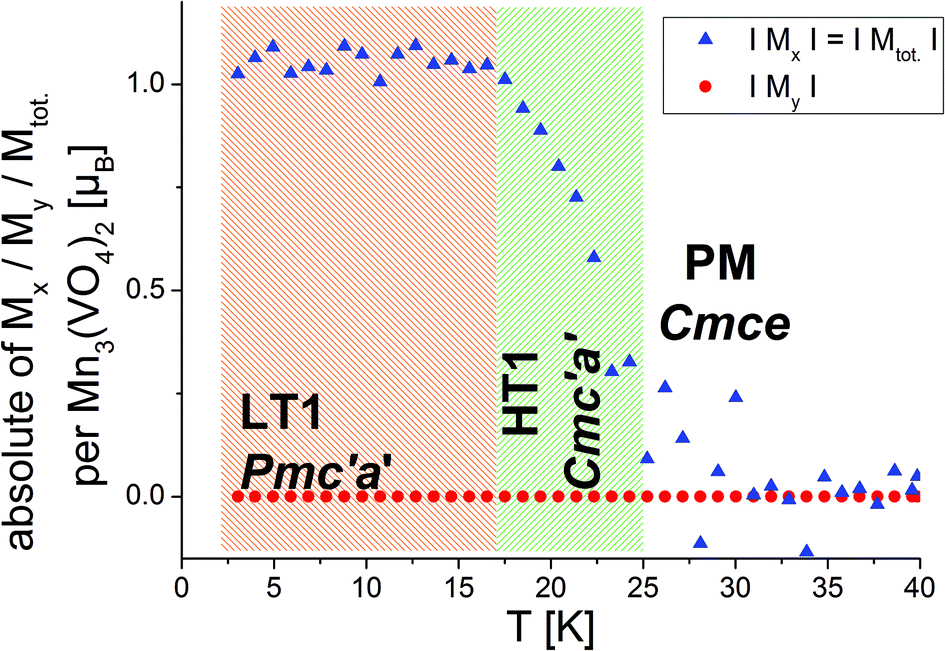 | ||
| Fig. 7 Ferromagnetic moment per Mn3(VO4)2 unit along the a- and the b-axes as well as in total. The overall magnetisation along the b-axis is restricted to be zero from magnetic symmetry for both, the LT1 and the HT1 phase (see Fig. 3). | ||
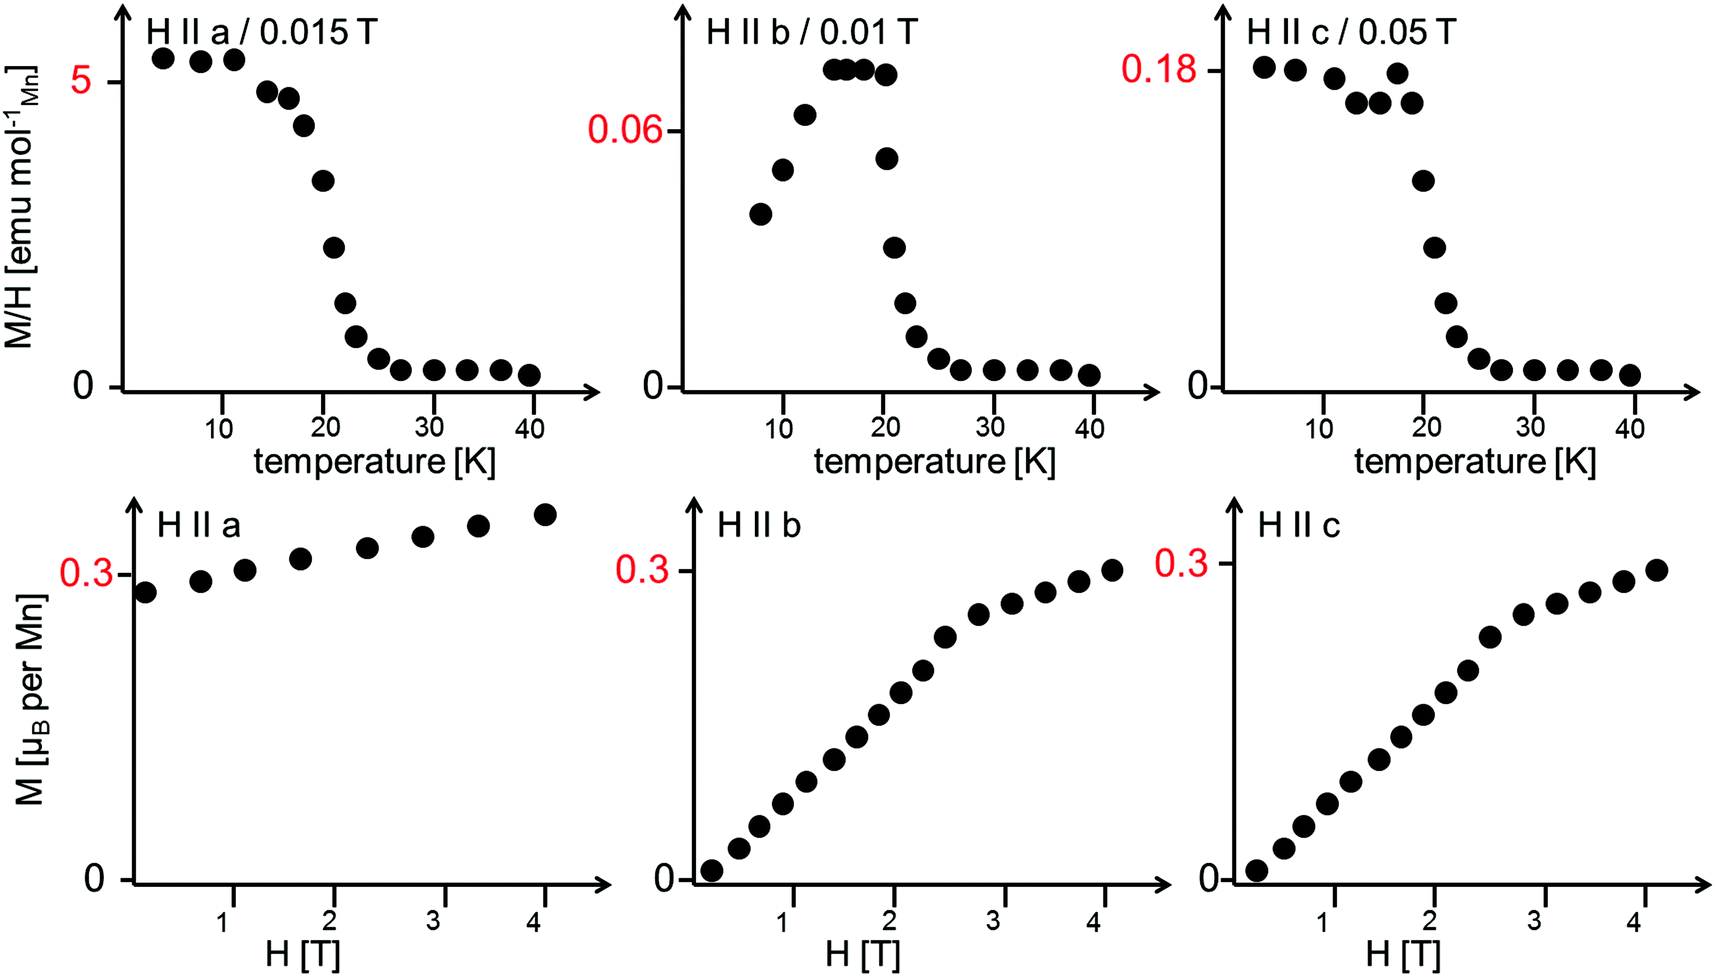 | ||
| Fig. 8 Schematic re-drawing of the magnetisation data as reported by Morosan et al.1 The reader should note the different scaling for the temperature dependence of the magnetisation. The field-dependent magnetisation curves were recorded at a temperature of 2 K. | ||
On a first note, a gradual transition from the lower symmetric LT1 phase to the higher symmetric HT1 phase is indicated from the refined moments depicted in Fig. 6. Again, this gradual transition is in agreement with the transition from Pmc′a′ to Cmc′a′ being a second order phase transition. The determination of the magnitude of the resulting ferrimagnetic moment along the different crystallographic axes as well as in total indicates an overall ferromagnetic moment of ∼1.1μB per Mn3(VO4)2 unit for the LT1 phase, which is only located along the a-axis (see Fig. 7). This value agrees well within errors with the findings of Morosan et al.1 (see Fig. 8) and of Wang et al.,2 where the latter report a ferrimagnetic moment of ∼1.5μB per Mn3(VO4)2 from SQUID measurements of a powdered sample from crushed single crystals.
The magnetic structures also agree well with the measurements reported by Morosan et al.,1 who report that the magnetic easy axis must lie within the ac-plane: our findings agree in this respect, showing that the a-axis is the magnetically easy axis which carries the main magnetic moment for both the HT1 as well as the LT1 phase, and along which the magnetic moment can be easily flipped. The c-axis was shown to carry only a low magnetic moment by Morosan et al.1 This agrees well with our findings which showed that the magnetisation along the c-axis must be considered to be close to zero with regards to what can be determined by neutron powder diffraction.
Morosan et al.1 described the b-axis as a magnetically hard axis and observed that the temperature dependent behaviour of the magnetisation along this axis is different compared to along the a- or the c-axis (compare upper figures of Fig. 8): on cooling, the magnetisation along the b-axis saturates in the existence range of the HT1 phase, and decreases in the existence range of the LT1 phase down to 2 K (with its absolute value being very small compared to what is found for the a-axis). This is in agreement with the strictly overall antiferromagnetic arrangement of the My component of the Mn2 ions for the symmetry of the LT1 phase (also see Fig. 3). The loss in magnetic ordering along the b-axis was also found for the phase transition from the LT1 to the HT1 phase of Ni3(VO4)2.14 The orientation of magnetic moments mainly along the a-axis is also observed for the incommensurately ordered magnetic compound Co3(VO4)2.31
Compounds with a Kagomé staircase structure are well known for spin frustration within the Kagomé planes resulting from the triangular coordination situation of edge sharing MO6 octahedra. It is therefore important to investigate the magnetic structures found for Mn3(VO4)2 with respect to the indication of such spin frustration. For the HT1 phase, the magnetic moment of Mn1 was found to be ∼3μB just above the ordering temperature of the LT1 phase (18.48 K), whereas the overall magnetic moment of Mn2 was refined to be ∼2μB and therefore significantly smaller. This lowering of the magnetic moment is not the result of e.g. a high-spin to low-spin transition, but therefore most likely results from spin frustration on this site. Therefore, in the existence range of the HT1 phase, it is very likely that the individual Mn2 ions carry an additional moment along the b-axis. However, this moment must be considered to be randomly oriented, resulting in fluctuating degrees of ferromagnetic and antiferromagnetic interactions along the b-axis for the HT1 phase. This existence of magnetic correlations is also well reflected in the appearance of an “amorphous bump” for the HT1 phase (see the isoline plot32 shown in Fig. 9a). This bump appears at angles where additional magnetic reflections with high intensity are found for the LT1 phase, and therefore indicates that local short range ordering of magnetic moments might still exist. It is therefore reasonable to assume that My components of the magnetic moments also exist for the Mn2 ions of the LT1 phase, with orientations my2 and −my2 becoming likely similar. The magnetic transition to the LT1 phase releases spin frustration, and the overall magnetic moments on the Mn1a + b as well as Mn2 ions for the LT1 phase become nearly identical and very close to a value of ∼4μB at 3.04 K (also see Table 2 shown in section 3.3), being in excellent agreement with what was found for ht-Mn3(VO4)25 (4.4–3.6μB) and Mn2+ in a high spin state. This value was also observed for other chemically similar Mn2+ compounds, e.g. LiMnPO433 (∼4.0μB). However we recognize that this value can also be found to be significantly higher, e.g. ∼4.5–5.4μB for MnWO4.34 We therefore conclude that at least most of the spin frustration is released on the magnetic ordering shown by the LT1 phase, although some degree of spin frustration might even be maintained. A further explanation for the deviation from a higher value might be given by the fact that the magnetic moment determined by neutron diffraction is lowered from covalency of bonds to the ligands, and such covalent effects might be different for lt-Mn3(VO4)2 (see discussion of redox-induced superexchange interaction reported in section 3.4). Since L = 0 for Mn2+ must be assumed for Mn2+ in a high spin configuration (in agreement with what was found by DFT calculations reported later in this article), a potential orbital contribution to the magnetic moment can be regarded as less plausible.
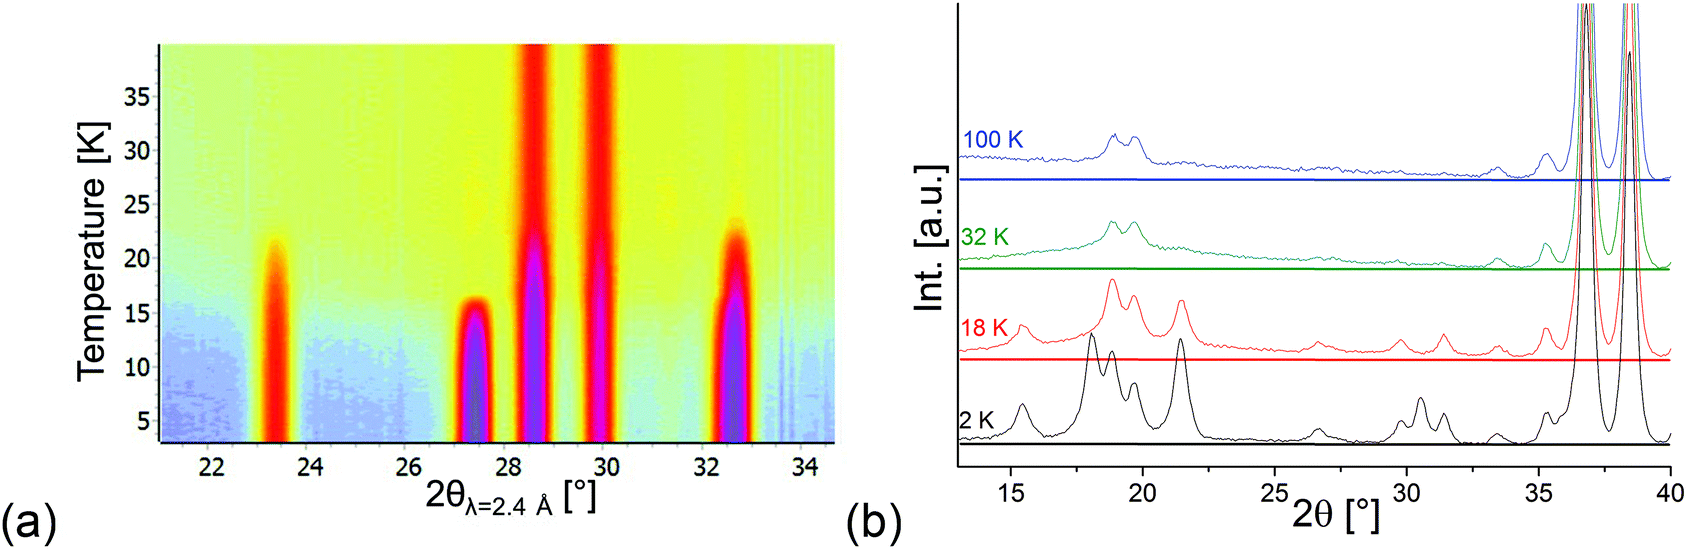 | ||
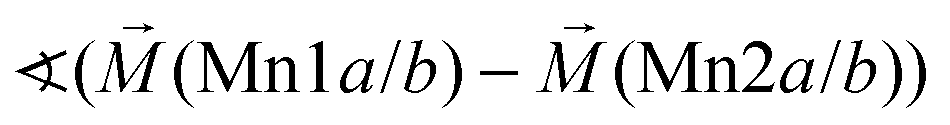
| Fig. 9 (a) Isoline plot made using HighScore32 of D20 data in the temperature range between 3 and 40 K. (b) Behavior of the background for D2B data recorded at different temperatures. | ||
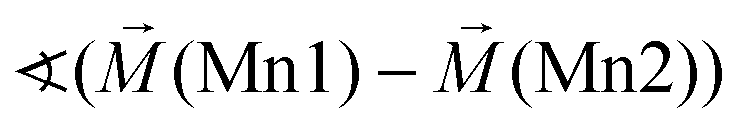
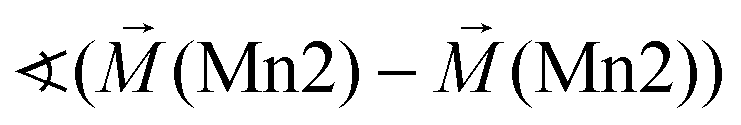
| Ion | M x [μB] | M y [μB] | M z [μB] | ∣ M ∣ [μB] |
|---|---|---|---|---|
| a The value of Mz′ was fixed to zero on refinement. As explained before, Mn2a and Mn2b do not represent two independent crystallographic sites, but only represent two different orientations found for magnetic moments of the Mn2 site | ||||
| Mn1a | 4.01(13) | 0 | 0 | 4.0(1) |
| Mn1b | 3.86(16) | 0 | 0 | 3.9(1) |
| Mn2a | −2.48(5) | 3.18(4) | 0a | 4.0(1) |
| Mn2b | −2.48(5) | −3.18(4) | 0a | 4.0(1) |
| Angles between magnetic vectors | ||||
|
128° | |||
|
104° | |||
The “amorphous magnetic bump” persists for temperatures above 25 K (i.e. in the paramagnetic state), but disappears when increasing the temperature significantly further (see Fig. 9b). This observation evidences the presence of short range magnetic interactions persisting well above the HT1 phase transition temperature.
Ni3(VO4)2 was reported to show a magnetically driven ferroelectric order at lower temperatures.13 However, the structural analysis reported here suggests that the magnetic phase transitions found for Mn3(VO4)2 do not break the spatial inversion symmetry for this compound, ruling out the possibility for multiferroic properties. Both magnetic space groups Pmc′a′ as well as Cmc′a′ exhibit the magnetic point group mm′m′ and thus prohibit the appearance of a linear magnetoelectric effect.35
The magnetic structures reported here also show that the transition from the HT1 to the LT1 phase does not result from “the ordering of the spins on one or both of the distinct Mn2+ ions in the ac-plane” as assumed by Morosan et al.,1 but only originates from the strict antiferromagnetic ordering of the b-axis component of the magnetic moment of the Mn2 ions and the release of spin frustration. Overall, the magnetic structures reported here agree well with the magnetisation measurements reported by Wang et al.2 and Morosan et al.1
3.3 Deriving an understanding of the magnetic structure of the LT1 phase with regards to possible superexchange interactions within the Kagomé plane
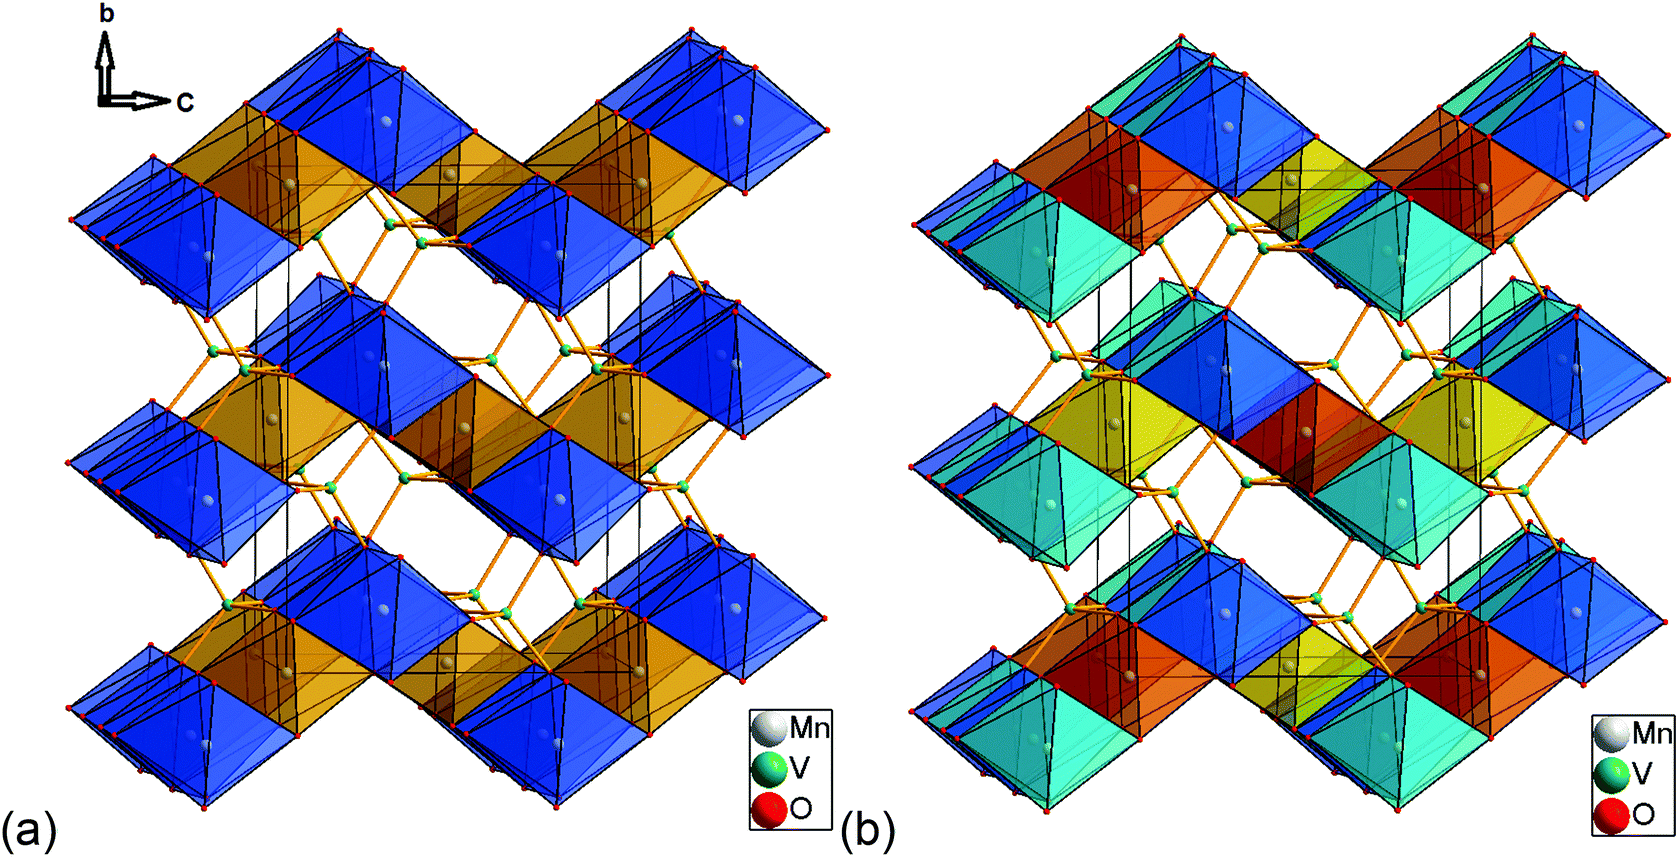
Excerpts of the magnetic structures of the LT1 and the HT1 phase are shown in Fig. 10. Since local (but not overall) ordering of moments within the b-plane is still likely in the HT1 phase (see discussion before), exchange interaction pathways will be discussed based on the magnetic structural data of the LT1 phase determined at 3.08 K. An overview of relevant bond angles and distances determined by analysis of the D2B data is already given in Table 1, a summary of the magnetic moments found for the different Mn ions for the LT1 as well as for the HT1 phase are given in Tables 2 and 3 respectively.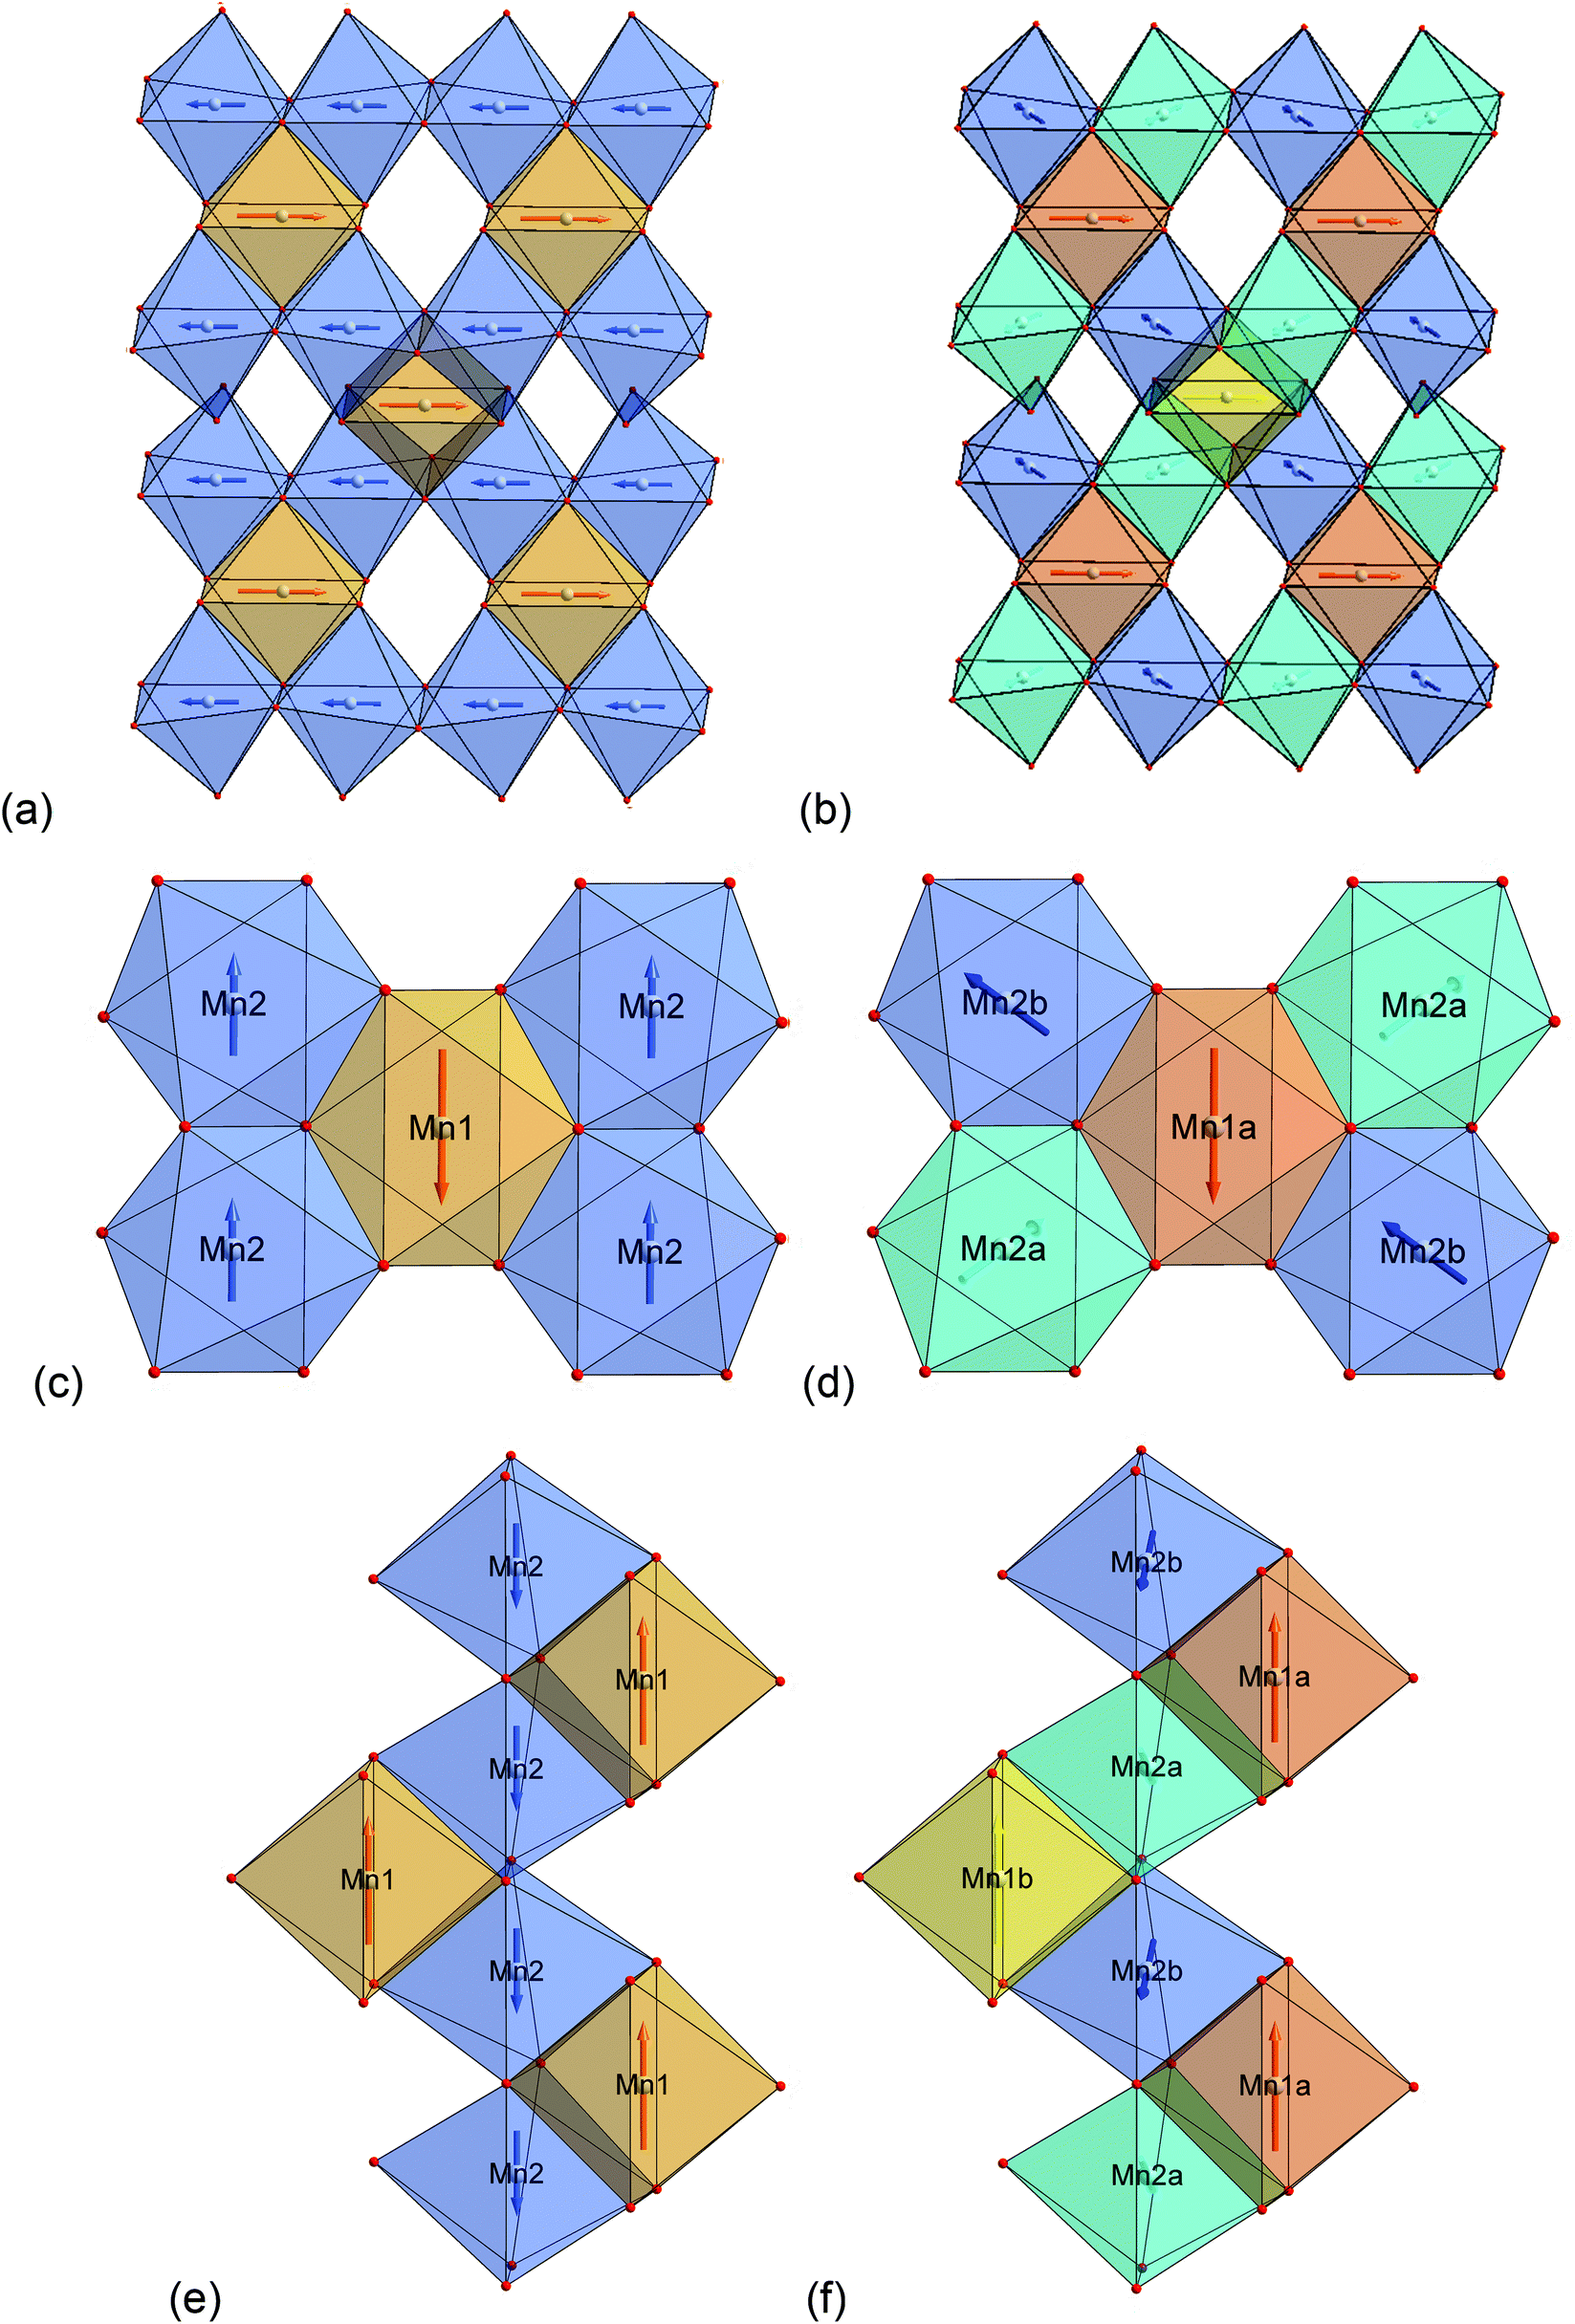 | ||
| Fig. 10 Structure plots comparing the magnetic structure of the HT1 (a, c, e) with the LT1 (b, d, f) phase of lt-Mn3(VO4)2 within one Kagomé staircase plane. Mn1a ions are located in the dark orange, Mn1b ions in the bright orange octahedra. Mn2a ions are located in the bright blue, Mn2b ions are located in the dark blue octahedra. (a) and (b) Single Kagomé plane, view slightly tilted along the b-axis; (c) and (d) interconnectivity of Mn1 and Mn2 site, viewing direction between the b- and c-axis; (e) and (f) excerpt of a single spine, view along the b-axis. | ||
As already discussed above, the Kagomé staircase structure usually gives rise to spin frustration between edge sharing Mn octahedra within the Kagomé planes due to the triangular interaction situation, and this magnetic frustration is mainly released on a transition from the HT1 to the LT1 phase. To understand the magnetic structure of the LT1 phase of lt-Mn3(VO4)2, it is therefore necessary to consider potential magnetic superexchange interactions for edge sharing octahedra between two d5 high spin cations:36,37
1. Direct interactions between d5 high spin cations result in antiferromagnetic alignment of the magnetic moments.
2. Superexchange promoted via an oxygen p-orbital for a 90° bond angle which forms a pσ bond to one Mn ion and a pπ bond to the other one is antiferromagnetic.
3. Superexchange promoted via two different oxygen p-orbitals for a 90° bond angle which form two pσ bonds to the Mn ions is ferromagnetic and weak (double excitation required).
4. Superexchange promoted via an oxygen p-orbital for a bond angle approaching 180°, which forms two pσ bonds to the Mn ions is antiferromagnetic and very strong. This situation could only be approached for strongly distorted octahedra and must be considered to be of subordinate importance for lt-Mn3(VO4)2.
Considering these possible exchange interactions, antiferromagnetic alignment seems to be the most favourable interaction for Mn2+ within the Kagomé planes. The angles between the magnetic vectors of the different Mn ions Mn1a/b and Mn2a/b are all larger than 90° (see Tables 2 and 3), which is consistent with such antiferromagnetic interactions. The magnetic structure found for the LT1 phase of lt-Mn3(VO4)2 is therefore favourable by facilitating mainly antiferromagnetic interactions between the neighbouring ions according to the superexchange interactions 1 and 2. In particular the angles found between the magnetic vectors of Mn1a/b to Mn2a and Mn2b are relatively high (128°, compare Table 2 to Table 3), highlighting those antiferromagnetic interactions. The angle between the magnetic vectors of Mn2a and Mn2b is lower (104°, again compare Table 2 to Table 3), but still above 90°. Although this interaction should therefore be considered to be of mainly antiferromagnetic nature, it shows the highest ferromagnetic contribution. This could possibly be explained from the subtle changes of the crystallographic structure (reported in Table 1) as follows: the Mn2a–Mn2b distance is larger by about 0.03 Å than for the Mn1a/b–Mn2a/b distance which might result in reduced direct antiferromagnetic interactions between Mn2a and Mn2b. In addition, the Mn1a/b–Mn2/ab distance decreases strongly when cooling down to low temperatures (see Table 1), again facilitating antiferromagnetic exchange between those sites. In addition, the bond angle ∢(Mn2a–O1–Mn2b) decreases by ∼1° on cooling, approaching a value of 90°. Such an angle closer to 90° is favourable for the ferromagnetic superexchange interaction (no. 3) between Mn2a and Mn2b. Again this is well supported by the fact that the alignment of the magnetic moments between those ions shows the lowest antiferromagnetic character (see Tables 2 and 3).
3.4 Comparison of the magnetic structures of the different M3(VO4)2 compounds (M = Mn, Co, Ni) – deriving an understanding of magnetic ordering between adjacent Kagomé planes
It is not surprising that superexchange interactions for lt-Mn3(VO4)2 (S = 5/2, L = 0) must be expected to differ in strength and kind from Co3(VO4)2 (d7, S = 3/2) and Ni3(VO4)2 (d8, S = 1) within the Kagomé planes, where superexchange is promoted via direct and indirect superexchange interactions between the interconnected MO6 octahedra: for Co3(VO4)2 ferromagnetic interactions along the channels of edge-sharing Co2 octahedra were reported by Chen et al.,31 whereas local antiferromagnetic interactions were reported to be dominant along the channels of edge-sharing Ni2 octahedra for the C′ phase (magnetic order stable close to 0 K) of Ni3(VO4)2 by Lawes et al..14 For Ni3(VO4)2, the incommensurability along the a-axis was also described to arise from the competing antiferromagnetic and ferromagnetic interactions between edge sharing Ni2 octahedra via the oxygen ions (direct exchange interactions via the double occupied t2g orbitals are non-bonding between two d8 cations, explained by the varying bond angles for ∢(Ni2–O1–Ni2) and ∢(Ni2–O2–Ni2) from 90.4 to 95° (i.e. an angular range which is very sensitive for the competition between both types of interactions).Remarkably, the different vanadates M3(VO4)2 (M = Mn, Co, Ni) also strongly differ with regards to their magnetic ordering between different Kagomé planes along the b-axis. For Mn3(VO4)2 we found ferromagnetic alignment of the Kagomé planes between the adjacent layers. In contrast, Ni3(VO4)2 shows antiferromagnetic alignment of Kagomé planes between the adjacent layers, and Co3(VO4)2 shows incommensurate ordering between the Kagomé planes along the b-axis, with antiferromagnetic as well as ferromagnetic ordering between the adjacent layers.31 The Kagomé layers are sort of held together by corner sharing of Mn octahedra with V tetrahedra, with the latter being a cation with d0 electron configuration and seeming at first glance not to contribute to magnetic interactions. In the following, we will try to derive a microscopic model for orbital interactions in lt-Mn3(VO4)2 by developing a new type of superexchange interaction model. This will allow for obtaining a more qualitative, chemically intuitive understanding of the differences of magnetic structures found for the Kagomé staircase compounds M3(VO4)2 (M = Mn, Co, Ni) between the adjacent layers.
Apart from the Kagomé staircase compounds, we also note some similarity of the findings reported here to what was observed for SrM2(VO4)2 compounds (M = Mn, Co). In the latter, a similar bonding situation with interconnected building blocks of M2+ being connected by bridging layers of tetrahedrally coordinated V5+ is found.38 For those two systems similar observations regarding the magnetic structures have been reported by Bera et al.,38 finding a ferromagnetic order via the bridging V5+ ions for the manganese compound, whereas the cobalt compound was found to show an antiferromagnetic as well as a ferromagnetic order being mediated by V5+.
Electron configurations of the different transition metal cations Mn2+, Co2+, and Ni2+ are summarized in Fig. 11. According to Goodenough36 superexchange between the adjacent Kagomé layers could be promoted via M–O–O–M superexchange, i.e. cation–anion–anion–cation interactions. For such superexchange interactions, rules for magnetic ordering would be expected to be basically the same as those for M–O–M superexchange interactions and depend on the M–O–O (instead of the M–O–M) bond angles. It must be noted that such superexchange interactions would have to be promoted basically via the eg orbitals of M2+ (i.e. the dz2 and dx2−y2 orbitals) which point directly towards the oxide ions. Remarkably, neither the M–O–O bond angles nor the occupations of the eg orbitals differ significantly for the three transition metal cations Mn2+, Co2+, and Ni2+. From them, mainly antiferromagnetic alignment would have to be expected for all the three compounds (see Fig. 12). Therefore, we think that such M–O–O–M superexchange interactions do not serve well to explain the ferromagnetic arrangement of spins between the adjacent Kagomé layers found for the HT1 phase of Mn3(VO4)2 (and also partially for Co3(VO4)2).
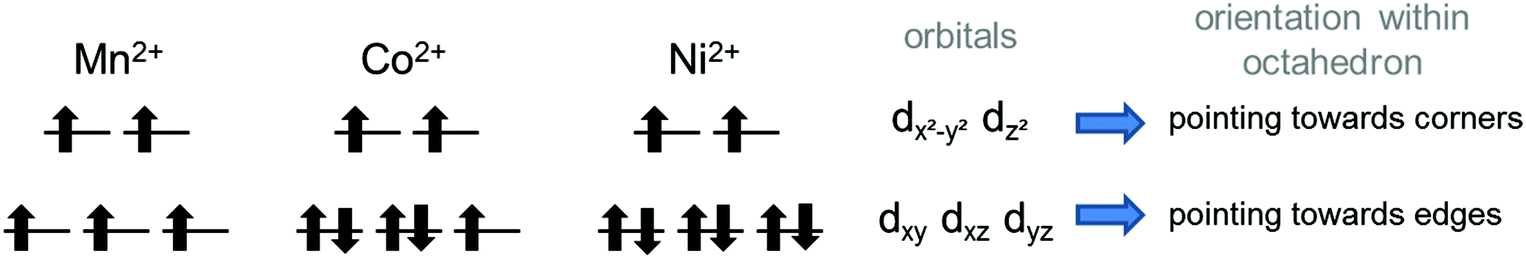 | ||
| Fig. 11 Electron configurations of the different divalent transition metal ion cations in their high spin states. | ||
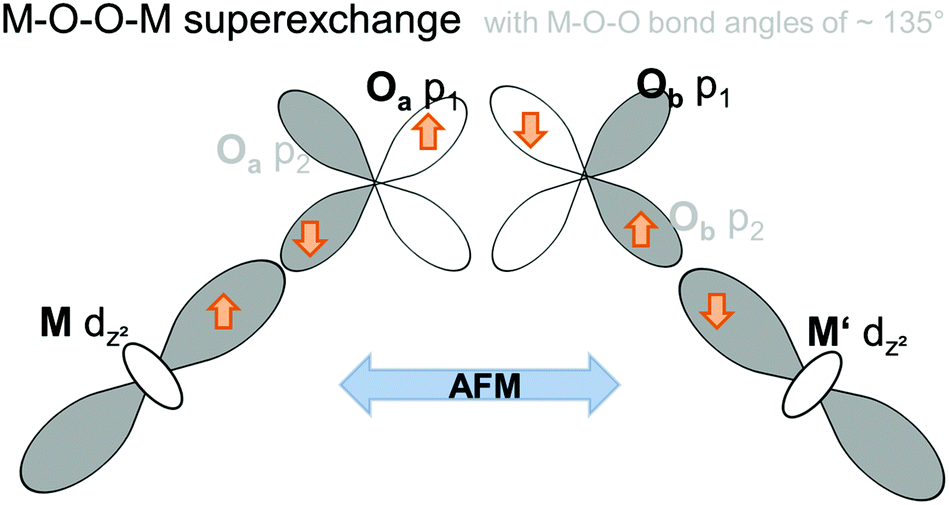 | ||
| Fig. 12 Schematic presentation of the antiferromagnetic M–O–O–M superexchange interaction promoted via half-filled eg orbitals of two M ions in adjacent Kagomé layers. | ||
In this respect, a different type than the M–O–O–M type of superexchange interaction might play a crucial role for Mn3(VO4)2 (and to some degree also for Co3(VO4)2), which might also be reflected by the fact that ordering between the adjacent Kagomé type layers arises at significantly different temperatures for the three different compounds (see Table 4). Such a difference is also found for the compounds SrM2(VO4)2 (M = Mn, Co).38 The ordering starts to occur at far higher temperatures for the Mn containing compounds, and is very similar between the Co and Ni containing compounds. It is also worth noting that the magnetic ordering temperature is significantly higher for ht-Mn3(VO4)2, for which a 3D-network of interconnected Mn2+ coordination polyhedra can be found. Again, this indicates that the type of interaction between the adjacent Kagomé planes can be assumed to differ significantly comparing Mn3(VO4)2 with Co3(VO4)2 and Ni3(VO4)2.
A different superexchange interaction found for Mn2+ containing compounds could potentially be promoted by virtual states which involve the empty d-states of the V5+ ions (d0 electron configuration). An influence of the vanadium d-states on the magnetic ordering was suggested by Koo and Whangbo39 in their study on Ba–Cu–V–O compounds using Extended Hückel Tight Binding (EHTB) calculations, where they considered antiferromagnetic exchange being promoted via the V5+ ions. Further proof of the involvement of vanadium states was obtained by a 51V NMR study by Ghoshray et al. for BaCu2(VO4)2,40 who found a non-zero spin density on the vanadium sites. Ben Yahia et al.41 were also aware of the importance of the vanadium d-levels for magnetic interactions in KMnVO4 (perovskite type compound), for which basically mainly antiferromagnetic interactions have been determined, but one of the four Mn2+ remained in a disordered state down to a temperature of 2 K. In the following, we will expand on these considerations using a qualitative structure–chemical approach, and will provide a model of a virtual state for superexchange interactions mediated by V5+ which could be used to explain ferromagnetic alignment between the adjacent Kagomé layers found for Mn3(VO4)2. We will call this type of interaction redox-mediated M–M′(d0-)–M superexchange, and give a detailed discussion on how it is facilitated and promoted for the very distinct type of structural arrangement found for lt-Mn3(VO4)2. We will also discuss why it should be less expressed for the respective Co and Ni containing compounds. In this respect, the reader will have to be provided with some background knowledge about the chemistry of the different M2+ systems with respect to their interaction potentials to V5+.
Clemens et al. already observed in an earlier publication that redox instabilities can arise between Mn2+ and V5+ depending on the initial ratio chosen between MnO and V2O5 when trying to prepare MnO*V2O5 compounds.42 In their case, a reaction with the formation of reaction products according to
| 21Mn2+O + 3V25+O5 → 4 Mn3+Mn42+V5+O8 + Mn2+V23+O4 |
Being aware that a sort of internal redox reaction between Mn2+ and V5+ is indicated from the chemical properties of the transition metal vanadates, DFT calculations were performed to obtain a deeper understanding of relative orbital energies. Two different magnetically ordered states were investigated: an antiferromagnetic and a ferromagnetic interlayer-ordering for all three M3(VO4)2 compounds (M = Mn, Co, Ni; see Fig. 13). For the ferromagnetic model, we used a model similar to the HT1 phase of Mn3(VO4)2. The antiferromagnetic model is related to the ferromagnetic model in such a way that the Mn1 and Mn2 sites were chosen to order antiferromagnetically within a single Kagomé staircase plane, with assigning antiferromagnetic alignment of the magnetic moments of Mn1 ions in one layer compared to an adjacent layer.
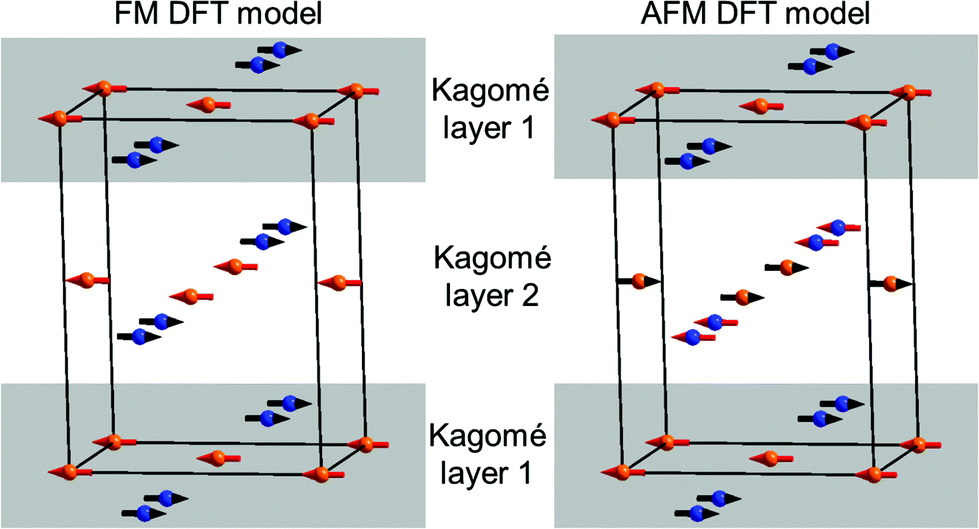 | ||
| Fig. 13 Substructure of the M ions (M = Mn, Co, Ni) used for spin polarized DFT calculations for the ferromagnetic (FM, left) and the antiferromagnetic (AFM, right) magnetic models. Blue ions refer to the M2 (8e) site, orange ions to the M1 (4a) site. For the DFT calculations, only overall up (red arrows)/down states (black arrows) were used and no direction of the magnetic vectors are given. | ||
Table 5 summarizes the results obtained for the DFT calculations on the different systems. For Co and Ni, it was found that the AFM ordering seems to be favourable for those compounds, with a small energy difference compared to the FM model. In contrast, we found that for Mn3(VO4)2, the ferromagnetic alignment of the layers gives a significant reduction of total energy, well agreeing with the magnetic structure found experimentally. On a further note, lattice parameters reasonably agree with what is observed experimentally.
It is a well-known phenomenon that energy corrections for the transition metal d-states need to be applied on such systems.23,48,49 Indeed, unreasonable densities of states with metallic properties were obtained without compensating for the effects of self-interaction. The energies used for the +U correction are listed in Table 5 and were chosen in relation to chemically similar compounds.48Fig. 14 gives an overview about the site projected density states for the M1@4a (orange), M2@8e (blue) and vanadium ions (green). The density of states calculated using the DFT+U method reasonably agree with a qualitative comparison to the optical properties of the compounds: tetrahedrally coordinated V5+ shows usually a white to yellowish colour due to a charge transfer transition from O2− to V5+, well expressed e.g. for compounds such as LiMgVO4 and Li3VO4.43,50 For Co3(VO4)2, its dark brown colour can be well explained from an interplay of a d–d transition for the Co2+ (purple) and a V5+–O2− charge transfer (yellow), the yellowish colour of Ni3(VO4)2 is well explained by a d–d transition for Ni2+ (yellow) and a V5+–O2− charge transfer (yellow). For Mn3(VO4)2, a d–d transition is forbidden from the selection rules, and compounds containing Mn2+ are usually found to show a white (e.g. LiMnPO443) colour if other transitions in the visible range of the energy spectrum are not present at the same time. Therefore, the strong red colour found for Mn3(VO4)243 would be explained by an additional charge transfer transition from Mn2+ to V5+. This is in principle agreement with the fact that such a transition would be allowed regarding the selection rules. Overall, these observations are in principle agreement with the tendency of the band gaps found in our DFT calculations.
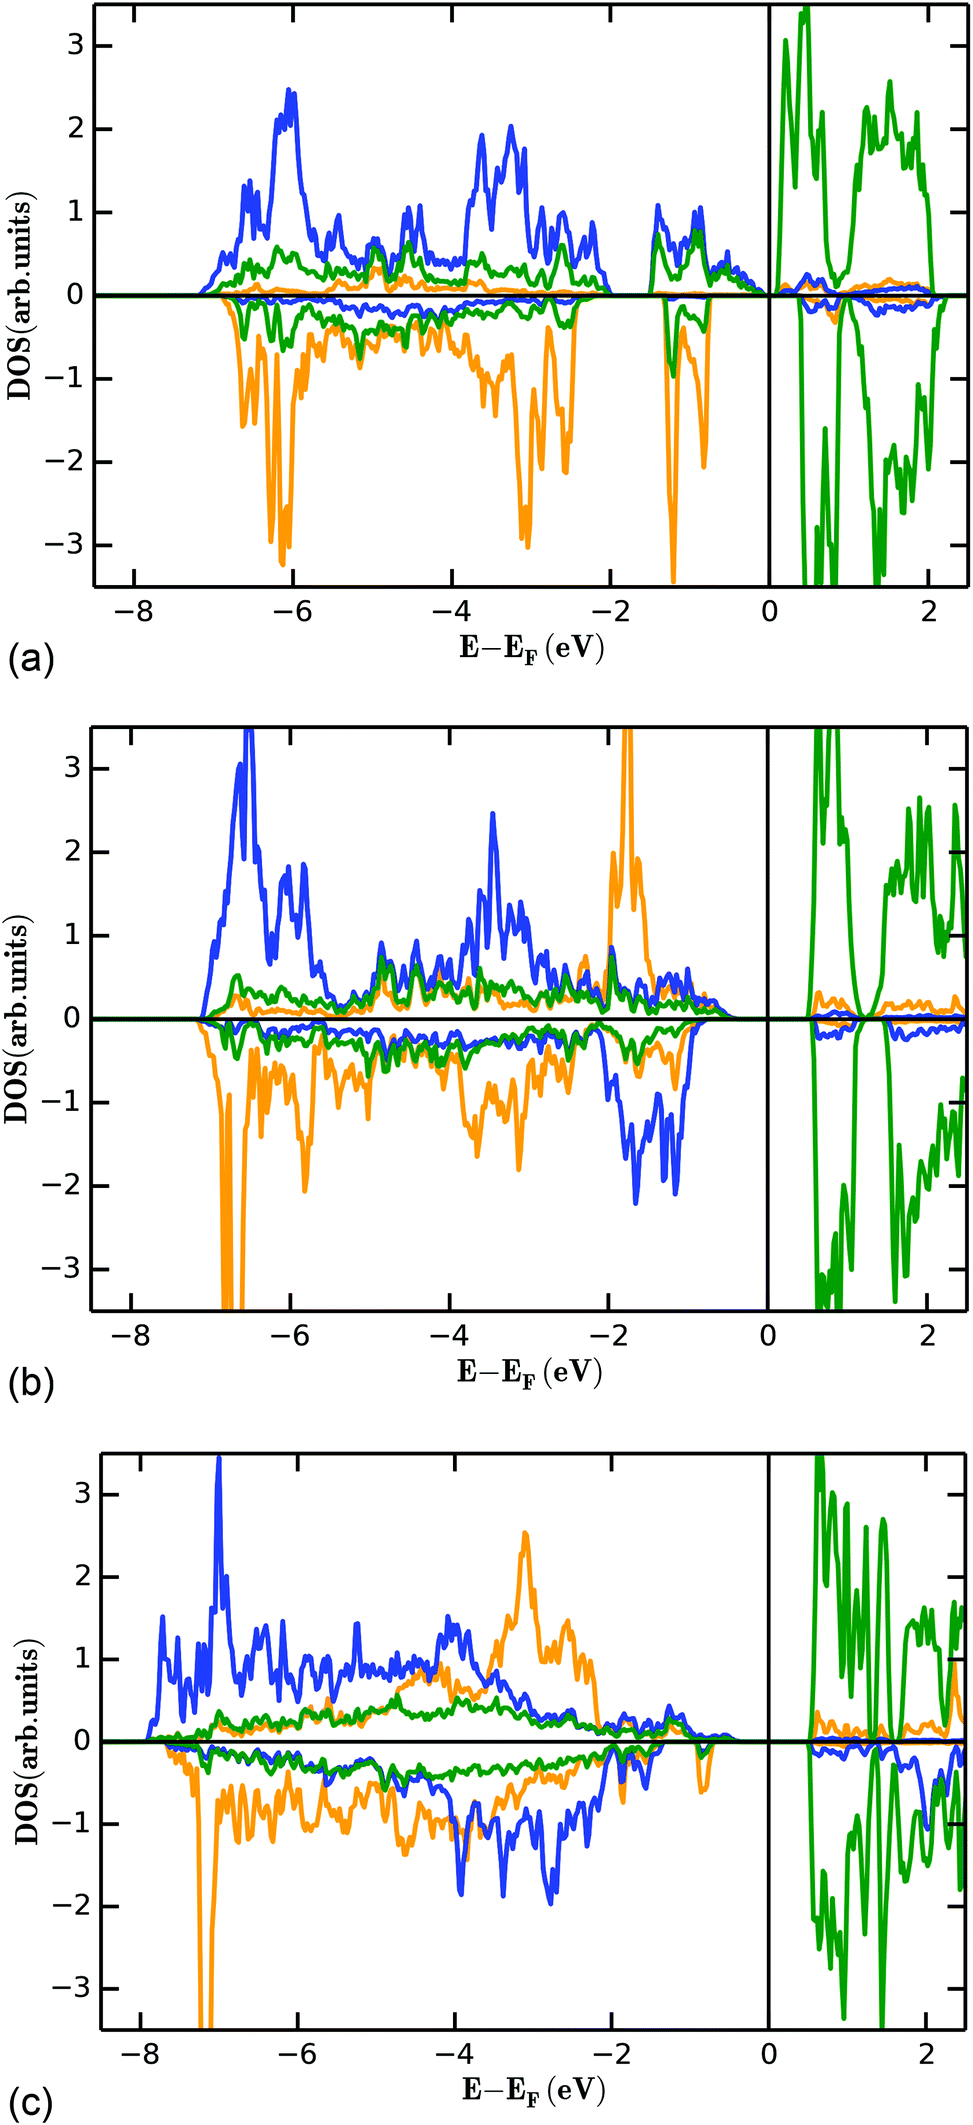 | ||
| Fig. 14 Partial density of states for the FM state (see Fig. 13) of the M1 (4a, orange), M2 (8e, blue) and vanadium (green) ions for Mn3(VO4)2 (a), Co3(VO4)2 (b), and Ni3(VO4)2 (c). | ||
The filled d-levels of the M2+ ions below the Fermi level approach the empty d-levels of vanadium above the Fermi level when changing from Ni→Co→Mn. This agrees well with the chemical properties of the compounds as discussed in previous paragraphs (e.g. oxidation potentials of LiMPO4 compounds). If the V5+ levels interact with the Mn2+ states to result in a superexchange interaction, it is a well-known principle of any bonding theory that the interacting states must be similar regarding their energy. Again, this phenomenon is well expressed for Mn3(VO4)2, where the occupied dx2−y2 and dz2 states close below the Fermi level are separated by only about 1 eV to the unoccupied d-levels of vanadium above the Fermi level. Additionally, we found that the splitting of the vanadium d-levels in the tetrahedral ligand field is significantly lower compared to the splitting of the d-levels of manganese in the octahedral ligand field, as would be expected.
Apart from the energetic similarity of orbital states, a reasonable orbital interaction pathway must be present to facilitate a superexchange interaction (which would translate to sort of a good overlap integral of the different atoms). Therefore, we will now discuss structural pathways with potential orbital overlap along which such ferromagnetic ordering interactions could arise within lt-Mn3(VO4)2. The following discussion will help to explain the ferromagnetic interactions found between the Mn2a and Mn2b ions for the LT1 phase, however, the reader should be aware that those considerations also hold true without any restriction for the magnetic structure of the HT1 phase (for which Mn2a and Mn2b are further combined to a single magnetic site).
The detailed structural situation found between the adjacent Kagomé layers in the LT1 phase of lt-Mn3(VO4)2 is depicted in Fig. 15a. At this point, the reader is reminded that for the HT1 phase, the bright and dark blue octahedra combine to a single site which is ferromagnetically aligned between the adjacent Kagomé layers. First we note that Mn1a/b cations of one Kagomé layer are not bridged via VO4 tetrahedra to Mn1a/b cations of the adjacent layer. Therefore, the Mn1a/b ions are likely to play a subordinate role for this redox mediated exchange interaction, and we will only consider the Mn2a/b cations in the following discussion. This is further supported by considering the partial density of states as shown in Fig. 14a, which shows that the d-orbital energies of Mn2 lie closer to the empty d-states of vanadium than the d-orbitals of Mn1, especially when comparing the spin up with the spin down states. Regarding the magnetic structure reported in the previous section, it is also clear that only ferromagnetic superexchange interactions appear to be dominant for the Mn2 ions of the HT1 phase of two adjacent Kagomé layers as soon as ordering between the adjacent Kagomé layers arises (the splitting to Mn2a and Mn2b sites is only observed when reducing the temperature further below ∼15 K). For the LT1 phase, it is furthermore worth noting that the vectors connecting the Mn2a (or alternatively Mn2b) ions with the oxygen ions of the vanadium tetrahedron form a nearly orthogonal coordinate system (arrows drawn in Fig. 15b) for the LT1 phase.
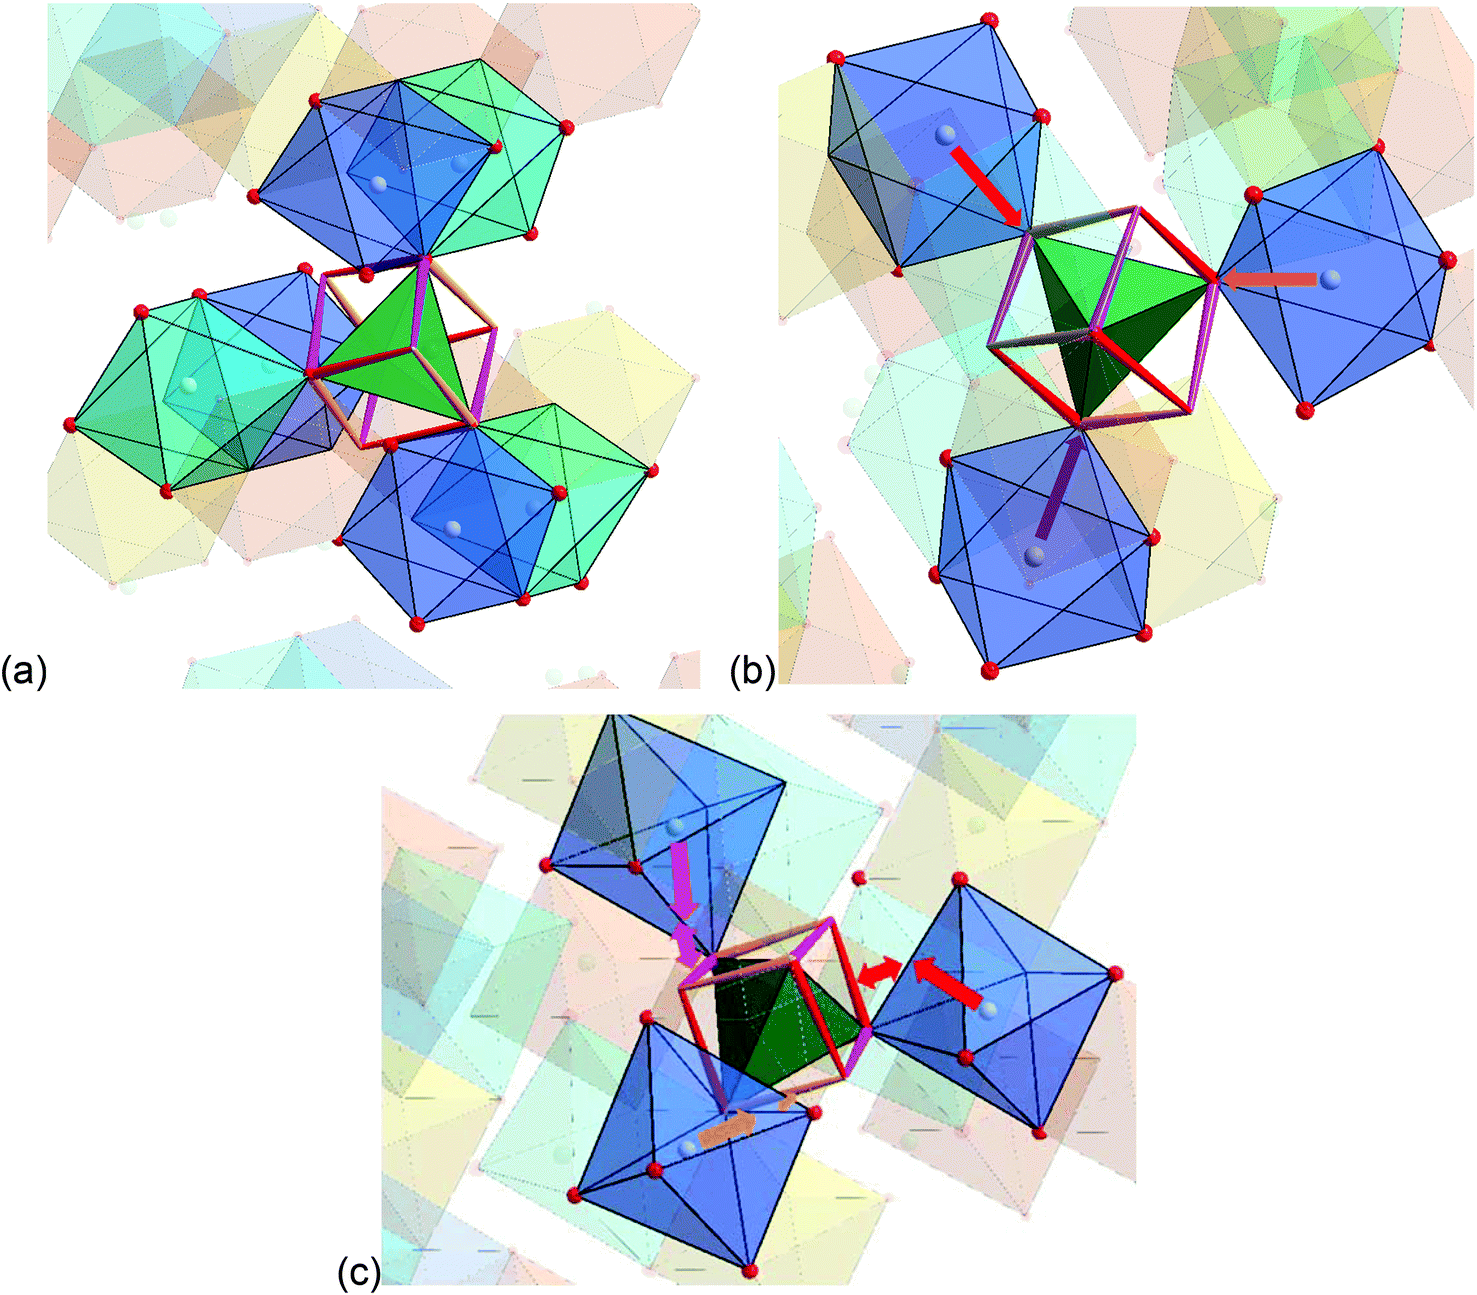 | ||
| Fig. 15 (a) Structure excerpt of the LT1 phase of lt-Mn3(VO4)2 to visualize the structural situation around the V5+ ion, which bridges adjacent Kagomé layers. A cube is drawn including the VO4 tetrahedron to highlight the orientation of the dxy, dyz, and dxz orbitals of V5+ (indicated by the red, purple, and orange edges of the cube). (b) Structure excerpt showing only the relative orientation of the Mn2b octahedra with respect to the bridging V5+ cation. Mn1a ions are located in the dark orange, Mn1b ions in the bright orange octahedra. Mn2a ions are located in the bright blue, Mn2b ions are located in the dark blue octahedra. For the HT1 phase of lt-Mn3(VO4)2, both the light and dark blue octahedra would show ferromagnetic alignment of their magnetic moments. (c) Potential pathway for direct interactions between the t2g orbitals of Mn2+ (indicated as coloured single tip arrows) with the t2 orbitals of V5+ (indicated as coloured edges of the cube). Double tip arrows are used to indicate the proximity of the edges of the respective polyhedra. | ||
To find stereochemically reasonable orbital interaction pathways, it is important to consider the orientations of the different orbitals of Mn2+ and V5+. For octahedral coordination, the low energy t2g (dxy, dyz, dxz) orbitals point towards the edges of the octahedron, whereas the high energy eg (dz2, dx2−y2) orbitals point towards the corners of the octahedron. For tetrahedrally coordinated vanadium, it is helpful to imagine a cube around the tetrahedron for the visualization of the orientation of the respective orbitals (see Fig. 15a and b). Within this cube, the high energy t2 orbitals point towards the edges of the cube (different t2 orbitals are indicated by the use of different colours for the edges in Fig. 15a and b), whereas the low energy e orbitals point towards the faces of the cube. One can now imagine two types of interaction pathways (indirect and direct), both of which can be used to explain the ferromagnetic alignment found between the Mn2a or the Mn2b ions.
– Indirect: superexchange could arise between the eg orbitals of Mn2a/b, for which the electrons would have to be mediated via the p-orbitals of the oxygen ligands to be transferred to the t2 orbitals of V5+ (see Fig. 16). From geometric considerations, one can easily see that the three different Mn2a/b ions connected to V5+ (see Fig. 15b) could transfer their electrons to different t2 orbitals of V5+ (double/triple excited state) via the oxygen ions. This would give rise to ferromagnetic superexchange interactions in agreement with Hund's rule. For such a superexchange interaction to take place it is important that the eg orbitals of Mn2+ as well as the t2 orbitals of V5+ as well as the p orbitals of O2− do not differ too much in energy, and this assumption is well supported by our observations and DFT based calculations described above. We consider this to be the most likely interaction pathway for lt-Mn3(VO4)2.
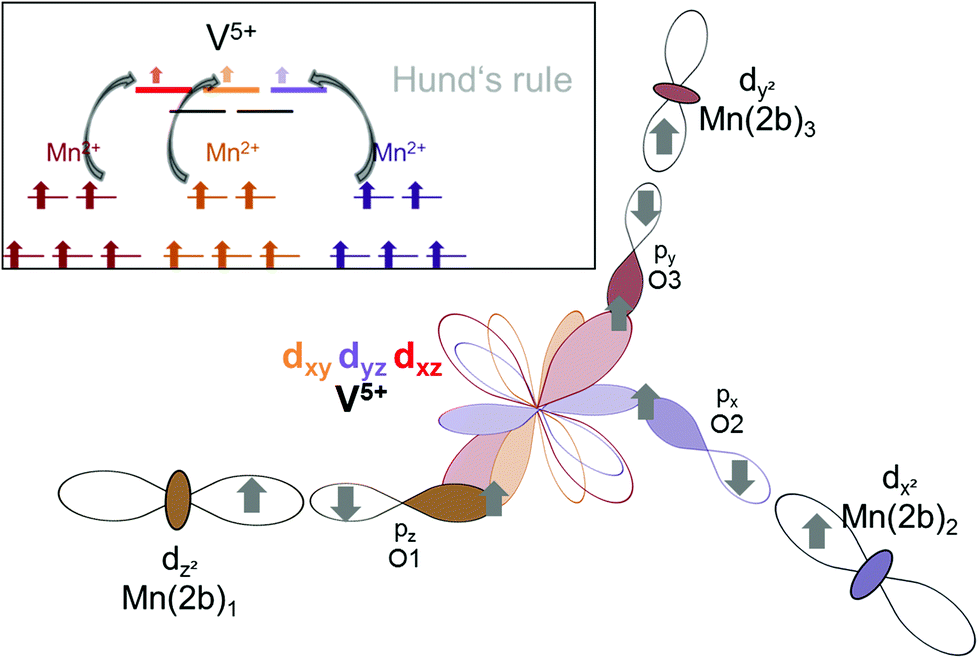 | ||
| Fig. 16 Orbital interactions for redox-mediated M–M′(d0-)–M superexchange expected in lt-Mn3(VO4)2. | ||
– Direct: additionally, one could also imagine a sort of direct interaction between the Mn2+ and the V5+ ions. Geometrically, this direct interaction cannot be mediated via the eg orbitals of Mn2+, since they are shielded by the oxide ions. Regarding the sketch shown in Fig. 15c, it can be seen that the edges of the octahedron (i.e. the place where the t2g orbitals of Mn2+ point at) as well as the edges of the cube (i.e. the place where the t2 orbitals of V5+ point at) are relatively close to each other (distances of the centres of the edges around 1.1 ± 0.07 Å). The Mn2+ shows an approximate distance of ∼1.50 Å to the centre of the edge of the octahedron, and the distance of the V5+ ion to one edge of the cube is approximately 1.4 Å. This sums up to an interaction length of 4 Å, which seems quite large and most likely renders the direct pathway to a lower importance, but is only ∼0.5 Å longer than the straight line connecting the Mn2+ and the V5+ ions via the O2− anions. Apart from the considerations of the relative energy levels of the M2+ ions as discussed above, it is also evident that the strength of such a direct redox-mediated M–M′(d0)–M superexchange would have to be different due to the different occupation of the t2g levels of Mn2+, Co2+, and Ni2+ (see Fig. 11). Since the t2g levels of Ni2+ are fully occupied, such a superexchange interaction would be basically forbidden, whereas for Co2+ it would be partially allowed. Since the other ligands of the MO6 octahedra connect to different adjacent Kagomé layers, ferromagnetic interactions could not be mediated to both adjacent layers, and this might give an additional increment to the explanations of the incommensurability along b for Co3(VO4)2 as given by Chen et al.31
4. Conclusions
We have shown that magnetic ordering of the low temperature modification of Mn3(VO4)2 results in two magnetic phase transitions at low temperatures. On cooling below ∼25 K, an antiferromagnetic order occurs between the magnetic moments on the Mn1 and Mn2 sites along the a-axis (HT1 phase, Cmc′a′), and this phase shows a high degree of spin frustration for the Mn2 site. Further cooling below ∼17 K results in an ordering of the magnetic moments along the b-axis for the Mn2 ions, resulting in a release of spin frustration (LT1 phase, Pmc′a′). Short range ordering of magnetic moments along the b-plane can also be inferred for the HT1 phase. The magnetic structures reported here agree well with the findings of Morosan et al.1 and Wang et al.2 and provide new insights into the magnetic ordering of spin-frustrated systems with strong antiferromagnetic interactions within the Kagomé staircase structure. Peculiar differences in interlayer magnetic ordering compared to Ni3(VO4)2 and Co3(VO4)2 help to derive a ferromagnetic superexchange interaction, which seems to be the predominant superexchange pathway for Mn3(VO4)2 and is promoted by V5+ with d0 electronic configuration due to its energetic closeness to the Mn2+ d-levels as well as the distinct coordination geometry found for the Kagomé staircase structure.Acknowledgements
The Institut Laue-Langevin is gratefully acknowledged for the allocation of beam time and technical support. O. Clemens wants to thank Prof. Dr H. P. Beck, Prof. Dr J. Manuel Perez-Mato, Prof. Dr K. Albe and Prof. Dr B. Albert for helpful discussion.References
- E. Morosan, J. Fleitman, T. Klimczuk and R. J. Cava, Phys. Rev. B: Condens. Matter, 2007, 76, 144403 CrossRef.
- X. Wang, Z. Liu, A. Ambrosini, A. Maignan, C. L. Stern, K. R. Poeppelmeier and V. P. Dravid, Solid State Sci., 2000, 2, 99–107 CrossRef CAS.
- G. M. Clark, R. Morley and A. N. Pick, J. Inorg. Nucl. Chem., 1977, 39, 1841–1843 CrossRef CAS.
- O. Clemens, R. Haberkorn and H. P. Beck, J. Solid State Chem., 2011, 184, 2640–2647 CrossRef CAS.
- O. Clemens, A. J. Wright, K. S. Knight and P. R. Slater, Dalton Trans., 2013, 42, 7894–7900 RSC.
- O. Clemens, R. Haberkorn, M. Springborg and H. P. Beck, J. Solid State Chem., 2012, 194, 409–415 CrossRef CAS.
- M. Kenzelmann, A. B. Harris, A. Aharony, O. Entin-Wohlman, T. Yildirim, Q. Huang, S. Park, G. Lawes, C. Broholm, N. Rogado, R. J. Cava, K. H. Kim, G. Jorge and A. P. Ramirez, Phys. Rev. B: Condens. Matter, 2006, 74, 014429 CrossRef.
- P. L. Wang, P.-E. Werner and A. G. Nord, Z. Kristallogr., 1992, 198, 271–276 CrossRef CAS.
- A. G. Nord and P.-E. Werner, Z. Kristallogr., 1991, 149, 49–55 CrossRef.
- E. E. Sauerbrei, R. Faggiani and C. Calvo, Acta Crystallogr., Sect. B: Struct. Crystallogr. Cryst. Chem., 1973, 29, 2304–2306 CrossRef CAS.
- H. Fuess, E. F. Bertaut, R. Pauthenet and A. Durif, Acta Crystallogr., Sect. B: Struct. Crystallogr. Cryst. Chem., 1970, 26, 2036–2046 CrossRef CAS.
- N. Qureshi, H. Fuess, H. Ehrenberg, T. C. Hansen, C. Ritter, K. Prokes, A. Podlesnyak and D. Schwabe, Phys. Rev. B: Condens. Matter, 2006, 74, 212407 CrossRef.
- G. Lawes, A. B. Harris, T. Kimura, N. Rogado, R. J. Cava, A. Aharony, O. Entin-Wohlman, T. Yildirim, M. Kenzelmann, C. Broholm and A. P. Ramirez, Phys. Rev. Lett., 2005, 95, 087205 CrossRef CAS PubMed.
- G. Lawes, M. Kenzelmann, N. Rogado, K. H. Kim, G. A. Jorge, R. J. Cava, A. Aharony, O. Entin-Wohlman, A. B. Harris, T. Yildirim, Q. Z. Huang, S. Park, C. Broholm and A. P. Ramirez, Phys. Rev. Lett., 2004, 93, 247201 CrossRef CAS PubMed.
- T. C. Hansen, P. F. Henry, H. E. Fischer, J. Torregrossa and P. Covert, Meas. Sci. Technol., 2008, 19, 034001 CrossRef.
- E. Suard and A. Hewat, Neutron News, 2001, 12, 30–33 CrossRef.
- Topas V4.2, General profile and structure analysis software for powder diffraction data, User's Manual, Bruker AXS, Karlsruhe, Germany, 2008 Search PubMed.
- A. A. Coelho, TOPAS-Academic, http://www.topas-academic.net, accessed 20th of October 2014.
- R. A. Young, The Rietveld Method, Oxford University Press, Oxford, 2002 Search PubMed.
- J. Enkovaara, C. Rostgaard, J. J. Mortensen, J. Chen, M. Dulak, L. Ferrighi, J. Gavnholt, C. Glinsvad, V. Haikola, H. A. Hansen, H. H. Kristoffersen, M. Kuisma, A. H. Larsen, L. Lehtovaara, M. Ljungberg, O. Lopez-Acevedo, P. G. Moses, J. Ojanen, T. Olsen, V. Petzold, N. A. Romero, J. Stausholm-Moller, M. Strange, G. A. Tritsaris, M. Vanin, M. Walter, B. Hammer, H. Hakkinen, G. K. Madsen, R. M. Nieminen, J. K. Norskov, M. Puska, T. T. Rantala, J. Schiotz, K. S. Thygesen and K. W. Jacobsen, J. Phys.: Condens. Matter., 2010, 22, 253202 CrossRef CAS PubMed.
- J. P. Perdew, K. Burke and M. Ernzerhof, Phys. Rev. Lett., 1997, 78, 1396 CrossRef CAS.
- J. P. Perdew, K. Burke and M. Ernzerhof, Phys. Rev. Lett., 1996, 77, 3865 CrossRef CAS PubMed.
- A. I. Liechtenstein, V. I. Anisimov and J. Zaanen, Phys. Rev. B: Condens. Matter, 1995, 52, R5467 CrossRef CAS.
- S. V. Gallego, E. S. Tasci, G. de la Flor, J. M. Perez-Mato and M. I. Aroyo, J. Appl. Crystallogr., 2012, 45, 1236–1247 CrossRef CAS.
- M. I. Aroyo, J. M. Perez-Mato, D. Orobengoa, E. Tasci, G. de la Flor and A. Kirov, Bulg. Chem. Commun., 2011, 43, 183–197 CAS.
- M. I. Aroyo, J. M. Perez-Mato, C. Capillas, E. Kroumova, S. Ivantchev, G. Madariaga, A. Kirov and H. Wondratschek, Z. Kristallogr., 2006, 221, 15–27 CAS.
- M. I. Aroyo, A. Kirov, C. Capillas, J. M. Perez-Mato and H. Wondratschek, Acta Crystallogr., Sect. A: Fundam. Crystallogr., 2006, A62, 115–128 CrossRef CAS PubMed.
- MAXMAGN in the Bilbao Crystallographic Server, http://cryst.ehu.es, accessed 20th of October 2014.
- MGENPOS in the Bilbao Crystallographic Server, http://cryst.ehu.es, accessed 20th of October 2014.
- W. Hamilton, Acta Crystallogr., 1965, 18, 502–510 CrossRef CAS.
- Y. Chen, J. W. Lynn, Q. Huang, F. M. Woodward, T. Yildirim, G. Lawes, A. P. Ramirez, N. Rogado, R. J. Cava, A. Aharony, O. Entin-Wohlman and A. B. Harris, Phys. Rev. B: Condens. Matter, 2006, 74, 014430 CrossRef.
- T. Degen, M. Sadki, E. Bron, U. König and G. Nénert, Powder Diffr., 2014, 29, S13–S18 CrossRef CAS.
- R. Toft-Petersen, N. H. Andersen, H. Li, J. Li, W. Tian, S. L. Bud'ko, T. B. S. Jensen, C. Niedermayer, M. Laver, O. Zaharko, J. W. Lynn and D. Vaknin, Phys. Rev. B: Condens. Matter, 2012, 85, 224415 CrossRef.
- G. Lautenschläger, H. Weitzel, T. Vogt, R. Hock, A. Böhm, M. Bonnet and H. Fuess, Phys. Rev. B: Condens. Matter, 1993, 48, 6087–6098 CrossRef.
- A. Authier, International Tables for Crystallography Volume D: Physical Properties of Crystals, Kluwer Academic Publishers, Dordrecht/Boston/London, 2013 Search PubMed.
- J. B. Goodenough, Magnetism and the Chemical Bond, Interscience Publisher, New York, 1963 Search PubMed.
- J. B. Goodenough, Phys. Rev., 1960, 117, 1442–1451 CrossRef CAS.
- A. K. Bera, B. Lake, W. D. Stein and S. Zander, Phys. Rev. B: Condens. Matter, 2014, 89, 094402 CrossRef.
- H.-J. Koo and M.-H. Whangbo, Inorg. Chem., 2006, 45, 4440–4447 CrossRef CAS PubMed.
- K. Ghoshray, B. Pahari, B. Bandyopadhyay, R. Sarkar and A. Ghoshray, Phys. Rev. B: Condens. Matter, 2005, 71, 214401 CrossRef.
- H. B. Yahia, E. Gaudin, C. Lee, M. H. Whangbo and J. Darriet, Chem. Mater., 2007, 19, 5563–5569 CrossRef.
- O. Clemens, R. Haberkorn, H. Kohlmann, M. Springborg and H. P. Beck, Z. Anorg. Allg. Chem., 2012, 638, 1134–1140 CrossRef CAS.
- O. Clemens, Ph.D. Dissertation, Universität des Saarlandes, 2011.
- O. Clemens, M. Bauer, R. Haberkorn and H. P. Beck, Z. Anorg. Allg. Chem., 2011, 637, 1036–1044 CrossRef CAS.
- O. Clemens, R. Haberkorn, M. Springborg and H. P. Beck, Z. Anorg. Allg. Chem., 2014, 640, 173–183 CrossRef CAS.
- A. K. Padhi, K. S. Nanjundaswamy and J. B. Goodenough, J. Electrochem. Soc., 1997, 144, 1188–1194 CrossRef CAS.
- O. Clemens, M. Bauer, R. Haberkorn, M. Springborg and H. P. Beck, Chem. Mater., 2012, 24, 4717–4724 CrossRef CAS.
- F. Zhou, M. Cococcioni, K. Kang and G. Ceder, Electrochem. Commun., 2004, 6, 1144–1148 CrossRef CAS.
- F. Zhou, M. Cococcioni, C. A. Marianetti, D. Morgan and G. Ceder, Phys. Rev. B: Condens. Matter, 2004, 70, 235121 CrossRef.
- L. L. Y. Chang and F. Y. Wang, J. Am. Ceram. Soc., 1988, 71, 689–693 CrossRef CAS.
Footnote |
| † Present address: PANalytical B. V., Lelyweg 1, 7602 EA, Almelo, The Netherlands. |
| This journal is © The Royal Society of Chemistry 2016 |